3C Reversal Filter v1In essence, this strategy is a heavily smoothed range filter.
This strategy includes a backtester and ability to connect it with your 3 commas bot(See adviced settings below)
The calculation steps below gives an example on how signals are made:
1. Calculating the price movement using ATR, % change, standard deviation etc..
2. Obtaining the smoothed price using SMA.
3. Obtaining the absolute value of the bar-to-bar change.
4. Applying EMA, twice, to the values in step 3.
5. Obtaining the slow trailing line by multiplying the result of step 4 by 1.618.
Think of it as a heavily smoothed price range
If the 1.618 value looks familiar, that’s because it’s used in Fibonacci sequences. You can of course experiment with other values. I’ve seen good results with both 2.618 and 4.236
What does the strategy do?
1. Determine Trend Detection
2. Detect Short-Term Momentum
3commas settings:
-For now you can only use simple bots.
-Create LONG and SHORT bots for the coins you like to trade and set up alerts(You can send long and short signal from the same alert)
-Set TP to 50% the strategy will handle buys and exits based on your inputs.
-Set safety orders to 0. I might add DCA to the strategy if testing proves that to be a good solution.
-When you have made the bots input the bot ID and token adress in the settings of the strategy.
-When creating the alert use this webhook :https://3commas.io/trade_signal/trading_view
-In the message field you use {{strategy.order.alert_message}} as the placeholder.
Scalping

Mean reversal QFL v3My aim is to make the bots trade as you would trading QFL manually and “by the book” or at least to my experience and understanding from the material out there of how you should plan a QFL trade.
Im absolutely not a pro trader, I have made my share of costly mistakes trying to be clever or Beeing impatient resulting in painful losses. QFL is we’re I’ve had consistently good results tough.
Is this where I have to say I’m not a financial advisor and all that? Well I’m not. As always Do your own research and backtest, backtest, backtest.
First: I believe no bot strategy are set and forget, while they can run unattended 80-90% of the time you're always going to find yourself in a situation where you will have to manually handle a bad deal. It would also make sense to be somewhat involved in the really good trades making the most out of them. That’s why understanding the strategy the bot Is using is really important, hence why I prefer QFL. It's an easy concept to understand, and proved to be a safe way of making steady profit in pretty much all market conditions if done right.
Some changes in how aggressive you are might be needed if you are the impatient kind of trader who needs to see a lot of deals happening. But it is an added risk. In those cases Luc would advise to start “nibbling” but that would be hard to implement in a bot but I will see if that’s something I can implement.
Same goes for going the more conservative route when market conditions calls for it.
QFL stands for Quickfingersluc, and sometimes it is referred to as the Base Strategy or Mean Reversals. Its main idea is about identifying the moment of panic selling and buying below the base level and utilizing Safety orders.
Base level or Support Level refers to the lowest price level that was reached before the moment the price started increasing again. At that level, you can notice that buyers of some cryptocurrencies make a strong reaction.
As a bit of a learning material i want to make a few points on important factors in trading using the QFL strategy:
• Identify strong bases
• Read the history of the chart
• No emotions
Trading QFL using a bot has it’s limitations:
· Some of the bases are questionable but im constantly trying to improve this
· The strategy don’t take into consideration chart history(success rate)*
· You need to follow a predefined (by you) buying ladder, hence not considering a particular coin's average price movement, which may vary quite a lot. This why I for now has limited the strategy to SIMPLE bots. So that unique alerts can be created for each pair.
· A set Take profit %, possibly making you miss out on higher profits(This is easy to change during a trade though), and no chance of selling in layers(This is coming soon).
1. Some of the bases are questionable
The strategy will start trades of bases that you wouldn’t consider being a strong base(or a base at all) when looking at the chart.
For those not as familiar with QFL. What is a base, and what qualifies as a strong base?
• A base is also called the Support Level, which is the lowest price level that was reached before the price started turning and increasing again.
• A strong base is recognized by a steep fall in price after breaking the base(Panic), followed by a big reaction pump.
• The reaction pump is the most important factor to say that it is a strong base.
• And also the last base, the one you are trading of is the one that counts
Tip: Look for V shapes on the chart, easy to spot when zoomed out.
2. The integrated signals don’t take into consideration chart history(success rate)*
How can you assess the success rate by looking at the chart?
After finding the bases based on the criterias from the 1st point. Looking at the, how many times did it respect the base after breaking it? 7/10, 8/10, 9/10 times? Great! Chances of the next trade also respecting the base is big, and I would consider raising the TP on that deal. Any lower than that I would keep a really close eye on the deal, or even consider closing the deal. And again remember the last base is the one that counts. If all the others are nice strong bases but that last one you are about to take a trade off is no good the base is invalidated so be cautious.
3. You need to follow a predefined (by you) buying ladder
Crypto is volatile, and there is a huge variation in price movements on all the coins.
Trading manually, looking at the chart gives you a good idea on how much a coin on avg. drops below base, and how big the following reaction is. This gives you an indication on how deep you need to set your layers, and where you can take profit.
Using the strategy you have the backtester to see how much max deviation has been in the past so that you can figure out what the optimal max deviation is.
4. A set Take profit %, possibly making you miss out on higher profits(This is easy to change during a trade though), and no chance of selling in layers.
Not going to say to much about this other than what I often do is:
When a bot has started a trade I usually take a look at the chart. If I like what I see, nice chart history, success rate and trading of a strong previous base etc, with the current base break resulting in a panic drop I will consider increasing the TP so that it will make more profit. This can be a bit risky but also very rewarding. Imagine filling all safeties and then selling just below base! Massive profits!! (Gotta be honest though, almost never stretch it that far with a bot though, but it is a possibility) .
If you have studied the chart and concluded that this particular trade has a 90% chance of success, there isn’t really any reason not to place TP just below base. This is where I would like to have the option of layering my sell orders as well so its something im working on implementing.
Trailing is an option in 3commas, but it’s slow to place orders making you miss a selling opportunity when the coin makes a sudden spike up.
ABOUT THIS STRATEGY
In this strategy we can also reverse the strategy and go short. But i must warn you that that is alot riskier.
QFL is meant to be used on higher TF's like 1hr, 2hr and 4hr. But this strategy also work well on lower Timeframes.
The script also simulates DCA strategy with parameters used in 3commas DCA bots for futures trading.
Experiment with parameters to find your trading setup.
Beware how large your total leveraged position is and how far can market go before you get liquidated!
Do that with the help of futures liquidation calculators you can find online!
Included:
An internal average price and profit calculating, instead of TV`s native one, which is subject to severe slippage.
A graphic interface, so levels are clearly visible and back-test analyzing made easier.
Long & Short direction of the strategy.
Table display a summary of past trades
Vertical colored lines appear when the new maximum deviation from the original price has
been reached
All the trading happens with total account capital, and all order sizes inputs are expressed in percent.
How to use:
- Add the script to the current chart
- Open the strategy settings
-Tweak the settings to to your liking.
-Make a SIMPLE bot in 3commas and use the same settings as you did in tradingview if you only want the strategy to send signals to open a deal and let 3commas handle the rest.
If you check safety orders, Take profit deal stop and Stop loss. The strategy will send all the orders to 3 commas. If that’s what you want set TP in 3commas to 50% set number of safety orders to 0 and keep stop loss unchecked.
- Insert bot details using the deal start condition message found in your 3commas bot.
- When happy, right click on the "..." next to the strategy name, then "Add alert'".
- Under "Condition", on the second line, chose "Any alert () function call". Add the webhook from 3commas( 3commas.io ), give it a name, use {{strategy.order.alert_message}} as a placeholder message and "create".
In the future this signal might make it to the 3commas marketplace. You can then subscribe to that signal where I have cherrypicked coins based on thorough backtesting and optimization.
How to obtain access to the script: send me a private message in Tradingview

3c Ultimate reversal strategy With scanner and backtester v2This might just be the ultimate strategy to identify reversals.
This strategy includes a scanner, a backtester and ability to connect it with you 3 commas bot(See adviced settings below)
Strategy:
-Signals reversal that happened in the last bar. This signal DO NOT repaint.
-Identifies potential reversal that might happen in the current bar but can also not happen depending upon the timeframe closing price.
-The strategy combines the Moving Average Trend Changer, SuperTrend (ATR price detection) and ADX.
-It reduces the number of false signals in sideways market conditons and give more reliable trade signals.
-The signal does not repaint and can be used in any market condition. It determines the trend with high precision.
Take profit:
-Set 2 separate TP conditions.
-You can take profit using percentage, ATR, or RR(Risk Reward), aswell as using Trailing Take Profit.
- Use sell signal from the strategy(I often find way better results using that)
Stoploss:
-You can use either ATR, Percentage or sell signal from the strategy
(For now to let the strategy itself decide when to TP or SL, just set these parameters really high.)
Scanner:
-Identifies coins that are currently in the sell zone
-Identifies coins that are currently in the buy zone
-Screener explores up to 20 pairs in current graph's time frame.
-Optimize the strategy to your liking and use the built in backtester to see if it is a viable strategy.
3commas settings:
-For now you can only use simple bots.
-Create LONG and SHORT bots for the coins you like to trade and set up alerts(You can send long and short signal from the same alert)
-Set TP to 50% the strategy will handle buys and exits based on your inputs.
-Set safety orders to 0. I might add DCA to the strategy if testing proves that to be a good solution.
-When you have made the bots input the bot ID and token adress in the settings of the strategy.
-When creating the alert use this webhook :https://3commas.io/trade_signal/trading_view
-In the message field you use {{strategy.order.alert_message}} as the placeholder.
In the future this signal might make it to the 3commas marketplace. You can then subscribe to that signal where I have cherrypicked coins based on thorough backtesting and optimization.

Bitcoin Scalping Strategy (Sampled with: PMARP+MADRID MA RIBBON)
DISCLAIMER:
THE CONTENT WITHIN THIS STRATEGY IS CREATED FROM TWO INDICATORS CREATED BY TWO PINESCRIPTER'S. THE STRATEGY WAS EXECUTED BY MYSELF AND REVERSE-ENGINEERED TO MEET THE CONDITIONS OF THE INTENDED STRATEGY REQUESTOR. I DO NOT TAKE CREDIT FOR THE CONTENT WITHIN THE ESTABLISHED LINES MADE CLEAR BY MYSELF.
The Sampled Scripts and creators:
PMAR/PMARP by @The_Caretaker Link to original script:
Madrid MA RIBBON BAR by @Madrid Link to original script:
Cheat Code's strategy notes:
This sampled strategy (Requested by @elemy_eth) is one combining previously created studies. I reverse-engineered the local scope for the Madrid moving average color plots and set entry and exit conditions for certain criteria met. This strategy is meant to deliver an extremely high hit rate on a daily time frame. This is made possible because of the very low take profit percentage, during the context of a macro downtrend it is made easier to hit 1-3% scalps which is made visible with the strategy using sampled scripts I created here.
How it works:
Entry Conditions:
-Enter Long's if the lime color conditions are met true using the script detailed by Marid's MA
- No re-entry into positions needs to be met true (this prevents pyramiding of orders due to conditions being met true) applicable to both long and short side entries.
- To increase hit rate and prevent traps both the parameters of rsi being sub 80 and no previously engulfing candles need to be met true to enter a long position.
- Enter Short's if the red color conditions of Madrid's moving average are met true.
- Closing Long positions are typically not met within this indicator, however, it still sometimes triggers if necessary. This consists of a pmarp sub 99 and a position size greater than 0.0
- Closing Short positions are typically not met within this indicator, however, it still sometimes triggers if necessary. This consists of a pmarp over 01 and a position size less than 0.0
- Stop Loss: 27.75% Take Profit: 1% (Which does not trigger on ticks over 1% so you will see average trade profits greater than 1%)
BYBIT:BTCUSDT BINANCE:BTCUSDT COINBASE:BTCUSD
Best Of Luck :)
-CheatCode1

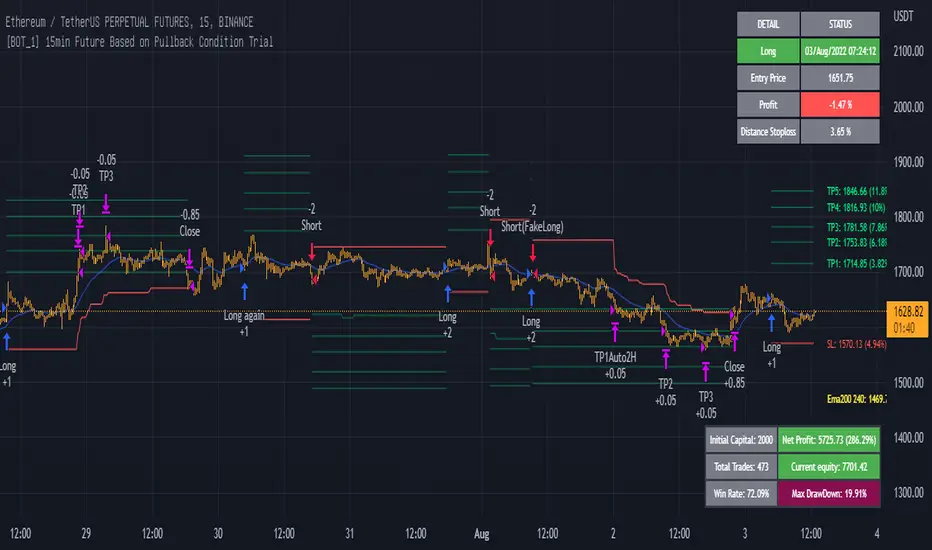
LudovicaLudovica is a trend following strategy that works on intraday timeframes (15 minutes).
The stop loss is decided based on the last price movement, take profits are projected through a Fibonacci extension. Two different extensions are calculated, based on a filter that affects the last price movement it is chosen which one to use for take profits.
Money management is fixed fractional: regardless of the distance between entry point and stop loss, the risk on capital for each trade is decided by the user in the strategy inputs. Take profits from 1 to 4 plan to exit with 15% of the initial size, TPs from 5 to 8 plan to exit with 10% of initial size.
There is a trailing stop system to reduce the drawdown of the strategy (note that stop loss moves as the trade develops).
Take profits are limit orders, stops (loss or trailing) occur at candlestick close (set alerts on the strategy).
Optimized strategies selectable from input panel:
-ETHUSDTPERP 15 min
-CRVUSDTPERP 15 min v1
-CRVUSDTPERP 15 min v2
-SNXUSDTPERP 15 min
Other pairs in development and soon available.
This strategy is in beta stage.

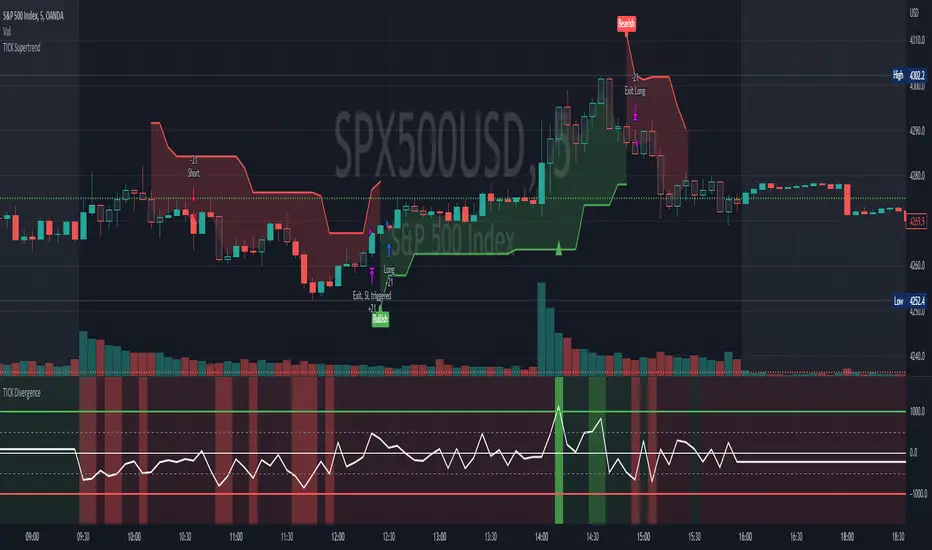
[Pt] TICK Supertrend Strategy, 5 minBackground:
It is well known that the indices such as SPY and QQQ follow/represent market sentiment. The TICK index literally represents the market sentiment as it compares the number of stocks that are rising and falling on the NYSE. By default, the TICK index is a short term indicator. Therefore it isn't reliable for swing trading or long term strategies. However, it is perfect for scalping.
Although TICK is well known, many does not know how to use it effectively. As part of the background mechanism of this script, I’ve divided TICK into 5 major zones based on the close of each candle: Overbought (neutral with bearish bias), Bullish, Neutral, Bearish, and Oversold (neutral with bullish bias). Along with the use of Heikin Ashi technique, RSI, moving averages and candle analysis, this strategy aims to provide accurate representation of market sentiment and profitable entry and exit points. *** At the time of publication, this strategy has proved to be consistently profitable. HOWEVER, this DOES NOT guarantee future profitability. So use at your own risk! ***
What is it showing?
This strategy is an intraday scalping strategy that uses TICK data to predict market directions for optimal entry and exit points. It is displayed similarly to the famous Supertrend indicator, which is one of the most common ATR based trailing stop indicators, so visually it is easy to read. This strategy is suitable for trading indices such as SPX , SPY , SPX500USD , QQQ , DJI and any other tickers that have high positive correlation with TICK.
Script is proprietary, but as mentioned it incorporates the following elements with additional candlestick analysis, pattern recognition, stop-loss and profit taking strategy:
- NYSE TICK data
- Heikin Ashi candle technique
- ATR
- RSI
- Moving Averages
Bullish trend is determined by a confluence of said indicators and analyses, and is displayed as a green line under the price action. The distance is defined by an adjustable value that is based on a percentage of the previous daily ATR value. When a long order is in play, that line also acts as the stop-loss level. Bearish trend is the opposite and is displayed in red, by default.
What's unique?
Detecting a ranging market structure and avoiding overtrading in a choppy market has always proven to be difficult, even for the most professional traders. This strategy has built-in “choppiness” and volatility filtering scripts that attempts to help reduce the number of false entries. These elements are what makes this strategy unique and different from other indictors mashup strategies.
In addition, this strategy takes previous trades into account and “learn” from past trades when determining the optimal stop-loss level to maximize profitability. This allows this strategy to better adapts to changing and evolving market conditions.
Strategy statistics
All parameters are designed for 5min time frame.
At the time of publication, this strategy has proved to be consistently profitable through limited back testing data.
Initial capital = $10000
Pyramiding = 1
Slippage = 3 ticks to account for spread
Default leverage shown = 9x
Quantity per trade = 100% of account
Back testing period at time of publication = Apr 11, 2022 - July 22, 2022
Trading Session = 1000 - 1530 Mon-Fri
Timeframe = 5 min
Gain = 1338.48%
Total trades = 253
% Profitable = 45.85%
Profit Factor = 2.506
Max Drawdown = 19.36%
Extras
This release includes default AutoView alerts for trading SPX500USD on Oanda. It includes both long and short order entry alerts, and trailing stop-loss alerts.
Please DM for free trial.
3C QFL Mean reversalWhat is QFL trading strategy?
QFL stands for Quickfingersluc, and sometimes it is referred to as the Base Strategy or Mean Reversals. Its main idea is about identifying the moment of panic selling and buying below the base level and utilizing Safety orders.
What is Base level or Support Level?
Base level or Support Level refers to the lowest price level that was reached before the moment the price started increasing again. At that level, you can notice that buyers of some cryptocurrencies make a strong reaction.
In this strategy we can also reverse the strategy and go short. But i must warn you that that is alot riskier.
QFL is meant to be used on higher TF's like 1hr, 2hr and 4hr. But this strategy also work well on lower Timeframes.
The script also simulates DCA strategy with parameters used in 3commas DCA bots for futures trading.
Experiment with parameters to find your trading setup.
Beware how large your total leveraged position is and how far can market go before you get liquidated!
Do that with the help of futures liquidation calculators you can find online!
Included:
An internal average price and profit calculating, instead of TV`s native one, which is subject to severe slippage.
A graphic interface, so levels are clearly visible and back-test analyzing made easier.
Long & Short direction of the strategy.
Table display a summary of past trades
Vertical colored lines appear when the new maximum deviation from the original price has
been reached
All the trading happens with total account capital, and all order sizes inputs are expressed in percent.

3C Crossover with TTP & TSLThis is not a set and forget strategy. It needs constant tweaking to maintain a high winrate. Also what works on one pair can be horrible on another.
This strategy works best on the 1 min or 5 min TF but also works well on the 15 min. Haven't done any testing in higher TF's as im only interested in scalping.
If enabled you can retrive data for the filters on any TF.
The strategy do not repaint.
You do not need a 3c subscription to run this strategy as the bot turns on and off the bot itself.
Instructions for the 3commas connector:
1. First, you need to prepare 3commas Long/Short bots that will only listen to custom TV signals.
2. Inputs for the 3commas bot can be found at the end of the user inputs.
3. Once you have entered the required details into the inputs, turn on 3commas comments. They should appear on the chart (looks messy).
4. Now you can add the alert where you should paste the 3commas Webhook URL: 3commas.io
5. For the alert message text insert the placeholder {{strategy.order.comment}} and delete the rest. 6. Once the alert is saved, you can turn off those 3commas comments to have a clearer chart.
7. With a new alert, the bot and trade should launch.
Long or Short trades are determined with a crossing of the fast MA over the slow MA for Long and the opposite for Short. By checking Close position on MA cross the deal will close on a crossover/under of the 2 MA's
You can select from various different MA's and of course lenghts. You can add both EMA filter on any lenght aswell as ATR to determine to go long or short.
Using the MA gap can help you to not enter trades in a low volatile ranging market.
The RSI filter, sets the maximum RSI threshold for a long position and the minimum for a short. By default and what i recomend is that you enter Longs when RSI is above 50 and shorts when RSI are below 50.
-You can set confirmation of the trade direction with RSI , i.e. for Long the RSI must rise a specified number of bars back, vice versa for Short.
Enabling the pullback filter is great to avoid Longing tops and Shorting bottoms.
Stop loss can be set be either a fixed percentage or by using ATR
Take profit can be set by using percentage, ATR or RiskReward ratio(RR). if you use ATR as a stoploss i recomend using RR as the TP.
Yu can choose to trail the TP with either Percentage or ATR
Whats ahead. I really want to incorporate RSI divergencies, but haven't figured out how yet. Any other ideas would be greatly appreciated.
Have a look at my other strategies. They are similar to this but works abit differently.

3C MACD & RSI Scalper no repaintThis is not a set and forget strategy. It needs constant tweaking to maintain a high winrate. Also what works on one pair can be horrible on another.
This strategy works best on the 1 min or 5 min TF but also works well on the 15 min. Haven't done any testing in higher TF's as im only interested in scalping.
If enabled you can retrive data on the MACD and RSI from any timeframe.
The strategy do not repaint.
You can filter on sessions as well as days. Often trading during say only the EU times and not trading during weekends yields better results. This is because weekeds and eg. the Asia Sessions are alot less volatile.
You do not need a 3c subscription to run this strategy as the bot turns on and off the bot itself.
Instructions for the 3commas connector:
1. First, you need to prepare 3commas Long/Short bots that will only listen to custom TV signals.
2. Inputs for the 3commas bot can be found at the end of the user inputs.
3. Once you have entered the required details into the inputs, turn on 3commas comments. They should appear on the chart (looks messy).
4. Now you can add the alert where you should paste the 3commas Webhook URL: 3commas.io
5. For the alert message text insert the placeholder {{strategy.order.comment}} and delete the rest. 6. Once the alert is saved, you can turn off those 3commas comments to have a clearer chart.
7. With a new alert, the bot and trade should launch.
Long or Short trades are determined with a crossing of the fast MA over the slow MA for Long and the opposite for Short. Trades should only happen close to the crossovers.
You can select from various different MA's and of course lenghts. I often find that using HEMA as the fast MA and DEMA as the slow give more trades while also maintaining a high winrate.
Then for Long we use the MACD indicator where we look for high peaks in negative values for Long and vice versa for Shorts. These should be significantly higher than other peaks (or if you will lower peaks for a Long).
The key is to detect high peaks on the histogram, which we will try to achieve by checking if the last 2 values were higher than X bars back. If you want to make it even more specific, then you can turn on the additional checkbox which compares the current value to the average value of X bars back, and if it is greater than, say, 72% the value of the average then it's ok to enter the trade.
The RSI filter, sets the maximum RSI threshold for a long position and the minimum for a short. By default and what i recomend is that you enter Longs when RSI is above 50 and shorts when RSI are below 50.
-You can set confirmation of the trade direction with RSI, i.e. for Long the RSI must rise a specified number of bars back, vice versa for Short.
Enabling the pullback filter is great to avoid Longing tops and Shorting bottoms.
Whats ahead. I really want to incorporate RSI divergencies, but haven't figured out how yet. Any other ideas would be greatly appreciated.
Have a look at my other strategies. They are similar to this but works abit differently.
The 3 strike line and the engulfing candles are not something that has an impact on the script yet, and might never be. But i do like to turn them on for a visual to see if the trade the strategy opened is a good one.

The Ultimate Backtest - Fontiramisu█ OVERVIEW
The Ultimate Backtest allows you to create an infinite number of trading strategies and backtest them easily and quickly.
You can leverage the trading setup you created with the tradingview's real-time alert system.
The tool is constantly being improved to accommodate more in-house indicators in order to imagine more trading strategies.
█ HOW IT WORKS.
The tool is divided into 3 main parts:
1. The indicators:
These are the indicators that you will be able to set up to create your setups.
Example: rsi, exponential moving average, home made resistance/support indicator etc.
We are working to add more and more in-house indicators to multiply the trading strategies.
2. The entry/exit strategy:
The entry/exit trades management is a central point of the strategy.
Here we propose several ways to take profits and in-house optimizations to enter a position.
3. The setup: the combination of indicators
Here it is up to you to create your own recipe.
You combine the different indicators set up above to make a real strategy.
Example: RSI Divergence + Location on a support.
Let's look at this in more detail.
Below is a description of all sections
█ 1. THE INDICATORS
TREND: MA (moving average) -->
Set up a moving average from multiple methods (sma, ema, smma...) of the type and length you want.
> A long is taken if the price is above the MA.
> A short is taken if the price comes below the MA.
You can set up a smoothing MA from the existing moving average and use it in the same way.
ENVELOPE: SUPER TREND -->
The supertrend is a trend following indicator. It clearly describes the distinction between downtrends and uptrends with a red or green direction. It is calculated according to the ATR and a factor.
> A long is taken when the direction is green and the price touches the supertrend support line.
> A short is taken when the direction is red and the price touches the supertrend resistance line.
ENVELOPE: BOLLINGER BAND -->
Bollinger bands are used to evaluate the volatility and probable evolution of prices, here we exploit the envelope
> A long is taken if the price crosses the lower band.
> A short is taken if the price crosses the upper band.
CLOUD: ICHIMOKU -->
The Ichimoku cloud aims to identify the direction and reversal points of dominant market trends. It displays support and resistance levels.
> A long is taken when the price enters the green ichimoku cloud.
> A short is taken when the price enters the red ichimoku cloud.
MOMENTUM: MACD ZERO LAG / MACD / RSI -->
RSI (Relative Strength Index) reflects the relative strength of upward movements, compared to downward movements.
MACD (Moving Average Convergence Divergence) is a momentum indicator that follows the trend and shows the correlation between two moving averages of the asset price.
MACD ZERO LAG is calculated in the same way except that the exponential moving averages that make up the calculation do not lag.
> A long is taken on a potential bullish divergence.
> A short is taken on a potential bearish divergence.
For now, with these indicators, we only take a trade based on divergences but we will add overbuy/oversell etc.
MOMENTUM: MA SLOPE -->
This house indicator allows you to use the slope of a moving average as a measure of momentum.
Define the length of the moving average whose slope we will take.
We then take a fast ma of the slope then a slow ma (You define the lengths with the parameters)
The tool foresees a subtraction between the slow and fast ma to have another interpretation of the slope.
This indicator is available and can be viewed freely on my tradingview profile.
> A long is taken when there is a potential bullish divergence on the fast/slow MA or the difference.
> A short is taken when there is a potential bear divergence on the fast/slow MA or the difference.
RESISTANCE: R/S FONTIRAMISU -->
An in-house indicator that shows resistances and supports according to the chosen parameters.
Indicator available and can be viewed freely on my tradingview profile.
> A long is taken when the price arrives on a support.
> A short is taken when the price arrives on a resistance.
-----
MOMENTUM DIVERGENCE -->
Section used to set the divergence detection.
The first field allows you to select which momentum you want to calculate the divergence on.
PIVOT DETECTION -->
Used to calculate top and dip on the chart, it is used with divergences/resistances/enter-exit optimizations....
Default parameters are: Deviation: 2.5, Depth: 10.
█ 2. STRATEGY FOR ENTERING/EXITING TRADES.
STRATEGY: TP/SL -->
Enter/Exit Trade Mode" field: The first field allows you to choose between two modes:
1. TP/SL Mode:
This mode allows you to take entries with take profits that you define afterwards with the TP1 and TP2 parameters .
> The stop loss is calculated automatically by taking the last dip if it is a long and the last top if it is a short.
> You can add a "Stop Loss % Offset" which will increase the size of the stop loss by the % value you set.
> If you activate TP2, the profit taking is split between TP1 and TP2, you can select the percentage of profit taking split between TP1 and TP2 via the "Percent Exit Profit TP1" field.
> The "TPX Multiplier" fields allow you to define the desired Risk Reward, if = 1 then RR = 1/1.
> A Trailing stop option is available, if active then the profit take will be split between TP1 and Trailing stop.
For the moment you can choose between the two MA's set up above to serve as trailing stop:
> In long, if the price goes below the MA then you take the profit (or the loss)
> In short, if the price goes above the MA then you take the profit (or the loss)
2. ONLY BUY/SELL:
Here the take profits are not taken into account, we only have an alternation between the long and the shorts.
The trailing stop applies to this mode and can be interesting depending on the use.
STRATEGY: SETUP OPTIMIZER (FP) -->
Here we have 3 home made optimization tools to take more relevant trades.
1. FAVORABLE ENTRY FROM PIVOT.
Here the tool will favor entries with interesting locations depending on dips and tops before.
A red cross with "FP" will appear on the chart each time a trade does not meet this condition.
2.STOP LOSS MAX (SL).
Will only take trades where the stop loss is maximum at X%.
A red cross with "%SL" will appear on the chart each time a trade does not meet this condition.
3. MOVE ALREADY TRADED.
Will not take several trades in the same move.
This can avoid cascading losing trades on some setups.
A red cross with "MT" will appear on the chart each time a trade does not meet this condition.
█ 3. THE SETUP: THE COMBINATION OF INDICATORS
Here, let your creativity speak.
You are free to assemble the indicators in the following way:
The conditions defined inside a group (group1/group2/group3) are combined to each other via an OR operator .
Example, if "cond01 = Momentum DIv" and "cond02 = Res/Sup Location", then trades will be triggered if one of the two conditions is met.
The conditions defined between several groups are multiplied via the AND operator .
Example, if "cond01 = Momentum DIv" and "cond12 = Res/Sup Location", then trades are taken if both conditions are met at the same time.
ALL CONDITIONS:
> NONE
No conditions selected.
> Momentum Div
Triggers when a potential divergence occurs on the selected momentum (in the divergence section).
> Momentum Div UT Sup
Triggers when a potential divergence occurs on the selected momentum (in the divergence section) in the upper timeframe.
The upper timeframe of the momentum is calculated directly in the code by multiplying the set parameters by 4 (fastlenght/slowlenght...).
> Multi MA
It is set in the "Trend: MA" section and is triggered by the conditions mentioned in the "INDICATORS" section.
> Smooting MA
Is set in the "Trend: MA" section and is triggered by the conditions mentioned in the "INDICATORS" section.
> Super Trend Env
Is set in the "ENVELOPE: SUPER TREND" section and is triggered by the conditions mentioned in the "INDICATORS" section.
> BB Env
It is set in the "ENVELOPE: BOLLINGER BAND" section and is triggered by the conditions mentioned in the "INDICATORS" section.
> Ichimoku Cloud
Is set in the "CLOUD: ICHIMOKU" section and is triggered by the conditions mentioned in the "INDICATORS" section.
> Res/Sup Location
Is set in the "RESISTANCE: R/S" section and is triggered by the conditions mentioned in the "INDICATORS" section.

[Pt] Premarket Breakout StrategyThis is a 1 trade per day strategy for trading SPY or QQQ index. By default, this is designed for 1 min time frame. This was an experimental script that seems to be profitable at the time of publication.
How it works:
Pre-market high and low is defined per trading day between 9:00 to 9:30 EST.
Then we looking for the first breakout on either PM high or PM low.
- Breakout high = long trade
- Breakout low = short trade
If long trade, we wait until Stochastic RSI D signal line to hit a lower threshold (18 by default). Then we enter long when K crosses above D line.
If short trade, we wait until Stochastic RSI D signal line to hit an upper threshold (82 by default). Then we enter short when K crosses below D line.
Stop loss for long
- set to PM low if entry is above PM high + %ATR buffer
- or set to PM range + %ATR buffer
Stop loss for short
- set to PM high if entry is below PM low + %ATR buffer
- or set to PM range + %ATR buffer
Profit target is set to 2x the risk by default.
*Note: Different Stochastic RSI lengths should be used if trading 5 min time frame. See tooltip.
Happy trading~~!

Crypto_Troll_Turtle_StrategyTurtle Strategy for high marketcap cryptocurrencies
I'm glad to launch my strategy which is based on
moving averages / bollinger bands / RSI and volume
It's basically made for scalping with an interesting return over the last two years and a perspectively low drawdown
if you're interested in the strategy and you want to use it for futures trading you can contact me for a money & risk management rules that you can use and prevent you from a huge loss !! it's for free don't worry xD you can find my contact in the author's instructions' label
The optimal timeframe to use is 1H
I'll be trying to launch telegram signals for this strategy as soon as possible for the following pairs: BTCUSDT ETHUSDT BNBUSDT timeframe: 1H
I'm open to all reviews ! thanks !

Breakout Finder Strategy by The Accumulation ZoneThe Breakout Strategy:
Indicators used:
Least Squared Moving Average by Tradingview
Smoothed Moving Average by Tradingview
MACD Support Resistance by venkatachari_n
About this Strategy:
This strategy is based on spotting a particular activity pattern involving the above listed indicators:
A fast moving average that will track closely with price while still smoothing out some price chop
A slower least squared moving average to help gauge short-term momentum
MACD Support and Resistance to help identify longer-term trends and potentially serve to also guide directional bias
If all entry conditions are met, the strategy enters a position. As well as sending an alert message for the Entry, TP/SL Signals
Long Condition:
Price close above MACD S/R Line
SMMA crossed MACD S/R Line to the upside
LSMA crossed MACD S/R Line to the upside
Short Condition:
Price close below MACD S/R Line
SMMA crossed MACD S/R Line to the downside
LSMA crossed MACD S/R Line to the downside
Strategy Settings
SL based on ATR Bands (0.9 ATR Multiplier recommended*)
TP based on RR (1.5 RR recommended*)
Optional EMA Filter (If set to 0 -> disabled)
Session Filter
Custom Strategy Backtesting Dashboard (Risk = 5%*)
*Recommended for a Daily BTC/USDT Chart

Customizable Non-Repainting HTF MACD MFI Scalper Bot StrategyThis script was originally shared by Wunderbit as a free open source script for the community to work with.
WHAT THIS SCRIPT DOES:
It is intended for use on an algorithmic bot trading platform but can be used for scalping and manual trading.
This strategy is based on the trend-following momentum indicator . It includes the Money Flow index as an additional point for entry.
HOW IT DOES IT:
It uses a combination of MACD and MFI indicators to create entry signals. Parameters for each indicator have been surfaced for user configurability.
Take profits are fixed, but stop loss uses ATR configuration to minimize losses and close profitably.
HOW IS MY VERSION ORIGINAL:
I started trying to deploy this script myself in my algorithmic trading but ran into some issues which I have tried to address in this version.
Delayed Signals : The script has been refactored to use a time frame drop down. The higher time frame can be run on a faster chart (recommended on one minute chart for fastest signal confirmation and relay to algotrading platform.)
Repainting Issues : All indicators have been recoded to use the security function that checks to see if the current calculation is in realtime, if it is, then it uses the previous bar for calculation. If you are still experiencing repainting issues based on intended (or non intended use), please provide a report with screenshot and explanation so I can try to address.
Filtering : I have added to additional filters an ABOVE EMA Filter and a BELOW RSI Filter (both can be turned on and off)
Customizable Long and Close Messages : This allows someone to use the script for algorithmic trading without having to alter code. It also means you can use one indicator for all of your different alterts required for your bots.
HOW TO USE IT:
It is intended to be used in the 5-30 minute time frames, but you might be able to get a good configuration for higher time frames. I welcome feedback from other users on what they have found.
Find a pair with high volatility (example KUCOIN:ETH3LUSDT ) - I have found it works particularly well with 3L and 3S tokens for crypto. although it the limitation is that confrigurations I have found to work typically have low R/R ratio, but very high win rate and profit factor.
Ideally set one minute chart for bots, but you can use other charts for manual trading. The signal will be delayed by one bar but I have found configurations that still test well.
Select a time frame in configuration for your indicator calculations.
Select the strategy config for time frame. I like to use 5 and 15 minutes for scalping scenarios, but I am interested in hearing back from other community memebers.
Optimize your indicator without filters (trendFilter and RSI Filter)
Use the TrendFilter and RSI Filter to further refine your signals for entry. You will get less entries but you can increase your win ratio.
I will add screenshots and possibly a video provided that it passes community standards.
Limitations: this works rather well for short term, and does some good forward testing but back testing large data sets is a problem when switching from very small time frame to large time frame. For instance, finding a configuration that works on a one minute chart but then changing to a 1 hour chart means you lose some of your intra bar calclulations. There are some new features in pine script which might be able to address, this, but I have not had a chance to work on that issue.

Scalping Support Resistance StrategyScalping strategy for BTC using one line: Support Resistance.
The strategy draws a line based on the minimum value of the average of High, Low, and Close for a given bar. The entries are carried out on the breakdown of this line. Exits are managed by the specified in the script's inputs take-profit and stop-loss percentages.
From Stream:
www.tradingview.com

The Impossible TraderTHE IMPOSSIBLE TRADER
A simple, but effective High Freq Strategy script based on MACD or RSI trend, with extra customizable Alert Messages for Bots.
WHAT IT DOES
This script (works best at lower TimeFrames) just follow the trend of MACD or RSI on your asset.
Why it should work? Because in an upper trend, there are more chance of green candles than reds. And in dump trend there are more chance of red candles than greens.
While trend is positive, it will try to open Long orders as fast as possible at market price.
While trend is negative, it will try to open Short orders as fast as possible at market price.
HOW TO SETUP YOUR PREFERENCES
Capital : Insert a % of Margin you want to use for your positions (usually 30% is quite good)
Leverage : Choose leverage based on your plans
Trail Tick @ : This value (in Tick) tell the script "when" the "Trail Stop" order must be activated (from the Entry price)
Offset Tick @ : This is the price (in Tick) from the Trail Stop Price activated. Basically it is a Stop Loss that follow the price at a fixed distance.
SL Tick @ : Set a Stop Loss at amount Tick distance from the Entry Price. (Let's call it a Safety Stop Loss for bad decisions...)
TP Tick @ : Set a Take Profit at amount Tick distance from the Entry Price. Sometimes is better to exit in full Gain than keep positions.
Strategy : You can choose a Only Long, Only Short or Long+Short sametime strategy.
with MACD or RSI : You can try the strategy applied on MACD or applied on customizable RSI EMA
EMA : If you choosed RSI EMA, you can set any value for your testing (usually 80-120 works very nice)
Exit order after bars : Some Exchanges / Brokers apply fixed cost, and a strategy too fast could not be productive. This set will let you to delay the Exit Order on already Opened positions.
Keep Stop Loss active : If you are planning a delay for Exit Orders, sometime could be useful to keep activated Stop Loss.
Strategy Preset : Some preset I've found interesting, with good results.
BackTest Days : If there are too many results and script doesn't work, you can choose a closer range to show results.
EXTRA FEATURES
On Screen Display : OSD will show you some realtime stats about your strategy, like Asset Tick, Trading Period Range, Drawdown, Gains and not closed trade.
Alert Message : You can enter custom Long Entry/Exit and Short Entry/Exit message for your Bots (like AutoView, WunderBit, etc...). When alert is triggered, you can send custom message with {{strategy.order.comment}} in the text field
AutoView Alert Message : If you are user of AutoView, you can generate your calls. Those are tested only on Oanda with index like Sp500, US100, Us30.
TIPS ON USE
Some asset on TradingView require an higher initial capital. Go to this Script Settings -> Properties and rise Initial Capital.
Be aware of commissions and spread when evalutating a strategy. Go to this Script Settings -> Properties and set Commission and Slippage
Trail Stop and Ticks could be difficult to understand, but very profitable. Please take your time and study how it works.
Consider Tick like the minimum movement your asset can do. Ticks occurs "intra-bar", so some of your positions could be closed almost instantly.
Consider Trail Stop like a Stop Loss that keep always the same distance from your positions, but never came back . If you are in gain, say of 10 Ticks, and your Trail have 5 Ticks, this means for sure a close at minimum 5 Ticks from Entry Price.
On Screen Display will show you Ticks for your asset. This will help you on strategy settings, because not all asset responds on the same way.
ONLY LONG EXAMPLE
ONLY SHORT EXAMPLE

MY_SCALP strategyThe MY_SCALP strategy is designed to work with any instrument (cryptocurrency, stocks, forex).
The working timeframe for scalping is small from 1 to 15 minutes, and for trend trading from 30 minutes.
Signals are generated based on the price range (channel) within which the price of the instrument moves.
When the price of the channel breaks up, we expect an upward movement, and when it breaks down, we expect a downward movement.
To avoid manipulations in the market, the algorithm monitors the level of the price relative to the global trend and thus filters out a large part of the false signals.
In addition, in the settings it is possible to show additional inputs - these are the moments of rebound from the edge of the channel inwards, also with filtering applied.
-------------------------------------
💹 SETUP SETUP:
-------------------------------------
To adjust, you should change the value of the CHANNEL multiplier - this depends on the sensitivity and flexibility of the range.
For TF 5m it will be about 8-9, and for TF 1H about 4-5. That is, the higher the TF, the lower the value of the CHANNEL multiplier.
-------------------------------------
🟢 TAKE SETUP:
-------------------------------------
The strategy has 2 takes
You can choose the type of take - FIX or CHANNEL
FIX - fixed targets in %.
CHANNEL - channel takes (The width of the channel at the moment the signal appears is multiplied by the specified multiplier and thus the size of the take is calculated.).
Important: the 1st take cannot be more than the 2nd!
-------------------------------------
⛔️ STOP SETUP:
-------------------------------------
Stop type is also selectable:
FIX - fixed stop in %.
CHANNEL - channel stop (set % of the price for the offset from the opposite side of the trading channel. For additional entries, the stop uses the value of half the channel width + the specified offset from the position entry price).
You have the opportunity to activate the stop line tightening when the 1st tp1 take breakeven is reached.
-------------------------------------
💡 OTHER USEFUL FEATURES
-------------------------------------
✅ In the strategy, you can enable / disable the display of takes and stop lines.
✅ In the strategy, you can enable / disable the display of points of probable price rebounds.
✅ You can choose the direction of trading: long, short or any.
✅ You can choose the percentage of the position to close on the 1st take.
✅ It is possible to enable background highlighting of the current trend. This background does not stretch to the entire screen, but is limited to the calculated extremes, within which the asset price moves.
✅ The screen has a compact display of a table with the current strategy settings and the current state (position, takes, stop).
For the convenience of saving your settings, use the standard PrintScreen function.
✅ You can sign the strategy in the Notes field - this is convenient if you place several versions of the MY_SCALP strategy on the chart with different settings (for different pairs or for different timeframes).
✅ 👉 In the strategy settings, each field has hints , to do this, hover over the ⓘ sign
-------------------------------------
MY_SCALP strategy is closed! You can get test access to it for 48 hours.
👉 In order to gain access or ask questions, write to me in private messages or at the contacts indicated in my signature.
-------------------------------------
========================================================================================================
Стратегия MY_SCALP предназначена для работы с любым инструментом (криптовалюта, акции, форекс).
Рабочий таймфрейм для скальпинга - малый от 1 до 15 минут, а для трендовой торговли от 30 минут.
В основе формирования сигналов лежит ценовой рейндж (канал), внутри которого движется цена инструмента.
При пробитии ценой канала вверх, мы ожидаем восходящее движение, а при пробитии вниз - нисходящее.
Чтобы избежать манипуляций на рынке, алгоритм отслеживает уровень нахождения цены относительно глобального тренда и тем самым фильтрует немалую часть ложных сигналов.
Кроме этого в настройках есть возможность показать дополнительные входы - это моменты отскока от края канала внутрь, также с применением фильтрации.
-------------------------------------
💹 НАСТРОЙКА СЕТАПА:
-------------------------------------
Для настройки следует ищменять значение множителя канала CHANNEL - это этого зависит чувствительность и гибкость рейнджа.
Для ТФ 5м это будет примерно 8-9, а для ТФ 1Ч примерно 4-5. То есть, чем выше ТФ, тем ниже значение множителя CHANNEL.
-------------------------------------
🟢 НАСТРОЙКА ТЕЙКОВ:
-------------------------------------
Стратегия имеет 2 тейка
Тип тейка можно выбрать - FIX или CHANNEL
FIX - фиксированные тейки в %.
CHANNEL - канальные тейки (Ширина канала в момент появления сигнала умножается на заданный множитель и таким образом высчитывается размер тейка.).
Важно: 1-й тейк не может быть больше 2-го!
-------------------------------------
⛔️ НАСТРОЙКА СТОПА:
-------------------------------------
Тип стопа также выбирается:
FIX - фиксированный стоп в %.
CHANNEL - канальный стоп (задаётся % цены для отступа от противоположной стороны торгового канала. Для дополнительных входов стоп использует значение половины ширины канала + заданный отступ от цены входа в позицию).
У Вас есть возможность активировать подтяжку стоп-линии при достижении 1-го тейка tp1 в безубыток.
-------------------------------------
💡 ПРОЧИЕ ПОЛЕЗНЫЕ ФУНКЦИИ
-------------------------------------
✅ В стратегии можно включить/отключить отображение тейков и стоп-линии.
✅ В стратегии можно включить/отключить отображение точек вероятных отскоков цены.
✅ Можно выбрать направление торговли: лонг, шорт или любое.
✅ Можно выбрать процент позиции для закрытия на 1-м тейке.
✅ Есть возможность включения фоновой подкраски текущего тренда. Данный фон не растягивается на весь экран, а ограничивается расчётными экстремумами, в рамках которых двигается цена актива.
✅ На экране есть компактное отображение таблицы с текущими настройками стратегии и текущим состоянием (позиция, тейки, стоп).
Для удобства сохранения своих настроек - воспользуйтесь стандартной функцией PrintScreen.
✅ Вы можете подписать стратегию в поле Notes - это удобно, если Вы размещаете на графике несколько версий стратегии MY_SCALP с разными настройками (для разных пар или для разных ТФ).
✅ 👉 В настройках стратегии у каждого поля есть подсказки , для этого наведите курсор на знак ⓘ
-------------------------------------
Стратегия MY_SCALP является закрытой! Вы можете получить к ней тестовый доступ на 48 часов.
👉 Для того, чтобы получить доступ или задать вопросы пишите мне в личные сообщения или по контактам, указанным в моей подписи.
-------------------------------------

Bollinger Bands + EMA 9A 1 minute scalping strategy.
Uses Bollinger Bands (no basis line) and a 9 period EMA.
Waits for price to close below the lower Bollinger Band and the next candle to close bullish above the lower Bollinger Band but below the 9 Period EMA.
If all conditions are met, the script enters a long position with TP at the 9 Period EMA.

Scalp 1min CryptoThis scalping strategy is designed for 1min timeframe.
It uses indicators: SuperTrend 15m ( is used to filter the trade as to open only long position or short position), Wavetrend 1min, Bollinger Band 3min, Stoch 3min to find entry.
TP: optimized value : 0.5 - 1
Stoploss: You have two choice: % or when SuperTrend reverse
If you would like use scripts, please ib to me.
You are welcom!

15min ETH Binance Future Full for auto tradingThe strategy is optimized for ETHBUSDPERP or ETHUSDTPERP pairs on Binance Future. With other altcoins, you need change set up of indicators.
This is a swing strategy to follow the trend on the 15m frame, use the pullback condition in the smaller timeframe to enter the trade.
Entry long: price close above ema10 and ema30, macd(12,26,9) (tf1m) < macd(12,26,9) (tf1m) and rsi < 80 (not overbought) and parabol sar is below price
Exit long: price hit TP1, TP2, ... or touch stoploss or have entry short signal
Entry short: price close below ema10 and ema30, macd(12,26,9) (tf1m) > macd(12,26,9) (tf1m) and rsi > 20 (not oversold) and parabol sar is aboce price
Exit short: price hit TP1, TP2, ... or touch stoploss or have entry long signal
In addition, the strategy also has profit risk management feature: move stoploss to entry and take multiprofit, plot resistant in higher timeframe 1D, 4H for activing take profit.
If you find any helpful for your trading and need scripts, please inbox to me.
You are welcom!
Scalping The Bull - Two EMA StrategyName: Scalping The Bull - Two EMA "Gianno-Nano" Strategy from the Meeting
Category: Trend Follower
Operating mode: Spot or Future, only long or swing trading
Trades duration: Multiday
Timeframe: 4H
Suggested usage: Mid-term trading, when the market is in trend and it is showing high volatility.
Entry: When fast EMA crosses over slow EMA.
Exit: When fast EMA crosses under slow EMA then Exit Long or Entry Short (for reversal strategy).
Usage:
⁃ It can be useful to use alerts or web-hooks to automate this strategy.
⁃ This is a raw system that can be improved in different ways (e.g. Stop-loss, take-profit, position sizing) or studying more the behaviour of the coin.
Configuration:
- N/A
Backtesting
⁃ Exchange: BINANCE
⁃ Pair: NEOUSDT
⁃ Timeframe: 4H
⁃ Fee 0.075%
⁃ Slippage 0
- Start : 2017-12-03
How you or we can improve? Source code is open so share your ideas!

MACD Willy StrategyThis strategy is mainly developed for scalping / intraday trading. It could potentially be used to identify entry/exit signals for short term options trading. It performs decently well on popular stocks when used on time frames between 5 min to 15 min using regular session bar data. It combines 3 popular indicators, EMA, MACD, and William %range, to generate both long and short signals.
EMA:
Default is 200 EMA line.
MACD:
Default is 12/26 lengths for fast/slow signal inputs.
William %R - Smoothed (Published):
This is a custom indicator that generates two moving average lines from the original William %R line.
How it works:
Entry conditions:
1. Long/short entries when bar closes above/below EMA line
2. Long/short entries when MACD line is above/below signal line (histogram > 0 for long, < 0 for short)
3. Long/short entries when William %R fast MA line is above/below slow MA line
Exit conditions:
1. Exit long when MACD line is below signal line, vise versa for exit short
2. Exit long when William %R fast MA line is below slow MA line, vise versa for exit short
3. Exit long when William %R fast MA line must in below the overbought (-20) limit, exit short when above the oversold (-80) limit.
***Note that parameters are NOT optimized for any particular stocks / instruments.
Enjoy~~!!

TICK Scalping strategy, SPY 1 min1 min chart scalping version of my other TICK strategy with adjusted parameters and additional entry and exit conditions better suited for 1 min SPY chart. Please refer to my original TICK strategy for explanation.
Important notes:
1. This strategy is designed for same day SPY option scalping on the 1 min chart . All profit shown in back testing report is based on Profit/Loss (P/L) estimates from trading options with approximately 6 weeks of data. By default, it is set to 10 option contracts. By default the initial capital is set to $5000. Pyramiding is set to 3.
2. This strategy works better with non-extended market data .
3. This strategy is mainly developed for SPY trading on 1 min chart, it probably will not be very profitable with other tickers or time frame without tweaking all the parameters first.
Cheers and enjoy~! Let's all make money~!!
