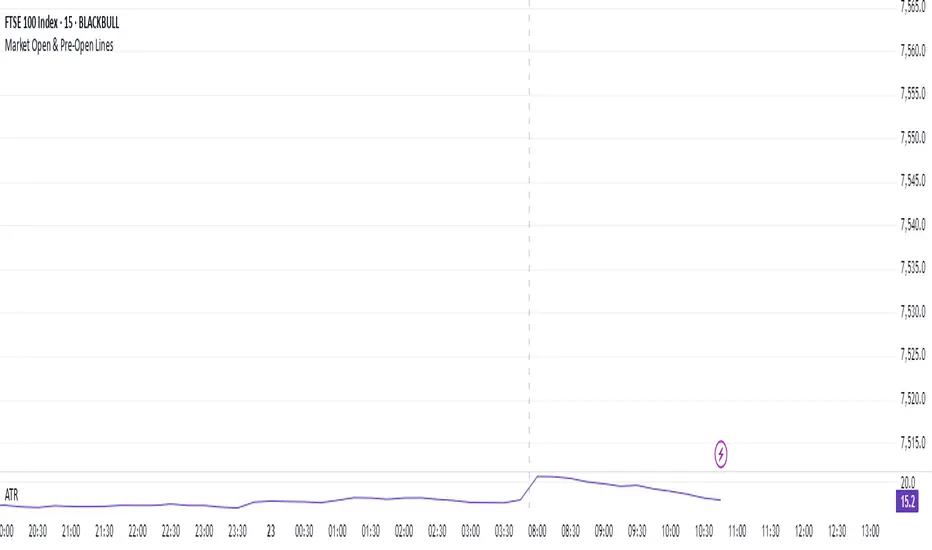
Market Open & Pre-Open Linesversion 1.0 2025-04-23
Stated vertical line for market open and pre-market open. Market option include US, EU, UK, JP and AU. This line do auto-defined during daylight saving time. This help for those trade during market open and benefit for those doing backtest on it.
Scalping
RSI-MACD Momentum Fusion Indicator(RMFI)📈 RSI-MACD Momentum Fusion Indicator (RMFI)
The RMFI combines the strengths of two RSI variants with a dynamically adaptive MACD module into a powerful momentum oscillator ranging from 0 to 100. The goal is to unify converging momentum information from different perspectives into a clear, weighted overall signal.
🔧 Core Features
RSI 1: Classic Wilder RSI, sensitive to short-term momentum.
RSI 2: Modified RSI based on normalized price movement ranges (Range Momentum).
MACD (3 Modes):
Standardized (min/max-based)
Fully adaptive (Z-score normalization)
50% adaptive (hybrid weighting of both approaches)
Dynamic MACD mode selection (optional): Automatic switching of MACD normalization based on volatility levels (ATR-based).
Signal Line: Smoothed average of all components to visualize momentum trends and crossovers.
🎯 Visualization
Clear separation of overbought (>70) and oversold (<30) zones with color highlighting.
Different colors based on the dynamic MACD mode – visually indicates how strongly the market adapts to volatility.
⚙️ Recommended Use
Ideal for trend following, divergence confirmation (with external divergence logic), and momentum reversals.
Particularly effective in volatile markets, as the MACD component adaptively responds to instability.
© champtrades
HTF Candle Overlay with Probability
Visualize Higher Timeframe Candles with Predictive Insights
This tool reconstructs higher-timeframe (HTF) candles using 1-minute bars and overlays them directly on your chart. It includes:
Wick + Body rendering for grouped HTF candles (e.g. 10m, 15m, etc.)
A dynamic label showing the probability of the current HTF candle closing bullish
Real-time updates and smart fading based on candle progress
Configurable colors for fills, outlines, and labels
🔧 Customizable Options:
Candle size (e.g. 10m, 15m)
Body fill and border color
Wick fill and border color
Label text/background color
Whether you're a scalper watching larger structure or a PA trader looking for confluence, this overlay gives you predictive insight where it matters: on the candle that's still forming.

Reversal Strength Meter – Adib NooraniThe Reversal Strength Meter is an oscillator designed to identify potential reversal zones based on supply and demand dynamics. It uses smoothed stochastic logic to reduce noise and highlight areas where momentum may be weakening, signaling possible market turning points.
🔹 Smooth, noise-reduced stochastic oscillator
🔹 Custom zones to highlight potential supply and demand imbalances
🔹 Non-repainting, compatible across all timeframes and assets
🔹 Visual-only tool — intended to support discretionary trading decisions
This oscillator assists scalpers and intraday traders in tracking subtle shifts in momentum, helping them identify when a market may be preparing to reverse — always keeping in mind that trading is based on probabilities, not certainties.
📘 How to Use the Indicator Efficiently
For Reversal Trading:
Buy Setup
– When the blue line dips below the 20 level, wait for it to re-enter above 20.
– Look for reversal candlestick patterns (e.g., bullish engulfing, hammer, or morning star).
– Enter above the pattern’s high, with a stop loss below its low.
Sell Setup
– When the blue line rises above the 80 level, wait for it to re-enter below 80.
– Look for bearish candlestick patterns (e.g., bearish engulfing, inverted hammer, or evening star).
– Enter below the pattern’s low, with a stop loss above its high.
🛡 Risk Management Guidelines
Risk only 0.5% of your capital per trade
Book 50% profits at a 1:1 risk-reward ratio
Trail the remaining 50% using price action or other supporting indicators

Reversal Scalping Ribbon - Adib NooraniThe Reversal Scalping Ribbon is a trend-following overlay tool designed to visually identify potential reversal zones based on price extremes and dynamic volatility bands. It calculates adaptive upper and lower bands using price action and custom ATR logic, helping traders quickly assess market direction and possible turning points
🔹 Volatility-adjusted bands based on price highs/lows
🔹 Color-coded ribbons to indicate trend bias and potential reversal shifts
🔹 No repainting, works on all timeframes and assets
🔹 Visual-only display, no trade signals — supports discretion-based entries
This ribbon is designed for scalpers and intraday traders to spot reversal setups with clarity. It enhances your trading by showing real-time market bias without unnecessary distractions. By focusing on probabilities, it helps to improve decision-making in fast-paced environments
How to use the indicator efficiently
For Reversal Trading:
Buy: When price closes below the green ribbon with a red candle, then re-enters with a green candle. Enter above the high of the green candle with a stop loss below the lowest low of the recent green/red candles
Sell: When price closes above the red ribbon with a green candle, then re-enters with a red candle. Enter below the low of the red candle with a stop loss above the highest high of the recent red/green candles
Risk Management:
Limit risk to 0.5% of your capital per trade
Take 50% profit at a 1:1 risk-reward ratio
For the remaining 50%, trail using the lower edge of the green band for buys and the upper edge of the red band for sells

ScalpSwing Pro SetupScript Overview
This script is a multi-tool setup designed for both scalping (1m–5m) and swing trading (1H–4H–Daily). It combines the power of trend-following , momentum , and mean-reversion tools:
What’s Included in the Script
1. EMA Indicators (20, 50, 200)
- EMA 20 (blue) : Short-term trend
- EMA 50 (orange) : Medium-term trend
- EMA 200 (red) : Long-term trend
- Use:
- EMA 20 crossing above 50 → bullish trend
- EMA 20 crossing below 50 → bearish trend
- Price above 200 EMA = uptrend bias
2. VWAP (Volume Weighted Average Price)
- Shows the average price weighted by volume
- Best used in intraday (1m to 15m timeframes)
- Use:
- Price bouncing from VWAP = reversion trade
- Price far from VWAP = likely pullback incoming
3. RSI (14) + Key Levels
- Shows momentum and overbought/oversold zones
- Levels:
- 70 = Overbought (potential sell)
- 30 = Oversold (potential buy)
- 50 = Trend confirmation
- Use:
- RSI 30–50 in uptrend = dip buying zone
- RSI 70–50 in downtrend = pullback selling zone
4. MACD Crossovers
- Standard MACD with histogram & cross alerts
- Shows trend momentum shifts
- Green triangle = Bullish MACD crossover
- Red triangle = Bearish MACD crossover
- Use:
- Confirm swing trades with MACD crossover
- Combine with RSI divergence
5. Buy & Sell Signal Logic
BUY SIGNAL triggers when:
- EMA 20 crosses above EMA 50
- RSI is between 50 and 70 (momentum bullish, not overbought)
SELL SIGNAL triggers when:
- EMA 20 crosses below EMA 50
- RSI is between 30 and 50 (bearish momentum, not oversold)
These signals appear as:
- BUY : Green label below the candle
- SELL : Red label above the candle
How to Trade with It
For Scalping (1m–5m) :
- Focus on EMA crosses near VWAP
- Confirm with RSI between 50–70 (buy) or 50–30 (sell)
- Use MACD triangle as added confluence
For Swing (1H–4H–Daily) :
- Look for EMA 20–50 cross + price above EMA 200
- Confirm trend with MACD and RSI
- Trade breakout or pullback depending on structure

Triple Confirmation Scalper v2 - Alarm CompatibleTriple Confirmation Scalper Strategy
A high-probability scalping strategy combining trend momentum, overbought/sold conditions, and volume confirmation to filter low-noise signals.
📊 Strategy Logic
Trend Direction
Dual EMA crossover (9 & 21 periods) for momentum and trend bias.
Overbought/Oversold Zones
RSI (14-period) to avoid entries at extremes.
Volume Spike Filter
OBV + 20-period volume average to confirm breakout validity.
Dynamic Risk Management
Stop-loss: Adaptive to recent price action (5-candle low/high ±1%).
Take-profit: 1.5% target (1.5:1 risk/reward).
🔍 Advanced Features
Precision VWAP (20-period, HLC3-based) for dynamic S/R levels.
Visual Aids:
EMA/VWAP bands + trend-colored background.
Volume spike alerts.
TradingView Alerts pre-configured for long/short signals.
⚙️ Default Settings
Commission: 0.1% factored into backtests.
Mode: Supports both long/short positions.
⚠️ Disclaimer
This is a technical analysis tool, not financial advice.
Past performance ≠ future results. Test thoroughly in a demo account.
Adjust parameters (e.g., EMA periods, RSI thresholds) to match your risk tolerance.
✅ TradingView Compliance Notes:
No exaggerated claims (e.g., "100% win rate").
Clear disclaimer included.
Focus on objective strategy logic (no promotional language).

Institutional Quantum Momentum Impulse [BullByte]## Overview
The Institutional Quantum Momentum Impulse (IQMI) is a sophisticated momentum oscillator designed to detect institutional-level trend strength, volatility conditions, and market regime shifts. It combines multiple advanced technical concepts, including:
- Quantum Momentum Engine (Hilbert Transform + MACD Divergence + Stochastic Energy)
- Fractal Volatility Scoring (GARCH + Keltner-based volatility)
- Dynamic Adaptive Bands (Self-adjusting thresholds based on efficiency)
- Market Phase Detection (Volume + Momentum alignment)
- Liquidity & Cumulative Delta Analysis
The indicator provides a Z-score normalized momentum reading, making it ideal for mean-reversion and trend-following strategies.
---
## Key Features
### 1. Quantum Momentum Core
- Combines Hilbert Transform, MACD divergence, and Stochastic Energy into a single composite momentum score.
- Normalized using a Z-score for statistical significance.
- Smoothed with EMA/WMA/HMA for cleaner signals.
### 2. Dynamic Adaptive Bands
- Upper/Lower bands adjust based on volatility and efficiency ratio .
- Acts as overbought/oversold zones when momentum reaches extremes.
### 3. Market Phase Detection
- Identifies bullish , bearish , or neutral phases using:
- Volume-Weighted MA alignment
- Fractal momentum extremes
### 4. Volatility & Liquidity Filters
- Fractal Volatility Score (0-100 scale) shows market instability.
- Liquidity Check ensures trades are taken in favorable spread conditions.
### 5. Dashboard & Visuals
- Real-time dashboard with key metrics:
- Momentum strength, volatility, efficiency, cumulative delta, and market regime.
- Gradient coloring for intuitive momentum visualization .
---
## Best Trade Setups
### 1. Trend-Following Entries
- Signal :
- QM crosses above zero + Market Phase = Bullish + ADX > 25
- Cumulative Delta rising (buying pressure)
- Confirmation :
- Efficiency > 0.5 (strong momentum quality)
- Liquidity = High (tight spreads)
### 2. Mean-Reversion Entries
- Signal :
- QM touches upper band + Volatility expanding
- Market Regime = Ranging (ADX < 25)
- Confirmation :
- Efficiency < 0.3 (weak momentum follow-through)
- Cumulative Delta divergence (price high but delta declining)
### 3. Breakout Confirmation
- Signal :
- QM holds above zero after a pullback
- Market Phase shifts to Bullish/Bearish
- Confirmation :
- Volatility rising (expansion phase)
- Liquidity remains high
---
## Recommended Timeframes
- Intraday (5M - 1H): Works well for scalping & swing trades.
- Swing Trading (4H - Daily): Best for trend-following setups.
- Position Trading (Weekly+): Useful for macro trend confirmation.
---
## Input Customization
- Resonance Factor (1.0 - 3.618 ): Adjusts MACD divergence sensitivity.
- Entropy Filter (0.382/0.50/0.618) : Controls stochastic damping.
- Smoothing Type (EMA/WMA/HMA) : Changes momentum responsiveness.
- Normalization Period : Adjusts Z-score lookback.
---
The IQMI is a professional-grade momentum indicator that combines institutional-level concepts into a single, easy-to-read oscillator. It works across all markets (stocks, forex, crypto) and is ideal for traders who want:
✅ Early trend detection
✅ Volatility-adjusted signals
✅ Institutional liquidity insights
✅ Clear dashboard for quick analysis
Try it on TradingView and enhance your trading edge! 🚀
Happy Trading!
- BullByte

Pro Scalper AI [BullByte]The Pro Scalper AI is a powerful, multi-faceted scalping indicator designed to assist active traders in identifying short-term trading opportunities with precision. By combining trend analysis, momentum indicators, dynamic weighting, and optional AI forecasting, this tool provides both immediate and latched trading signals based on confirmed (closed bar) data—helping to avoid repainting issues. Its flexible design includes customizable filters such as a higher timeframe trend filter, and adjustable settings for ADX, ATR, and Hull Moving Average (HMA), giving traders the ability to fine-tune the strategy to different markets and timeframes.
Key Features :
- Confirmed Data Processing :
Utilizes a helper function to lock in price and volume data only from confirmed (closed) bars, ensuring the reliability of signals without the risk of intrabar repainting.
- Trend Analysis :
Employs ADX and Directional Movement (DI) calculations along with a locally computed HMA to detect short-term trends. An optional higher timeframe trend filter can further refine the analysis.
- Flexible Momentum Modes :
Choose between three momentum calculation methods—Stochastic RSI, Fisher RSI, or Williams %R—to match your preferred style of analysis. This versatility allows you to optimize the indicator for different market conditions.
- Dynamic Weighting & Volatility Adjustments :
Adjusts the contribution of trend, momentum, volatility, and volume through dynamic weighting. This ensures that the indicator responds appropriately to varying market conditions by scaling its sensitivity with user-defined maximum factors.
- Optional AI Forecast :
For those who want an extra edge, the built-in AI forecasting module uses linear regression to predict future price moves and adjusts oscillator thresholds accordingly. This feature can be toggled on or off, with smoothing options available for more stable output.
- Latching Mode for Signal Persistenc e:
The script features a latching mechanism that holds signals until a clear reversal is detected, preventing whipsaws and providing more reliable trade entries and exits.
- Comprehensive Visualizations & Dashboard :
- Composite Oscillator & Dynamic Thresholds : The oscillator is plotted with dynamic upper and lower thresholds, and the area between them is filled with a color that reflects the active trading signal (e.g., Strong Buy, Early Sell).
- Signal Markers : Both immediate (non-latching) and stored (latched) signals are marked on the chart with distinct shapes (circles, crosses, triangles, and diamonds) to differentiate between signal types.
- Real-Time Dashboard : A customizable dashboard table displays key metrics including ADX, oscillator value, chosen momentum mode, HMA trend, higher timeframe trend, volume factor, AI bias (if enabled), and more, allowing traders to quickly assess market conditions at a glance.
How to Use :
1. S ignal Interpretation :
- Immediate Signals : For traders who prefer quick entries, the indicator displays immediate signals such as “Strong Buy” or “Early Sell” based on the current market snapshot.
- Latched Signals : When latching is enabled, the indicator holds a signal state until a clear reversal is confirmed, offering sustained trade setups.
2. Trend Confirmation :
- Use the HMA trend indicator and the optional higher timeframe trend filter to confirm the prevailing market direction before acting on signals.
3. Dynamic Thresholds & AI Forecasting :
- Monitor the dynamically adjusted oscillator thresholds and, if enabled, the AI bias to gauge potential shifts in market momentum.
4. Risk Management :
- Combine these signals with additional analysis and sound risk management practices to determine optimal entry and exit points for scalping trades.
Disclaimer :
This script is provided for educational and informational purposes only and does not constitute financial advice. Trading involves risk, and past performance is not indicative of future results. Always perform your own analysis and use proper risk management strategies before trading.

Money Flow Oscillator [BullByte]
Overview :
The Money Flow Oscillator is a versatile technical analysis tool designed to provide traders with insights into market momentum through the Money Flow Index (MFI). By integrating trend logic, dynamic support/resistance levels, multi-timeframe analysis, and additional indicators like ADX and Choppiness, this script delivers a detailed view of market conditions and signal strength—all while adhering to TradingView’s publication guidelines.
Key Features :
Money Flow Analysis :
Uses the MFI to assess buying and selling pressure, helping traders gauge market momentum.
Trend Switch Logic :
Employs ATR-based calculations to determine trend direction. The background color adjusts dynamically to signal bullish or bearish conditions, and a prominent center line changes color to reflect the prevailing trend.
Dynamic Support/Resistance :
Calculates oscillator support and resistance over a pivot lookback period. These levels help you identify potential breakouts or reversals as the MFI moves above or below prior levels.
Signal Metrics & Classifications :
Combines MFI values with additional metrics to classify signals into categories such as “Strong Bullish,” “Bullish,” “Bearish,” or “Strong Bearish.” An accompanying note provides details on momentum entry and overall signal strength.
Multi-Timeframe Order Flow Confirmatio n:
Analyzes the MFI on a higher timeframe to confirm order flow. This extra layer of analysis helps verify the short-term signals generated on your primary chart.
Volume and ADX Integration :
Incorporates volume analysis and a manual ADX calculation to further validate signal strength and trend stability. A dashboard displays these metrics for quick reference.
Choppiness Indicator :
Includes a choppiness index to determine if the market is trending or choppy. When the market is identified as choppy, the script advises caution by adjusting the overall signal note.
Comprehensive Dashboard :
A built-in dashboard presents key metrics—including ADX, MFI, order flow, volume score, and support/resistance details—allowing you to quickly assess market conditions at a glance.
How to Use :
Trend Identification : Monitor the dynamic background and center line colors to recognize bullish or bearish market conditions.
Signal Confirmation : Use the oscillator support/resistance levels along with the signal classifications and dashboard data to make informed entry or exit decisions.
Multi-Timeframe Analysis : Validate short-term signals with the higher timeframe MFI order flow confirmation.
Risk Management : Always combine these insights with your own risk management strategy and further analysis.
Disclaimer :
This indicator is provided for educational and informational purposes only. It does not constitute financial advice. Always perform your own analysis and use proper risk management before making any trading decisions. Past performance is not indicative of future results.

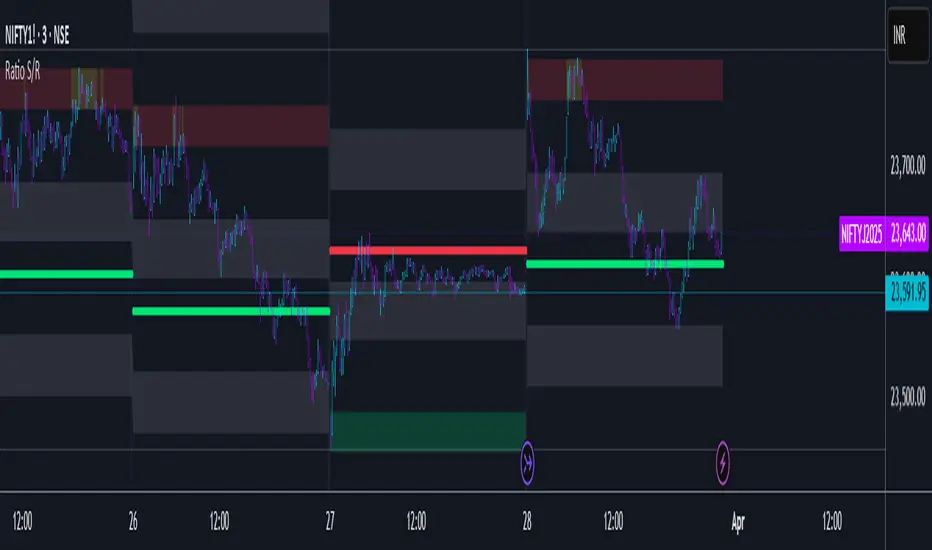
Ratio S/RRatio S/R - Intraday Support & Resistance Levels
Introduction
This script identifies key intraday support and resistance (S/R) levels where price tends to reverse frequently. It is designed specifically for intraday trading and aims to help traders find high-probability reversal zones.
The logic behind the script revolves around logarithmic returns, historical volatility, and ratio-based price levels. The script dynamically calculates price ranges using standard deviation-based volatility and applies preset ratio levels to determine potential support and resistance zones.
How It Works
Dynamic Range Calculation
The script calculates the price range based on the previous day’s logarithmic return volatility.
The range is then used to project different levels of price movement.
Reference Price
You can choose whether the reference price is from today’s open or yesterday’s close (oporcl setting).
This helps adapt the levels based on market behavior.
Ratio-Based Levels
The script applies specific ratios to the calculated range:
0.0833 (Minor Reversal Zone)
0.25 & 0.38 (Primary Reversal Zones)
0.62 & 0.75 (Significant Reversal Zones)
1.0 & 1.25 (Extreme Reversal Zones)
These levels act as potential support and resistance points.
Disclaimer: This is just for educational purpose . Trading is risky activity and how you use this tool is your own responsibility. The publisher of this tool does not make any claims.
Fuzzy SMA Trend Analyzer (experimental)[FibonacciFlux]Fuzzy SMA Trend Analyzer (Normalized): Advanced Market Trend Detection Using Fuzzy Logic Theory
Elevate your technical analysis with institutional-grade fuzzy logic implementation
Research Genesis & Conceptual Framework
This indicator represents the culmination of extensive research into applying fuzzy logic theory to financial markets. While traditional technical indicators often produce binary outcomes, market conditions exist on a continuous spectrum. The Fuzzy SMA Trend Analyzer addresses this limitation by implementing a sophisticated fuzzy logic system that captures the nuanced, multi-dimensional nature of market trends.
Core Fuzzy Logic Principles
At the heart of this indicator lies fuzzy logic theory - a mathematical framework designed to handle imprecision and uncertainty:
// Improved fuzzy_triangle function with guard clauses for NA and invalid parameters.
fuzzy_triangle(val, left, center, right) =>
if na(val) or na(left) or na(center) or na(right) or left > center or center > right // Guard checks
0.0
else if left == center and center == right // Crisp set (single point)
val == center ? 1.0 : 0.0
else if left == center // Left-shoulder shape (ramp down from 1 at center to 0 at right)
val >= right ? 0.0 : val <= center ? 1.0 : (right - val) / (right - center)
else if center == right // Right-shoulder shape (ramp up from 0 at left to 1 at center)
val <= left ? 0.0 : val >= center ? 1.0 : (val - left) / (center - left)
else // Standard triangle
math.max(0.0, math.min((val - left) / (center - left), (right - val) / (right - center)))
This implementation of triangular membership functions enables the indicator to transform crisp numerical values into degrees of membership in linguistic variables like "Large Positive" or "Small Negative," creating a more nuanced representation of market conditions.
Dynamic Percentile Normalization
A critical innovation in this indicator is the implementation of percentile-based normalization for SMA deviation:
// ----- Deviation Scale Estimation using Percentile -----
// Calculate the percentile rank of the *absolute* deviation over the lookback period.
// This gives an estimate of the 'typical maximum' deviation magnitude recently.
diff_abs_percentile = ta.percentile_linear_interpolation(math.abs(raw_diff), normLookback, percRank) + 1e-10
// ----- Normalize the Raw Deviation -----
// Divide the raw deviation by the estimated 'typical max' magnitude.
normalized_diff = raw_diff / diff_abs_percentile
// ----- Clamp the Normalized Deviation -----
normalized_diff_clamped = math.max(-3.0, math.min(3.0, normalized_diff))
This percentile normalization approach creates a self-adapting system that automatically calibrates to different assets and market regimes. Rather than using fixed thresholds, the indicator dynamically adjusts based on recent volatility patterns, significantly enhancing signal quality across diverse market environments.
Multi-Factor Fuzzy Rule System
The indicator implements a comprehensive fuzzy rule system that evaluates multiple technical factors:
SMA Deviation (Normalized): Measures price displacement from the Simple Moving Average
Rate of Change (ROC): Captures price momentum over a specified period
Relative Strength Index (RSI): Assesses overbought/oversold conditions
These factors are processed through a sophisticated fuzzy inference system with linguistic variables:
// ----- 3.1 Fuzzy Sets for Normalized Deviation -----
diffN_LP := fuzzy_triangle(normalized_diff_clamped, 0.7, 1.5, 3.0) // Large Positive (around/above percentile)
diffN_SP := fuzzy_triangle(normalized_diff_clamped, 0.1, 0.5, 0.9) // Small Positive
diffN_NZ := fuzzy_triangle(normalized_diff_clamped, -0.2, 0.0, 0.2) // Near Zero
diffN_SN := fuzzy_triangle(normalized_diff_clamped, -0.9, -0.5, -0.1) // Small Negative
diffN_LN := fuzzy_triangle(normalized_diff_clamped, -3.0, -1.5, -0.7) // Large Negative (around/below percentile)
// ----- 3.2 Fuzzy Sets for ROC -----
roc_HN := fuzzy_triangle(roc_val, -8.0, -5.0, -2.0)
roc_WN := fuzzy_triangle(roc_val, -3.0, -1.0, -0.1)
roc_NZ := fuzzy_triangle(roc_val, -0.3, 0.0, 0.3)
roc_WP := fuzzy_triangle(roc_val, 0.1, 1.0, 3.0)
roc_HP := fuzzy_triangle(roc_val, 2.0, 5.0, 8.0)
// ----- 3.3 Fuzzy Sets for RSI -----
rsi_L := fuzzy_triangle(rsi_val, 0.0, 25.0, 40.0)
rsi_M := fuzzy_triangle(rsi_val, 35.0, 50.0, 65.0)
rsi_H := fuzzy_triangle(rsi_val, 60.0, 75.0, 100.0)
Advanced Fuzzy Inference Rules
The indicator employs a comprehensive set of fuzzy rules that encode expert knowledge about market behavior:
// --- Fuzzy Rules using Normalized Deviation (diffN_*) ---
cond1 = math.min(diffN_LP, roc_HP, math.max(rsi_M, rsi_H)) // Strong Bullish: Large pos dev, strong pos roc, rsi ok
strength_SB := math.max(strength_SB, cond1)
cond2 = math.min(diffN_SP, roc_WP, rsi_M) // Weak Bullish: Small pos dev, weak pos roc, rsi mid
strength_WB := math.max(strength_WB, cond2)
cond3 = math.min(diffN_SP, roc_NZ, rsi_H) // Weakening Bullish: Small pos dev, flat roc, rsi high
strength_N := math.max(strength_N, cond3 * 0.6) // More neutral
strength_WB := math.max(strength_WB, cond3 * 0.2) // Less weak bullish
This rule system evaluates multiple conditions simultaneously, weighting them by their degree of membership to produce a comprehensive trend assessment. The rules are designed to identify various market conditions including strong trends, weakening trends, potential reversals, and neutral consolidations.
Defuzzification Process
The final step transforms the fuzzy result back into a crisp numerical value representing the overall trend strength:
// --- Step 6: Defuzzification ---
denominator = strength_SB + strength_WB + strength_N + strength_WBe + strength_SBe
if denominator > 1e-10 // Use small epsilon instead of != 0.0 for float comparison
fuzzyTrendScore := (strength_SB * STRONG_BULL +
strength_WB * WEAK_BULL +
strength_N * NEUTRAL +
strength_WBe * WEAK_BEAR +
strength_SBe * STRONG_BEAR) / denominator
The resulting FuzzyTrendScore ranges from -1 (strong bearish) to +1 (strong bullish), providing a smooth, continuous evaluation of market conditions that avoids the abrupt signal changes common in traditional indicators.
Advanced Visualization with Rainbow Gradient
The indicator incorporates sophisticated visualization using a rainbow gradient coloring system:
// Normalize score to for gradient function
normalizedScore = na(fuzzyTrendScore) ? 0.5 : math.max(0.0, math.min(1.0, (fuzzyTrendScore + 1) / 2))
// Get the color based on gradient setting and normalized score
final_color = get_gradient(normalizedScore, gradient_type)
This color-coding system provides intuitive visual feedback, with color intensity reflecting trend strength and direction. The gradient can be customized between Red-to-Green or Red-to-Blue configurations based on user preference.
Practical Applications
The Fuzzy SMA Trend Analyzer excels in several key applications:
Trend Identification: Precisely identifies market trend direction and strength with nuanced gradation
Market Regime Detection: Distinguishes between trending markets and consolidation phases
Divergence Analysis: Highlights potential reversals when price action and fuzzy trend score diverge
Filter for Trading Systems: Provides high-quality trend filtering for other trading strategies
Risk Management: Offers early warning of potential trend weakening or reversal
Parameter Customization
The indicator offers extensive customization options:
SMA Length: Adjusts the baseline moving average period
ROC Length: Controls momentum sensitivity
RSI Length: Configures overbought/oversold sensitivity
Normalization Lookback: Determines the adaptive calculation window for percentile normalization
Percentile Rank: Sets the statistical threshold for deviation normalization
Gradient Type: Selects the preferred color scheme for visualization
These parameters enable fine-tuning to specific market conditions, trading styles, and timeframes.
Acknowledgments
The rainbow gradient visualization component draws inspiration from LuxAlgo's "Rainbow Adaptive RSI" (used under CC BY-NC-SA 4.0 license). This implementation of fuzzy logic in technical analysis builds upon Fermi estimation principles to overcome the inherent limitations of crisp binary indicators.
This indicator is shared under Attribution-NonCommercial-ShareAlike 4.0 International (CC BY-NC-SA 4.0) license.
Remember that past performance does not guarantee future results. Always conduct thorough testing before implementing any technical indicator in live trading.

Highest High Line with Multi-Timeframe Supertrend and RSIOverview:
This powerful indicator combines three essential elements for traders:
Highest High Line – Tracks the highest price over a customizable lookback period across different timeframes.
Multi-Timeframe Supertrend – Displays Supertrend values and trend directions for multiple timeframes simultaneously.
Relative Strength Index (RSI) – Shows RSI values across different timeframes for momentum analysis.
Features:
✅ Customizable Highest High Line:
Selectable timeframes: Daily, Weekly, Monthly, Quarterly, Yearly
Adjustable lookback period
✅ Multi-Timeframe Supertrend:
Supports 1min, 5min, 10min, 15min, 30min, 1H, Daily, Weekly, Monthly, Quarterly, Yearly
ATR-based calculation with configurable ATR period and multiplier
Identifies bullish (green) & bearish (red) trends
✅ Multi-Timeframe RSI:
Calculates RSI for the same timeframes as Supertrend
Overbought (≥70) and Oversold (≤30) signals with color coding
✅ Comprehensive Table Display:
A clean, structured table in the bottom-right corner
Displays Supertrend direction, value, and RSI for all timeframes
Helps traders quickly assess trend and momentum alignment
How to Use:
Use the Highest High Line to identify key resistance zones.
Confirm trend direction with Multi-Timeframe Supertrend.
Check RSI values to avoid overbought/oversold conditions before entering trades.
Align multiple timeframes for stronger confirmation of trend shifts.
Ideal For:
✅ Scalpers (lower timeframes: 1m–30m)
✅ Swing Traders (higher timeframes: 1H–D)
✅ Position Traders (Weekly, Monthly, Quarterly)
💡 Tip: Look for Supertrend & RSI confluence across multiple timeframes for higher probability setups.

Dual Volume Divergence LineDual Volume Divergence Line (DVD/Line)
🔹 Overview
The Dual Volume Divergence Line (DVD/Line) is a custom Pine Script™ indicator designed to identify potential trend reversals and continuations by analyzing volume and price divergences. This script is inspired by the original concept of the Dual Volume Divergence Index (DVDI) by DonovanWall and has been modified and enhanced by keremertem. Special thanks to DonovanWall for the original concept. The indicator combines volume-based calculations with price action to generate signals for bullish and bearish divergences, both normal and hidden. Below is a detailed breakdown of its components and functionality.
🔹 Key Features of the DVD/Line Indicator
1. Dual Volume Divergence Calculation:
- The indicator calculates two primary volume-based indices: the Positive Volume Index (PVI) and the Negative Volume Index (NVI).
- PVI measures the impact of volume on price when the price increases, while NVI measures the impact when the price decreases.
- These indices are used to detect divergences between volume and price, which can signal potential reversals or continuations.
2. Customizable Inputs:
- DVD Sampling Period: Adjusts the sensitivity of the indicator by controlling the lookback period for calculating the volume-weighted moving averages (VWMA) of PVI and NVI.
- Band Width: Defines the range for calculating the upper and lower bands, which act as dynamic support and resistance levels.
- Source: Allows users to select the price source (e.g., `hlc3`, `close`, etc.) for calculations.
3. Volume-Weighted Moving Averages (VWMA):
- Instead of using traditional moving averages, the script employs VWMA to smooth the PVI and NVI signals. This ensures that the indicator is more responsive to changes in volume.
4. Upper and Lower Bands:
- The upper and lower bands are calculated using the Root Mean Square (RMS) of the highest and lowest values of the DVD line over a user-defined period. These bands help identify overbought and oversold conditions.
5. Divergence Detection:
- The script identifies four types of divergences:
- Normal Bullish Divergence: Occurs when price makes a lower low, but the DVD line makes a higher low.
- Hidden Bullish Divergence: Occurs when price makes a higher low, but the DVD line makes a lower low.
- Normal Bearish Divergence: Occurs when price makes a higher high, but the DVD line makes a lower high.
- Hidden Bearish Divergence: Occurs when price makes a lower high, but the DVD line makes a higher high.
- These divergences are visually highlighted on the chart using labels.
6. Customizable Divergence Selection:
- Users can choose between two types of divergence calculations:
- DVDI: Based on the raw divergence values.
- DVD Line: Based on the smoothed DVD line.
7. Visual Enhancements:
- The DVD line is plotted with a color-coded scheme: blue when the DVD line is above its signal line (bullish) and pink when it is below (bearish).
- The upper and lower bands are displayed as step lines, making it easier to identify key levels.
🔹 How the Indicator Works
1. Volume-Based Calculations:
- The script starts by calculating the PVI and NVI based on the selected price source and volume data.
- PVI increases when the price rises, while NVI decreases when the price falls. These indices are then smoothed using VWMA to generate signals.
2. DVD Line Calculation:
- The DVD line is derived by combining the divergences of PVI and NVI. It is further smoothed using a Weighted Moving Average (WMA) and a linear regression line for trend analysis.
3. Divergence Detection:
- The script identifies pivot points in the DVD line and compares them with price action to detect divergences.
- Normal divergences indicate potential reversals, while hidden divergences suggest trend continuations.
4. Dynamic Bands:
- The upper and lower bands are calculated using RMS, which provides a more accurate representation of volatility compared to standard deviation or fixed-width bands.
5. Labeling:
- Divergences are labeled directly on the chart with clear text and color coding:
🟢 Bullish Divergence: Green label with "Bull".
🟩 Bearish Divergence: Red label with "Bear".
🔴 Hidden Bullish Divergence: Lime label with "hid.".
🟧 Hidden Bearish Divergence: Orange label with "hid.".
🔹 Unique Aspects of This Script
1. Volume-Weighted Smoothing:
- Unlike traditional divergence indicators that rely on simple moving averages, this script uses VWMA and WMA to ensure that volume plays a significant role in signal generation.
2. Dynamic Bands with RMS:
- The use of RMS for calculating bands provides a more adaptive and accurate representation of market conditions, especially in volatile markets.
3. Flexible Divergence Selection:
- Users can choose between raw divergence values (DVDI) or smoothed values (DVD Line), allowing for greater customization based on trading style.
4. Comprehensive Divergence Detection:
- The script detects both normal and hidden divergences, providing a complete picture of potential trend reversals and continuations.
5. User-Friendly Visuals:
- The color-coded DVD line and cross-style bands make it easy to interpret the indicator at a glance.
🔹 How to Use the Indicator
1. Trend Identification:
- Use the Middle Band and its color to identify the current trend. A green line suggests bullish momentum, while a red line indicates bearish momentum. Additionally, a bullish momentum may be indicated when the DVD line crosses up, and a bearish momentum may be indicated when it crosses down the Middle Band.
2. Divergence Trading:
- Look for divergences between the DVD line and price action. Normal divergences can be used for counter-trend trades, while hidden divergences can confirm trend continuations.
3. Band Breakouts:
- Monitor the upper and lower bands for potential breakout or reversal signals. A break above the upper band may indicate overbought conditions, while a break below the lower band may suggest oversold conditions.
4. Customization:
- Adjust the sampling period and band width to suit different timeframes and trading strategies. Shorter periods are more sensitive, while longer periods provide smoother signals.
🔹 Conclusion
The Dual Volume Divergence Line (DVD/Line) is a powerful and versatile indicator that combines volume analysis with price action to generate actionable trading signals. Its unique use of volume-weighted smoothing, dynamic bands, and comprehensive divergence detection sets it apart from traditional divergence indicators. Whether you're a day trader or a long-term investor, this tool can help you identify high-probability trading opportunities with greater accuracy and confidence.
📌 Disclaimer: This script is for educational purposes only and does not constitute financial advice. Always conduct your own analysis before making trading decisions.

Scalping Entry/Exit Indicator by DiGetImagine having a tool that not only spots high-probability entry signals but also visually marks them on your chart with color-coded cues and automated alerts. The Scalping Entry/Exit Indicator by DiGet does exactly that—by fusing a range of classic candlestick patterns (such as Bullish Hammers, Engulfing patterns, and Morning/Evening Stars) with dynamic risk management levels, this script empowers you to make swift and informed trading decisions. Whether you're an active trader or an algorithm enthusiast, this indicator offers both precision and clarity in identifying scalp opportunities, making your chart analysis more efficient and visually engaging.
Indicator Breakdown
Input Parameters:
The indicator accepts a customizable risk-reward ratio, an ATR period for volatility measurement, and a lookback period to scan for valid candlestick patterns.
ATR & Candle Calculations:
It computes the Average True Range (ATR) to dynamically set stop-loss and take-profit levels. Additionally, it determines the body and wick sizes of each candlestick to help identify key reversal patterns.
Pattern Detection:
Multiple bullish patterns (Hammer, Engulfing, Morning Star) and bearish patterns (Shooting Star, Engulfing, Evening Star) are detected. There’s also a simplified version of the Head & Shoulders pattern, offering further validation for reversal signals.
Signal Generation & Trade Levels:
The script consolidates the pattern signals into combined “buy” and “sell” triggers. It then calculates the respective stop-loss (SL) and take-profit (TP) levels based on the current price and ATR, providing a robust risk management framework.
Visual Aids & Alerts:
To enhance usability, the indicator changes the chart’s background color to green for buy signals and red for sell signals. It also draws labels, lines (representing SL and TP), and markers directly on the chart, along with alert conditions to notify traders of actionable signals.
This indicator is an excellent addition to your TradingView toolkit—ideal for scalpers and short-term traders seeking clarity, precision, and automated signal generation on their charts.
Enjoy trading with confidence and precision!

Quarterly Theory ICT 03 [TradingFinder] Precision Swing Points🔵 Introduction
Precision Swing Point (PSP) is a divergence pattern in the closing of candles between two correlated assets, which can indicate a potential trend reversal. This structure appears at market turning points and highlights discrepancies between the price behavior of two related assets.
PSP typically forms in key timeframes such as 5-minute, 15-minute, and 90-minute charts, and is often used in combination with Smart Money Concepts (SMT) to confirm trade entries.
PSP is categorized into Bearish PSP and Bullish PSP :
Bearish PSP : Occurs when an asset breaks its previous high, and its middle candle closes bullish, while the correlated asset closes bearish at the same level. This divergence signals weakness in the uptrend and a potential price reversal downward.
Bullish PSP : Occurs when an asset breaks its previous low, and its middle candle closes bearish, while the correlated asset closes bullish at the same level. This suggests weakness in the downtrend and a potential price increase.
🟣 Trading Strategies Using Precision Swing Point (PSP)
PSP can be integrated into various trading strategies to improve entry accuracy and filter out false signals. One common method is combining PSP with SMT (divergence between correlated assets), where traders identify divergence and enter a trade only after PSP confirms the move.
Additionally, PSP can act as a liquidity gap, meaning that price tends to react to the wick of the PSP candle, making it a favorable entry point with a tight stop-loss and high risk-to-reward ratio. Furthermore, PSP combined with Order Blocks and Fair Value Gaps in higher timeframes allows traders to identify stronger reversal zones.
In lower timeframes, such as 5-minute or 15-minute charts, PSP can serve as a confirmation for more precise entries in the direction of the higher timeframe trend. This is particularly useful in scalping and intraday trading, helping traders execute smarter entries while minimizing unnecessary stop-outs.
🔵 How to Use
PSP is a trading pattern based on divergence in candle closures between two correlated assets. This divergence signals a difference in trend strength and can be used to identify precise market turning points. PSP is divided into Bullish PSP and Bearish PSP, each applicable for long and short trades.
🟣 Bullish PSP
A Bullish PSP forms when, at a market turning point, the middle candle of one asset closes bearish while the correlated asset closes bullish. This discrepancy indicates weakness in the downtrend and a potential price reversal upward.
Traders can use this as a signal for long (buy) trades. The best approach is to wait for price to return to the wick of the PSP candle, as this area typically acts as a liquidity level.
f PSP forms within an Order Block or Fair Value Gap in a higher timeframe, its reliability increases, allowing for entries with tight stop-loss and optimal risk-to-reward ratios.
🟣 Bearish PSP
A Bearish PSP forms when, at a market turning point, the middle candle of one asset closes bullish while the correlated asset closes bearish. This indicates weakness in the uptrend and a potential price decline.
Traders use this pattern to enter short (sell) trades. The best entry occurs when price retests the wick of the PSP candle, as this level often acts as a resistance zone, pushing price lower.
If PSP aligns with a significant liquidity area or Order Block in a higher timeframe, traders can enter with greater confidence and place their stop-loss just above the PSP wick.
Overall, PSP is a highly effective tool for filtering false signals and improving trade entry precision. Combining PSP with SMT, Order Blocks, and Fair Value Gaps across multiple timeframes allows traders to execute higher-accuracy trades with lower risk.
🔵 Settings
Mode :
2 Symbol : Identifies PSP and PCP between two correlated assets.
3 Symbol : Compares three assets to detect more complex divergences and stronger confirmation signals.
Second Symbol : The second asset used in PSP and correlation calculations.
Third Symbol : Used in three-symbol mode for deeper PSP and PCP analysis.
Filter Precision X Point : Enables or disables filtering for more precise PSP and PCP detection. This filter only identifies PSP and PCP when the base asset's candle qualifies as a Pin Bar.
Trend Effect : By changing the Trend Effect status to "Off," all Pin bars, whether bullish or bearish, are displayed regardless of the current market trend. If the status remains "On," only Pin bars in the direction of the main market trend are shown.
Bullish Pin Bar Setting : Using the "Ratio Lower Shadow to Body" and "Ratio Lower Shadow to Higher Shadow" settings, you can customize your bullish Pin bar candles. Larger numbers impose stricter conditions for identifying bullish Pin bars.
Bearish Pin Bar Setting : Using the "Ratio Higher Shadow to Body" and "Ratio Higher Shadow to Lower Shadow" settings, you can customize your bearish Pin bar candles. Larger numbers impose stricter conditions for identifying bearish Pin bars.
🔵 Conclusion
Precision Swing Point (PSP) is a powerful analytical tool in Smart Money trading strategies, helping traders identify precise market turning points by detecting divergences in candle closures between correlated assets. PSP is classified into Bullish PSP and Bearish PSP, each playing a crucial role in detecting trend weaknesses and determining optimal entry points for long and short trades.
Using the PSP wick as a key liquidity level, integrating it with SMT, Order Blocks, and Fair Value Gaps, and analyzing higher timeframes are effective techniques to enhance trade entries. Ultimately, PSP serves as a complementary tool for improving entry accuracy and reducing unnecessary stop-outs, making it a valuable addition to Smart Money trading methodologies.

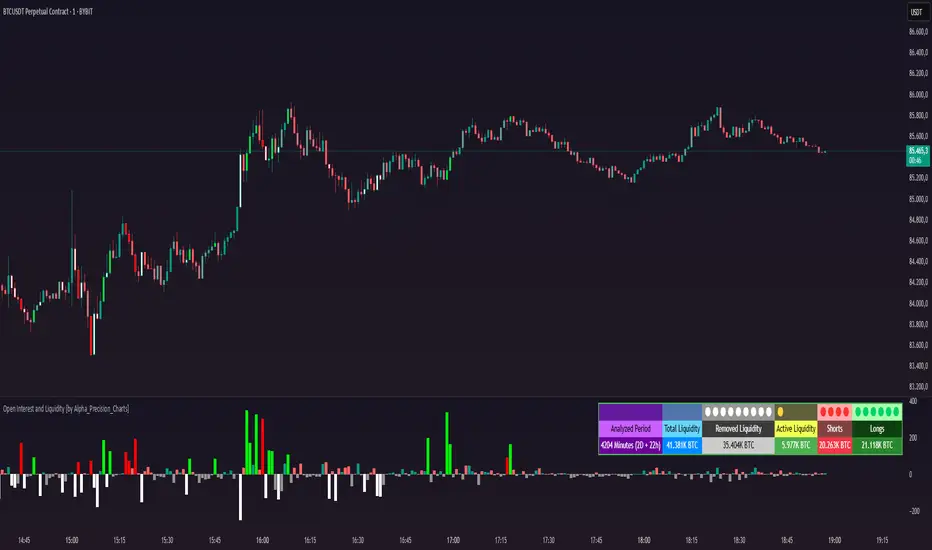
Open Interest and Liquidity [by Alpha_Precision_Charts]Indicator Description: Open Interest and Liquidity
Introduction:
The "Open Interest and Liquidity" indicator is an advanced tool designed for traders seeking to analyze aggregated Open Interest (OI) flow and liquidity in the cryptocurrency market, with a special focus on Bitcoin. It combines high-quality Open Interest data, a detailed liquidity table, and a visual longs vs shorts gauge, providing a comprehensive real-time view of market dynamics. Ideal for scalpers, swing traders, and volume analysts, this indicator is highly customizable and optimized for 1-minute charts, though it works across other timeframes as well.
Key Features:
Aggregated Open Interest and Delta: Leverages Binance data for accuracy, allowing traders to switch between displaying absolute OI or OI Delta, with value conversion to base currency or USD.
Liquidity Table: Displays the analyzed period, active liquidity, shorts, and longs with visual proportion bars, functioning for various cryptocurrencies as long as Open Interest data is available.
Longs vs Shorts Gauge: A semicircle visual that shows real-time market sentiment, adjustable for chart positioning, helping identify imbalances, optimized and exclusive for Bitcoin on 1-minute charts.
Utilities:
Sentiment Analysis: Quickly detect whether the market is accumulating positions (longs/shorts) or liquidating (OI exits).
Pivot Identification: Highlight key moments of high buying or selling pressure, ideal for trade entries or exits.
Liquidity Monitoring: The table and gauge provide a clear view of active liquidity, helping assess a move’s strength.
Scalping and Day Trading: Perfect for short-term traders operating on 1-minute charts, offering fast and precise visual insights.
How to Use:
Initial Setup: Choose between "Open Interest" (candles) or "Open Interest Delta" (columns) in the "Display" field. The indicator defaults to Binance data for enhanced accuracy.
Customization: Enable/disable the table and gauge as needed and position them on the chart.
Interpretation: Combine OI Delta and gauge data with price movement to anticipate breakouts or reversals.
Technical Notes
The indicator uses a 500-period VWMA to calculate significant OI Delta thresholds and is optimized for Bitcoin (BTCUSDT.P) on high-liquidity charts.
Disclaimer
This indicator relies on the availability of Open Interest data on TradingView. For best results, use on Bitcoin charts with high liquidity, such as BTCUSDT.P. Accuracy may vary with lower-volume assets or exchanges.
AO Smart Scalper – 5M Dynamic SL Edition📈 AO Signals with Fixed and Dynamic SL – Optimized for 5-Minute Charts 📉
This indicator is built for 5-minute timeframe trading, combining powerful momentum signals from the Awesome Oscillator (AO) with both Fixed and Dynamic Stop Loss (SL) levels to enhance trade management and risk control.
✅ Buy/Sell Signals:
The indicator generates clear BUY and SELL signals based on the AO crossing above or below the zero line, helping traders capture momentum shifts early.
🛑 Fixed Stop Loss:
Each trade signal comes with a Fixed SL, calculated based on the high (for shorts) or low (for longs) of the previous candle, with a customizable percentage offset. This SL is plotted with a red line, providing a clear initial risk level.
⚡ Dynamic Stop Loss: Continuous Presence, Strategic Use:
A secondary Dynamic SL line is plotted, which is continuously present on the chart. This dynamic level responds to market conditions and can serve as a trailing stop or key decision point.
💡 Recommended Use: It is recommended to actively start using the Dynamic SL once the trade has moved into profit. This allows protecting obtained profits and minimizing the risk of losses in case of a market reversal.
🛡️ Enhanced Dynamic Stop-Loss Strategy:
🔒 Initial Protection: Utilize the Fixed SL as the initial stop-loss, placed below relevant lows (for longs) or above relevant highs (for shorts), or as provided by the fixed SL indicator.
🛤️ Dynamic Tracking:
🟢 Long Trades: Once in profit, the Dynamic SL will dynamically adjust, moving upwards as higher lows are formed, effectively trailing the price and securing profits.
🔴 Short Trades: Conversely, in short trades, once in profit, the Dynamic SL will move downwards as lower highs are formed, protecting gains.
🔄 Alternatively the dynamic stop loss will follow the dynamic SL line provided by the indicator.
🚪 Exiting Trades: When the price crosses below the Dynamic SL line in a LONG trade, or above it in a SHORT trade, the recommended action is to exit the trade.
↩️ Re-entry Consideration: You may consider re-entering only if the price clearly returns above the Dynamic SL (for longs) or below it (for shorts).
⚠️ IMPORTANT - 5-Minute Strategy Guidance ⏱️
This tool is specifically optimized for the 5-minute timeframe. This approach helps filter out weak setups and maintain discipline in volatile market conditions.
✨ Additional Features:
👁️ Visual and editable SL levels
📊 200-period SMA for trend context
💻 Simple and effective interface for intraday trading setups
🎯 Ideal for traders seeking a clean, rule-based system that combines momentum entry signals with layered stop loss protection.
🔑 Key Changes:
It was emphasized that the Dynamic SL is always present, but its active use is recommended once the trade is in profit.
It was clarified the use of the Fixed SL, giving the option to use the one provided by the indicator, or to place it according to the price action.

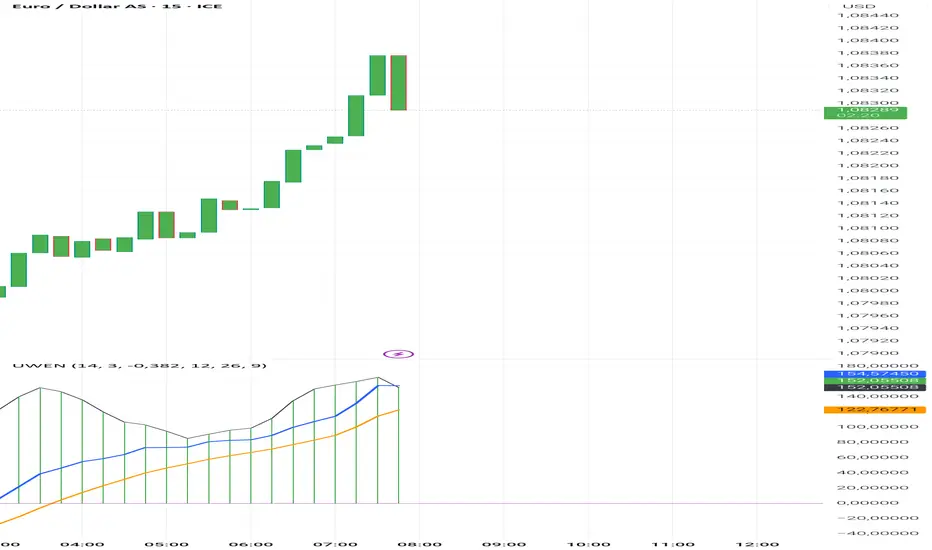
Uwen FX: UWEN StrategyThis Pine Script defines a trading indicator called "Uwen FX: UWEN Strategy" Where ideas coming from Arab Syaukani and modified by Fiki Hafana. It combines a CCI-based T3 Smoothed Indicator with a MACD overlay. Here's a breakdown of what it does:
Key Components of the Script:
1. CCI (Commodity Channel Index) with T3 Smoothing
Uses a T3 smoothing algorithm on the CCI to generate a smoother momentum signal. The smoothing formula is applied iteratively using weighted averages. The final result (xccir) is plotted as a histogram, colored green for bullish signals and red for bearish signals.
2. MACD (Moving Average Convergence Divergence)
The MACD is scaled to match the range of the smoothed CCI for better visualization. Signal Line and MACD Line are plotted if showMACD is enabled. The normalization ensures that MACD values align with the CCI-based indicator.
3. Bar Coloring for Trend Indication
Green bars indicate a positive trend (pos = 1).
Red bars indicate a negative trend (pos = -1).
Blue bars appear when the trend is neutral.
How It Can Be Used:
Buy Signal: When the xccir (smoothed CCI) turns green, indicating bullish momentum.
Sell Signal: When xccir turns red, indicating bearish momentum.
MACD Confirmation: Helps confirm the trend direction by aligning with xccir.
I will add more interesting features if this indicator seems profitable
Ivan Gomes StrategyIG Signals+ - Ivan Gomes Strategy
This script is designed for scalping and binary options trading, generating buy and sell signals at the beginning of each candle. Although it is mainly optimized for short-term operations, it can also be used for medium and long-term strategies with appropriate adjustments.
How It Works
• The indicator provides buy or sell signals at the start of the candle, based on a statistical probability of candle patterns, depending on the timeframe.
• It is essential to enter the trade immediately after the signal appears and exit at the end of the same candle.
• If the first operation results in a loss (Loss), the script will send another trade signal at the start of the next candle. However, if the first trade results in a win (Gain), no new signal will be generated.
• The signals follow cycles of 3 candles, regardless of the timeframe. However, if a Doji candle appears, the cycle is interrupted, and no signals will be generated until the next valid cycle starts.
• The strategy consists of up to two trades per cycle: if the first trade is not successful, the second trade serves as an additional attempt to recover.
Key Points to Consider
1. Avoid trading in sideways markets – If price levels do not fluctuate significantly, the accuracy of the signals may decrease.
2. Trade in the direction of the trend – Using Ichimoku clouds or other trend indicators can help confirm trend direction and improve signal reliability. If the market is in an uptrend (bullish trend) and the indicator generates a sell signal, the most prudent decision would be to wait for a buy signal that aligns with the main trend. The same applies to downtrends, where buy signals may be riskier.
These decisions should be based on chart reading and supported by other technical analysis tools, such as support and resistance levels, which indicate zones where price might face obstacles or reverse direction. Additionally, Fibonacci retracement levels can help identify possible pullback points within a trend. Moving averages are also useful for visualizing the general market direction and confirming whether an indicator signal aligns with the overall price structure. Combining these tools can increase trade accuracy and prevent unnecessary trades against the main trend, reducing risks.
3. Works based on probability statistics – The algorithm analyzes candle formations and their statistical probabilities depending on the timeframe to optimize trade entries.
4. Best suited for scalping and binary options – This strategy performs best in 1-minute and 5-minute timeframes, allowing for multiple trades throughout the day.
Technical Details
• The script detects the candle cycle and assigns an index to each candle to identify patterns and possible reversals.
• It recognizes reference candles, stores their colors, and compares them with subsequent candles to determine if a signal should be triggered.
• Doji candle rules are implemented to avoid false signals in indecisive market conditions. When a Doji appears, the script does not generate signals for that cycle.
• The indicator displays visual alerts and notifications, ensuring fast execution of trades.
Disclaimer
The IG Signals+ indicator was created to assist traders who struggle to analyze the market by providing objective trade signals. However, no strategy is foolproof, and this script does not guarantee profits.
Trading involves significant financial risk, and users should test it in a demo account before trading with real money. Proper risk management is crucial for long-term success.

kurd fx Dynamic EMA StrategyDynamic EMA Strategy Explanation
This TradingView Pine Script indicator, "Dynamic EMA Strategy," is designed to plot Exponential Moving Averages (EMAs) dynamically based on the selected timeframe. It adjusts the EMA periods depending on whether the trader is scalping, swing trading, or position trading.
Functionality
1. Defining EMA Periods Based on Timeframe
The script determines appropriate EMA values based on the selected chart timeframe:
Scalping (1m, 3m, 5m)
Uses EMA 9, EMA 21, and EMA 50 for fast-moving market conditions.
Swing Trading (15m, 30m, 45m)
Uses EMA 50 and EMA 100, suitable for medium-term trend identification.
EMA 3 is disabled (na) in this mode.
Position Trading (1H and higher)
Uses EMA 100 and EMA 200 to identify long-term trends.
EMA 3 is disabled (na) in this mode.
2. EMA Calculation
The script calculates EMA values dynamically:
emaLine1 = ta.ema(close, ema1): Computes the first EMA.
emaLine2 = ta.ema(close, ema2): Computes the second EMA.
emaLine3 = not na(ema3) ? ta.ema(close, ema3) : na: Computes the third EMA only if applicable.
3. Plotting the EMAs
The script overlays the EMAs on the chart:
Blue Line (EMA 1) → Represents the fastest EMA.
Orange Line (EMA 2) → Represents the medium EMA.
Red Line (EMA 3) → Represents the slowest EMA (if applicable).
Each EMA is plotted using plot() with a specific color, linewidth of 2, and plot.style_line for a clean visualization.
Use Case
Scalpers can identify short-term momentum changes.
Swing traders can detect medium-term trends.
Position traders can spot long-term market trends.
This strategy helps traders adjust their EMA settings dynamically without manually changing them for different timeframes.

TTC EMA Scalping Machine with RSI Filter and MACDTTC EMA Scalping Machine with RSI Filter and MACD
TTC EMA Scalping Machine with RSI Filter and MACD is a multi-layered technical analysis tool designed for traders looking to scalp the markets with a combination of trend-following and momentum-based indicators. This strategy leverages Exponential Moving Averages (EMAs) , Relative Strength Index (RSI) , MACD , and Volume Analysis to help traders identify high-probability entry points for short and long trades. The indicator can be used in multiple market conditions and is suited for both beginners and experienced traders looking for clear entry signals.
---
Key Features :
1. EMA-Based Trend Filtering :
- The indicator uses four Exponential Moving Averages (EMAs) with different periods:
- EMA 10 (Short-Term) : The fastest-moving average for detecting quick price movements.
- EMA 20 (Medium-Term) : A central trendline for market momentum.
- EMA 30 (Long-Term) : To observe broader market trends.
- EMA 50 (Longest-Term) : To identify the overall market direction.
- These EMAs are plotted on the chart and used to create EMA bands , visually displaying potential support and resistance levels. Price action inside these bands helps identify scalping opportunities.
2. RSI Filter :
- RSI (Relative Strength Index) is used to gauge overbought and oversold conditions in the market:
- Overbought condition (RSI > 70) : The market may be overextended, signaling the possibility of a short.
- Oversold condition (RSI < 30) : The market may be undervalued, signaling the possibility of a long.
- The RSI filter ensures that trades are not taken when the market is overextended, offering a more conservative approach to trade entries.
3. MACD Momentum Analysis :
- The MACD (Moving Average Convergence Divergence) indicator is included to confirm the trend and momentum direction:
- Long Condition : The MACD line crosses above the signal line, confirming a bullish momentum.
- Short Condition : The MACD line crosses below the signal line, confirming a bearish momentum.
- This serves as an additional filter to verify if the market momentum aligns with the long or short entry criteria.
4. Long Entry (Buy Signal) :
- A long entry signal is triggered when the following conditions are met:
- The price is above EMA 20 (indicating an overall bullish market).
- The price is within the green EMA band (EMA 10 and EMA 20), suggesting short-term support.
- The RSI is below 70 (indicating the market is not overbought).
- The MACD line is above the signal line , showing bullish momentum.
- These conditions combined suggest an ideal environment for entering a long position.
5. Short Entry (Sell Signal) :
- A short entry signal is triggered when the following conditions are met:
- The price is below EMA 20 (indicating an overall bearish market).
- The price is within the green EMA band (EMA 20 and EMA 30), suggesting short-term resistance.
- The RSI is above 30 (indicating the market is not oversold).
- The MACD line is below the signal line , showing bearish momentum.
- These conditions combined suggest an ideal environment for entering a short position.
6. Signal Alerts :
- Long Alerts : Users can set alerts to notify them when a long condition is met. These alerts are triggered when all the criteria for a long entry are satisfied.
- Short Alerts : Similarly, users can set alerts for short signals, notifying them when all the conditions for a short entry are satisfied.
7. EMA Bands :
- The EMA bands are visually represented with colored fills between the EMAs, providing a visual aid to recognize potential trading zones. These zones can serve as a reference for traders to make quick decisions regarding entries and exits.
8. Volume Filter :
- The indicator also includes a volume filter , which compares the current volume to its 20-period simple moving average. Higher volumes provide confirmation of price movement, which can indicate stronger potential for the trade.
---
How It Works :
- Long Trades : The indicator suggests a long position when the price is above the EMA 20, within the green EMA band, the RSI is not overbought, and MACD confirms bullish momentum (MACD line above the signal line).
- Short Trades : The indicator suggests a short position when the price is below the EMA 20, within the green EMA band, the RSI is not oversold, and MACD confirms bearish momentum (MACD line below the signal line).
- Volume Confirmation : The indicator uses a volume-based filter to ensure the trade is backed by sufficient market participation.
---
Usage :
- Best for Scalping : This strategy is designed for short-term trades ( scalping ) and can be applied to any time frame, though it works best on intraday charts, such as 5-minute or 15-minute charts.
- Ideal for Trend-Following : With the use of EMAs and MACD, the strategy is best suited for markets that exhibit clear trends. It helps to avoid whipsaw trades and focuses on capturing medium-term trends.
- Risk Management : By using RSI, MACD, and volume analysis together, this strategy reduces the likelihood of entering a trade in an overextended market, which helps with risk management.
---
Alerts and Signals :
- Long Signals : When all conditions are met for a long trade, a green label appears below the price bar, indicating a potential buy opportunity. An alert is also generated, notifying the user.
- Short Signals : When all conditions are met for a short trade, a red label appears above the price bar, indicating a potential sell opportunity. An alert is also generated, notifying the user.
---
This combination of EMA , RSI , MACD , and volume-based filters creates a balanced approach to scalping, ensuring that traders receive clear, actionable entry signals with trend confirmation, while avoiding overbought and oversold conditions that may lead to false signals. The indicator is designed to help traders confidently identify high-probability trades while maintaining simplicity and clarity in its setup.

Multi-Indicator Signals with Selectable Options by DiGetMulti-Indicator Signals with Selectable Options
Script Overview
This Pine Script is a multi-indicator trading strategy designed to generate buy/sell signals based on combinations of popular technical indicators: RSI (Relative Strength Index) , CCI (Commodity Channel Index) , and Stochastic Oscillator . The script allows you to select which combination of signals to display, making it highly customizable and adaptable to different trading styles.
The primary goal of this script is to provide clear and actionable entry/exit points by visualizing buy/sell signals with arrows , labels , and vertical lines directly on the chart. It also includes input validation, dynamic signal plotting, and clutter-free line management to ensure a clean and professional user experience.
Key Features
1. Customizable Signal Types
You can choose from five signal types:
RSI & CCI : Combines RSI and CCI signals for confirmation.
RSI & Stochastic : Combines RSI and Stochastic signals.
CCI & Stochastic : Combines CCI and Stochastic signals.
RSI & CCI & Stochastic : Requires all three indicators to align for a signal.
All Signals : Displays individual signals from each indicator separately.
This flexibility allows you to test and use the combination that works best for your trading strategy.
2. Clear Buy/Sell Indicators
Arrows : Buy signals are marked with upward arrows (green/lime/yellow) below the candles, while sell signals are marked with downward arrows (red/fuchsia/gray) above the candles.
Labels : Each signal is accompanied by a label ("BUY" or "SELL") near the arrow for clarity.
Vertical Lines : A vertical line is drawn at the exact bar where the signal occurs, extending from the low to the high of the candle. This ensures you can pinpoint the exact entry point without ambiguity.
3. Dynamic Overbought/Oversold Levels
You can customize the overbought and oversold levels for each indicator:
RSI: Default values are 70 (overbought) and 30 (oversold).
CCI: Default values are +100 (overbought) and -100 (oversold).
Stochastic: Default values are 80 (overbought) and 20 (oversold).
These levels can be adjusted to suit your trading preferences or market conditions.
4. Input Validation
The script includes built-in validation to ensure that oversold levels are always lower than overbought levels for each indicator. If the inputs are invalid, an error message will appear, preventing incorrect configurations.
5. Clean Chart Design
To avoid clutter, the script dynamically manages vertical lines:
Only the most recent 50 buy/sell lines are displayed. Older lines are automatically deleted to keep the chart clean.
Labels and arrows are placed strategically to avoid overlapping with candles.
6. ATR-Based Offset
The vertical lines and labels are offset using the Average True Range (ATR) to ensure they don’t overlap with the price action. This makes the signals easier to see, especially during volatile market conditions.
7. Scalable and Professional
The script uses arrays to manage multiple vertical lines, ensuring scalability and performance even when many signals are generated.
It adheres to Pine Script v6 standards, ensuring compatibility and reliability.
How It Works
Indicator Calculations :
The script calculates the values of RSI, CCI, and Stochastic Oscillator based on user-defined lengths and smoothing parameters.
It then checks for crossover/crossunder conditions relative to the overbought/oversold levels to generate individual signals.
Combined Signals :
Depending on the selected signal type, the script combines the individual signals logically:
For example, a "RSI & CCI" buy signal requires both RSI and CCI to cross into their respective oversold zones simultaneously.
Signal Plotting :
When a signal is generated, the script:
Plots an arrow (upward for buy, downward for sell) at the corresponding bar.
Adds a label ("BUY" or "SELL") near the arrow for clarity.
Draws a vertical line extending from the low to the high of the candle to mark the exact entry point.
Line Management :
To prevent clutter, the script stores up to 50 vertical lines in arrays (buy_lines and sell_lines). Older lines are automatically deleted when the limit is exceeded.
Why Use This Script?
Versatility : Whether you're a scalper, swing trader, or long-term investor, this script can be tailored to your needs by selecting the appropriate signal type and adjusting the indicator parameters.
Clarity : The combination of arrows, labels, and vertical lines ensures that signals are easy to spot and interpret, even in fast-moving markets.
Customization : With adjustable overbought/oversold levels and multiple signal options, you can fine-tune the script to match your trading strategy.
Professional Design : The script avoids clutter by limiting the number of lines displayed and using ATR-based offsets for better visibility.
How to Use This Script
Add the Script to Your Chart :
Copy and paste the script into the Pine Editor in TradingView.
Save and add it to your chart.
Select Signal Type :
Use the "Signal Type" dropdown menu to choose the combination of indicators you want to use.
Adjust Parameters :
Customize the lengths of RSI, CCI, and Stochastic, as well as their overbought/oversold levels, to match your trading preferences.
Interpret Signals :
Look for green arrows and "BUY" labels for buy signals, and red arrows and "SELL" labels for sell signals.
Vertical lines will help you identify the exact bar where the signal occurred.
Tips for Traders
Backtest Thoroughly : Before using this script in live trading, backtest it on historical data to ensure it aligns with your strategy.
Combine with Other Tools : While this script provides reliable signals, consider combining it with other tools like support/resistance levels or volume analysis for additional confirmation.
Avoid Overloading the Chart : If you notice too many signals, try tightening the overbought/oversold levels or switching to a combined signal type (e.g., "RSI & CCI & Stochastic") for fewer but higher-confidence signals.
