Price Action Trend and Margin EquityThe Price Action Trend and Margin Equity indicator is a multifunctional market analysis tool that combines elements of money management and price pattern analysis. The indicator helps traders identify key price action patterns and determine optimal entry, exit and stop loss levels based on the current trend.
The main components of the indicator:
Money Management:
Allows the trader to set risk management parameters such as the percentage of possible loss on the position, the use of fixed leverage and the total capital.
Calculates the required leverage level to achieve a specified percentage of loss.
Price Action:
Correctly identifies various price patterns such as Pin Bar, Engulfing Bar, PPR Bar and Inside Bar.
Displays these patterns on the chart with the ability to customize candle colors and display styles.
Allows the trader to customize take profit and stop loss points to display them on the chart.
The ability to display patterns only in the direction of the trend.
Trend: (some code taken from ChartPrime)
Uses a trend cloud to visualize the current market direction.
The trend cloud is displayed on the chart and helps traders determine whether the market is in an uptrend or a downtrend.
Alert:
Allows you to set an alert that will be triggered when the pattern is formed.
Example of use:
Let's say a trader uses the indicator to trade the crypto market. He sets the money management parameters, setting the maximum loss per position to 5% and using a fixed leverage of 1:100. The indicator automatically calculates the required position size to meet these parameters ($: on the label). Or displays the leverage (X: on the label) to achieve the required risk.
The trader receives an alert when a Pin Bar is formed. The indicator displays the entry, exit, and stop loss levels based on this pattern. The trader opens a position for the recommended amount in the direction indicated by the indicator and sets the stop loss and take profit at the recommended levels.
General Settings:
Position Loss Percentage: Sets the maximum loss percentage you are willing to take on a single position.
Use Fixed Leverage: Enables or disables the use of fixed leverage.
Fixed Leverage: Sets the fixed leverage level.
Total Equity: Specifies the total equity you are using for trading. (Required for calculation when using fixed leverage)
Turn Patterns On/Off: You can turn on or off the display of various price patterns such as Pin Bar, Outside Bar (Engulfing), Inside Bar, and PPR Bar.
Pattern Colors: Sets the colors for displaying each pattern on the chart.
Candle Color: Allows you to set a neutral color for candles that do not match the price action.
Show Lines: Allows you to turn on or off the display of labels and lines.
Line Length: Sets the length of the stop, entry, and take profit lines.
Label color: One color for all labels (configured below) or the color of the labels in the color of the candle pattern.
Pin entry: Select the entry point for the pin bar: candle head, bar close, or 50% of the candle.
Coefficients for stop and take lines.
Use trend for price action: When enabled, will show price action signals only in the direction of the trend.
Display trend cloud: Enables or disables the display of the trend cloud.
Cloud calculation period: Sets the period for which the maximum and minimum values for the cloud are calculated. The longer the period, the smoother the cloud will be.
Cloud colors: Sets the colors for uptrends and downtrends, as well as the transparency of the cloud.
The logic of the indicator:
Pin Bar is a candle with a long upper or lower shadow and a short body.
Logic: If the length of one shadow is twice the body and the opposite shadow of the candle, it is considered a Pin Bar.
An Inside Bar is a candle that is completely engulfed by the previous candle.
Logic: If the high and low of the current candle are inside the previous candle, it is an Inside Bar.
An Outside Bar or Engulfing is a candle that completely engulfs the previous candle.
Logic: If the high and low of the current candle are outside the previous candle and close outside the previous candle, it is an Outside Bar.
A PPR Bar is a candle that closes above or below the previous candle.
Logic: If the current candle closes above the high of the previous candle or below its low, it is a PPR Bar.
Stop Loss Levels: Calculated based on the specified ratios. If set to 1.0, it shows the correct stop for the pattern by pushing away from the entry point.
Take Profit Levels: Calculated based on the specified ratios.
Create a Label: The label is created at the stop loss level and contains information about the potential leverage and loss.
The formula for calculating the $ value is:
=(Total Capital x (Maximum Loss Percentage on Position/100)) / (Difference between Entry Level and Stop Loss Level × Ratio that sets the stop loss level relative to the length of the candlestick shadow × Fixed Leverage Value) .
Labels contain the following information:
The percentage of price change from the recommended entry point to the stop loss level.
Required Leverage (X: ): The amount of leverage required to achieve the specified loss percentage. (Or a fixed value if selected).
Required Capital ($: ): The amount of capital required to open a position with the specified leverage and loss percentage (only displayed when using fixed leverage).
The trend cloud identifies the maximum and minimum price values for the specified period.
The cloud value is set depending on whether the current price is equal to the high or low values.
If the current closing price is equal to the high value, the cloud is set at the low value, and vice versa.
RU
Индикатор "Price Action Trend and Margin Equity" представляет собой многофункциональный инструмент для анализа рынка, объединяющий в себе элементы управления капиталом и анализа ценовых паттернов. Индикатор помогает трейдерам идентифицировать ключевые прайс экшн паттерны и определять оптимальные уровни входа, выхода и стоп-лосс на основе текущего тренда.
Основные компоненты индикатора:
Управление капиталом:
Позволяет трейдеру задавать параметры управления рисками, такие как процент возможного убытка по позиции, использование фиксированного плеча и общий капитал.
Рассчитывает необходимый уровень плеча для достижения заданного процента убытка.
Price Action:
Правильно идентифицирует различные ценовые паттерны, такие как Pin Bar, Поглащение Бар, PPR Bar и Внутренний Бар.
Отображает эти паттерны на графике с возможностью настройки цветов свечей и стилей отображения.
Позволяет трейдеру настраивать точки тейк профита и стоп лосса для отображения их на графике.
Возможность отображения паттернов только в натправлении тренда.
Trend: (часть кода взята у ChartPrime)
Использует облако тренда для визуализации текущего направления рынка.
Облако тренда отображается на графике и помогает трейдерам определить, находится ли рынок в восходящем или нисходящем тренде.
Оповещение:
Дает возможность установить оповещение которое будет срабатывать при формировании паттерна.
Пример применения:
Предположим, трейдер использует индикатор для торговли на крипто рынке. Он настраивает параметры управления капиталом, устанавливая максимальный убыток по позиции в 5% и используя фиксированное плечо 1:100. Индикатор автоматически рассчитывает необходимый объем позиции для соблюдения этих параметров ($: на лейбле). Или отображает плечо (Х: на лейбле) для достижения необходимого риска.
Трейдер получает оповещение о формировании Pin Bar. Индикатор отображает уровни входа, выхода и стоп-лосс, основанные на этом паттерне. Трейдер открывает позицию на рекомендуемую сумму в направлении, указанном индикатором, и устанавливает стоп-лосс и тейк-профит на рекомендованных уровнях.
Общие настройки:
Процент убытка по позиции: Устанавливает максимальный процент убытка, который вы готовы понести по одной позиции.
Использовать фиксированное плечо: Включает или отключает использование фиксированного плеча.
Уровень фиксированного плеча: Задает уровень фиксированного плеча.
Общий капитал: Указывает общий капитал, который вы используете для торговли. (Необходим для расчета при использовании фиксированного плеча)
Включение/отключение паттернов: Вы можете включить или отключить отображение различных ценовых паттернов, таких как Pin Bar, Outside Bar (Поглощение), Inside Bar и PPR Bar.
Цвета паттернов: Задает цвета для отображения каждого паттерна на графике.
Цвет свечей: Позволяет задать нейтральный цвет для свечей неподходящих под прйс экшн.
Показывать линии: Позволяет включить или отключить отображение лейблов и линий.
Длинна линий: Настройка длинны линий стопа, линии входа и тейк профита.
Цвет лейбла: Один цвет для всех лейблов (настраивается ниже) или цвет лейблов в цвет паттерна свечи.
Вход в пин: Выбор точки входа для пин бара: голова свечи, точка закрытия бара или 50% свечи.
Коэффиценты для стоп и тейк линий.
Использовать тренд для прайс экшна: При включении будет показывать прайс экшн сигналы только в направлении тренда.
Отображение облака тренда: Включает или отключает отображение облака тренда.
Период расчета облака: Устанавливает период, за который рассчитываются максимальные и минимальные значения для облака. Чем больше период, тем более сглаженным будет облако.
Цвета облака: Задает цвета для восходящего и нисходящего трендов, а также прозрачность облака.
Логика работы индикатора:
Pin Bar — это свеча с длинной верхней или нижней тенью и коротким телом.
Логика: Если длина одной тени вдвое больше тела и противоположной тени свечи, считается, что это Pin Bar.
Inside Bar — это свеча, полностью поглощенная предыдущей свечой.
Логика: Если максимум и минимум текущей свечи находятся внутри предыдущей свечи, это Inside Bar.
Outside Bar или Поглощение — это свеча, которая полностью поглощает предыдущую свечу.
Логика: Если максимум и минимум текущей свечи выходят за пределы предыдущей свечи и закрывается за пределами предыдущей свечи, это Outside Bar.
PPR Bar — это свеча, которая закрывается выше или ниже предыдущей свечи.
Логика: Если текущая свеча закрывается выше максимума предыдущей свечи или ниже ее минимума, это PPR Bar.
Уровни стоп-лосс: Рассчитываются на основе заданных коэффициентов. При значении 1.0 показывает правильный стоп для паттерна отталкиваясь от точки входа.
Уровки тейк-профита: Рассчитываются на основе заданных коэффициентов.
Создание метки: Метка создается на уровне стоп-лосс и содержит информацию о потенциальном плече и убытке.
Формула для вычисления значения $:
=(Общий капитал x (Максимальный процент убытка по позиции/100)) / (Разница между уровнем входа и уровнем стоп-лосс × Коэффициент, задающий уровень стоп-лосс относительно длины тени свечи × Значение фиксированного плеча).
Метки содержат следующую информацию:
Процент изменения цены от рекомендованной точки входа до уровня стоп-лосс.
Необходимое плечо (Х: ): Уровень плеча, необходимый для достижения заданного процента убытка. (Или фиксированное значение если оно выбрано).
Необходимый капитал ($: ): Сумма капитала, необходимая для открытия позиции с заданным плечом и процентом убытка (отображается только при использовании фиксированного плеча).
Облако тренда определяет максимальные и минимальные значения цены за указанный период.
Значение облака устанавливается в зависимости от того, совпадает ли текущая цена с максимальными или минимальными значениями.
Если текущая цена закрытия равна максимальному значению, облако устанавливается на уровне минимального значения, и наоборот.
Scalping

Heikin-Ashi Trend ScalpHeikin-Ashi Trend Scalp is an indicator for TradingView, designed to identify short-term trends and entry points based on Heikin-Ashi candles and EMA crossovers.
Key Features:
Attention Signals: Early warning of potential entry points.
Buy/Sell Signals: Filtered signals based on the prevailing trend.
Filters (Slow Mode, Shadow Filter): Help reduce the number of false signals.
Shadow Filter: Eliminates false signals caused by shadows against the trend.
The warning bar should not have any shadow against the trend.
If the bar with the buy/sell signal has a shadow that crosses the opening level of the warning bar, the signal disappears.
Since the signal may disappear as the candle forms, entries should only be made after the signal has been confirmed.
It is not recommended to disable the Shadow Filter, as doing so may lead to an increase in false signals.
Slow Mode: Reduces false signals by using longer-term EMA crossovers. For timeframes of 1–5 minutes, it is recommended to use Slow Mode to reduce false signals.
EMA Lines (7, 21, 50): Displayed for trend determination. Depending on the selected mode: in standard mode, EMA 21 (fast) is shown, in Slow Mode, the longer-term EMA 50 (slow) is displayed.
Stop-Loss Price: Automatically set at the opening level of the candle two bars ago and displayed on the chart.
RSI: Displays the current value of the RSI indicator and visualizes it with color:
Red — for overbought conditions (above 70).
Green — for oversold conditions (below 30).
Yellow — for values in the neutral zone (between 30 and 70).
Alerts: Notifications for new signals in real-time.
The indicator is ideal for scalping and short-term trading, especially when used in conjunction with other technical analysis tools.

Sideways Scalper Peak and BottomUnderstanding the Indicator
This indicator is designed to identify potential peaks (tops) and bottoms (bottoms) within a market, which can be particularly useful in a sideways or range-bound market where price oscillates between support and resistance levels without a clear trend. Here's how it works:
RSI (Relative Strength Index): Measures the speed and change of price movements to identify overbought (above 70) and oversold (below 30) conditions. In a sideways market, RSI can help signal when the price might be due for a reversal within its range.
Moving Averages (MAs): The Fast MA and Slow MA provide a sense of the short-term and longer-term average price movements. In a sideways market, these can help confirm if the price is at the upper or lower extremes of its range.
Volume Spike: Looks for significant increases in trading volume, which might indicate a stronger move or a potential reversal point when combined with other conditions.
Divergence: RSI divergence occurs when the price makes a new high or low, but the RSI does not, suggesting momentum is weakening, which can be a precursor to a reversal.
How to Use in a Sideways Market
Identify the Range: First, visually identify the upper resistance and lower support levels of the sideways market on your chart. This indicator can help you spot these levels more precisely by signaling potential peaks and bottoms.
Peak Signal :
When to Look: When the price approaches the upper part of the range.
Conditions: The indicator will give a 'Peak' signal when:
RSI is over 70, indicating overbought conditions.
There's bearish divergence (price makes a higher high, but RSI doesn't).
Volume spikes, suggesting strong selling interest.
Price is above both Fast MA and Slow MA, indicating it's at a potentially high point in the range.
Action: This signal suggests that the price might be at or near the top of its range and could reverse downwards. A trader might consider selling or shorting here, expecting the price to move towards the lower part of the range.
Bottom Signal:
When to Look: When the price approaches the lower part of the range.
Conditions: The indicator will give a 'Bottom' signal when:
RSI is below 30, indicating oversold conditions.
There's bullish divergence (price makes a lower low, but RSI doesn't).
Volume spikes, suggesting strong buying interest.
Price is below both Fast MA and Slow MA, indicating it's at a potentially low point in the range.
Action: This signal suggests that the price might be at or near the bottom of its range and could reverse upwards. A trader might consider buying here, expecting the price to move towards the upper part of the range.
Confirmation: In a sideways market, false signals can occur due to the lack of a strong trend. Always look for confirmation:
Volume Confirmation: A significant volume spike can add confidence to the signal.
Price Action: Look for price action like candlestick patterns (e.g., doji, engulfing patterns) that confirm the reversal.
Time Frame: Consider using this indicator on multiple time frames. A signal on a shorter time frame (like 15m or 1h) might be confirmed by similar conditions on a longer time frame (4h or daily).
Risk Management: Since this is designed for scalping in a sideways market:
Set Tight Stop-Losses: Due to the quick nature of reversals in range-bound markets, place stop-losses close to your entry to minimize loss.
Take Profit Levels: Set profit targets near the opposite end of the range or use a trailing stop to capture as much of the move as possible before it reverses again.
Practice: Before trading with real money, practice with this indicator on historical data or in a paper trading environment to understand how it behaves in different sideways market scenarios.
Key Points for New Traders
Patience: Wait for all conditions to align before taking a trade. Sideways markets require patience as the price might hover around these levels for a while.
Not All Signals Are Equal: Sometimes, even with all conditions met, the market might not reverse immediately. Look for additional context or confirmation.
Continuous Learning: Understand that this indicator, like any tool, isn't foolproof. Learn from each trade, whether it's a win or a loss, and adjust your strategy accordingly.
By following these guidelines

AI Volume Breakout for scalpingPurpose of the Indicator
This script is designed for trading, specifically for scalping, which involves making numerous trades within a very short time frame to take advantage of small price movements. The indicator looks for volume breakouts, which are moments when trading volume significantly increases, potentially signaling the start of a new price movement.
Key Components:
Parameters:
Volume Threshold (volumeThreshold): Determines how much volume must increase from one bar to the next for it to be considered significant. Set at 4.0, meaning volume must quadruplicate for a breakout signal.
Price Change Threshold (priceChangeThreshold): Defines the minimum price change required for a breakout signal. Here, it's 1.5% of the bar's opening price.
SMA Length (smaLength): The period for the Simple Moving Average, which helps confirm the trend direction. Here, it's set to 20.
Cooldown Period (cooldownPeriod): Prevents signals from being too close together, set to 10 bars.
ATR Period (atrPeriod): The period for calculating Average True Range (ATR), used to measure market volatility.
Volatility Threshold (volatilityThreshold): If ATR divided by the close price exceeds this, the market is considered too volatile for trading according to this strategy.
Calculations:
SMA (Simple Moving Average): Used for trend confirmation. A bullish signal is more likely if the price is above this average.
ATR (Average True Range): Measures market volatility. Lower volatility (below the threshold) is preferred for this strategy.
Signal Generation:
The indicator checks if:
Volume has increased significantly (volumeDelta > 0 and volume / volume >= volumeThreshold).
There's enough price change (math.abs(priceDelta / open) >= priceChangeThreshold).
The market isn't too volatile (lowVolatility).
The trend supports the direction of the price change (trendUp for bullish, trendDown for bearish).
If all these conditions are met, it predicts:
1 (Bullish) if conditions suggest buying.
0 (Bearish) if conditions suggest selling.
Cooldown Mechanism:
After a signal, the script waits for a number of bars (cooldownPeriod) before considering another signal to avoid over-trading.
Visual Feedback:
Labels are placed on the chart:
Green label for bullish breakouts below the low price.
Red label for bearish breakouts above the high price.
How to Use:
Entry Points: Look for the labels on your chart to decide when to enter trades.
Risk Management: Since this is for scalping, ensure each trade has tight stop-losses to manage risk due to the quick, small movements.
Market Conditions: This strategy might work best in markets with consistent volume and price changes but not extreme volatility.
Caveats:
This isn't real AI; it's a heuristic based on volume and price. Actual AI would involve machine learning algorithms trained on historical data.
Always backtest any strategy, and consider how it behaves in different market conditions, not just the ones it was designed for.

Multi Stochastic AlertHello Everyone,
I have created a Multi Stochastic Alert based on Scalping Strategy
The Strategy uses below 4 Stochastic indicator:
1. Stochastic (9,3)
2. Stochastic (14,3)
3. Stochastic (40,4)
4. Stochastic (60,10)
Trade entry become active when all of these goes below 20 or above 80, In this indicator you don't need to use all 4, this will show red and green background whenever all of them goes below 20 or above 80.
As shown in picture below, it works better when script is making a channel, Our indicator shows green or red signal, we wait for RSI Divergence and we enter. We book when blue line (9,3) goes above 80, as shown by arrow, and trail rest at breakeven or your own trailing method
Same Situation shown for Short side. We book 50% when Blue line (9,3) Goes below 20 and trail rest at breakeven or your own trailing method
Happy trading, Let me know if any improvements required.

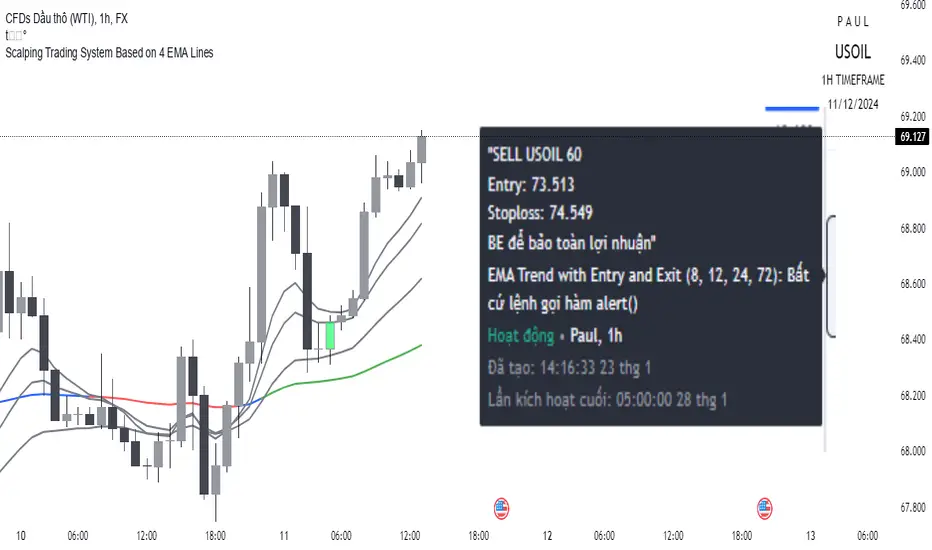
Scalping trading system based on 4 ema linesScalping Trading System Based on 4 EMA Lines
Overview:
This is a scalping trading strategy built on signals from 4 EMA moving averages: EMA(8), EMA(12), EMA(24) and EMA(72).
Conditions:
- Time frame: H1 (1 hour).
- Trading assets: Applicable to major currency pairs with high volatility
- Risk management: Use a maximum of 1-2% of capital for each transaction. The order holding time can be from a few hours to a few days, depending on the price fluctuation amplitude.
Trading rules:
Determine the main trend:
Uptrend: EMA(8), EMA(12) and EMA(24) are above EMA(72).
Downtrend: EMA(8), EMA(12) and EMA(24) are below EMA(72).
Trade in the direction of the main trend** (buy in an uptrend and sell in a downtrend).
Entry conditions:
- Only trade in a clearly trending market.
Uptrend:
- Wait for the price to correct to the EMA(24).
- Enter a buy order when the price closes above the EMA(24).
- Place a stop loss below the bottom of the EMA(24) candle that has just been swept.
Downtrend:
- Wait for the price to correct to the EMA(24).
- Enter a sell order when the price closes below the EMA(24).
- Place a stop loss above the top of the EMA(24) candle that has just been swept.
Take profit and order management:
- Take profit when the price moves 20 to 40 pips in the direction of the trade.
Use Trailing Stop to optimize profits instead of setting a fixed Take Profit.
Note:
- Do not trade within 30 minutes before and after the announcement of important economic news, as the price may fluctuate abnormally.
Additional filters:
To increase the success rate and reduce noise, this strategy uses additional conditions:
1. The price is calculated only when the candle closes (no repaint).
2. When sweeping through EMA(24), the price needs to close above EMA(24).
3. The closing price must be higher than 50% of the candle's length.
4. **The bottom of the candle sweeping through EMA(24) must be lower than the bottom of the previous candle (liquidity sweep).
---
Alert function:
When the EMA(24) sweep conditions are met, the system will trigger an alert if you have set it up.
- Entry point: The closing price of the candle sweeping through EMA(24).
- Stop Loss:
- Buy Order: Place at the bottom of the sweep candle.
- Sell Order: Place at the top of the sweep candle.
---
Note:
This strategy is designed to help traders identify profitable trading opportunities based on trends. However, no strategy is 100% guaranteed to be successful. Please test it thoroughly on a demo account before using it.
[COG] Advanced School Run StrategyAdvanced School Run Strategy (ASRS) – Explanation
Overview: The Advanced School Run Strategy (ASRS) is an intraday trading approach designed to identify breakout opportunities based on specific time and price patterns. This script applies the concepts of the Advanced School Run Strategy as outlined in Tom Hougaard's research, adapted to work seamlessly on TradingView charts. It leverages 5-minute candlestick data to set actionable breakout levels and provides traders with visual cues and alerts to make informed decisions.
Features:
Dynamic Breakout Levels: Automatically calculates high and low levels based on the market's behavior during the initial trading minutes.
Custom Visualization: Highlights breakout zones with customizable colors and transparency, providing clear visual feedback for bullish and bearish breakouts.
Configurable Alerts: Includes alert conditions for both bullish and bearish breakouts, ensuring traders never miss a trading opportunity.
Reset Logic: Resets breakout levels daily at the market open to ensure accurate signal generation for each session.
How It Works:
The script identifies key levels (high and low) after a configurable number of minutes from the market open (default: 25 minutes).
If the price breaks above the high level or below the low level, a corresponding breakout is detected.
The script draws breakout zones on the chart and triggers alerts based on the breakout direction.
All levels and signals reset at the start of each new trading session, maintaining relevance to current market conditions.
Customization Options:
Line and box colors for bullish and bearish breakouts.
Transparency levels for breakout visualizations.
Alert settings to receive notifications for detected breakouts.
Acknowledgment: This script is inspired by Tom Hougaard's Advanced School Run Strategy. The methodology has been translated into Pine Script for TradingView users, adhering to TradingView’s policies and community guidelines. This script does not redistribute proprietary content from the original research but implements the principles for educational and analytical purposes.

Scalping long-shortThe Scalping long-short indicator is a comprehensive system for analyzing candle patterns and trading volume, designed for use in a scalping strategy. The main purpose of the indicator is to identify the key points of changing market sentiment and provide the trader with accurate signals for entering a trade.
The main components of the indicator:
1. Candle Pattern Analysis:
The indicator analyzes four main candle patterns:
-A Bullish Hammer is a candle with a small body and a long lower tail, which indicates the possible completion of a downward movement and the beginning of an uptrend.
-Bearish Hanging Man is a candle similar to a bullish hammer, but it appears after an upward movement, signaling the possible beginning of a downtrend.
-Bullish Engulfing is a candle with a large body that completely covers the body of the previous candle, showing strong buyer interest.
-Bearish Engulfing is the reverse situation, when a large bearish candle absorbs the previous bullish candle, indicating the predominance of sellers.
-Doji is a candle with almost identical opening and closing prices, indicating market indecision.
For each of these patterns, the indicator sets certain threshold values that the user can adjust to their preferences and features of the trading instrument.
2. Volume analysis:
The volume is an important confirmation of the strength of the signal. The indicator compares the current volume with the average value for the user-selected period (length parameter) multiplied by the volumeMultiplier coefficient. If the current volume exceeds this indicator, the signal is considered confirmed.
3. Visual indication:
Graphical elements corresponding to each type of signal are displayed on the price chart.:
-The green triangle down is a buy signal (bullish hammer or bullish takeover).
-The red triangle up is a sell signal (bearish hanging or bearish engulfing).
-The yellow diamond is a neutral state (doji).
These visual cues help you quickly assess the current market situation without having to analyze each candle manually in depth.
4. Alerts:
The indicator supports setting alerts that can be sent via the TradingView platform or other supporting systems. This allows the trader to receive notifications about the occurrence of new signals even outside the workplace.
Settings:
The user can change the following settings:
-Length is the period for calculating the average volume.
-Multiplier is a multiplier for the thresholds of candle patterns.
-HammerThreshold, HangingManThreshold, EngulfingThreshold, DojiThreshold are Thresholds for recognizing specific candlestick patterns.
-VolumeMultiplier is a coefficient for comparing the current volume with the average value.
These parameters allow you to adapt the indicator to various trading instruments and time intervals, making it a universal tool for a wide range of traders.
Conclusion:
The Scalping long-short indicator combines powerful analytical tools to identify key points in the market, providing the trader with clear and timely signals for making trading decisions. Its flexibility and fine-tuning capability make it useful for both beginners and experienced market participants.

Bondar Drive v2.1Title: Bondar Drive v2.1 — Real-time print and delta tick volume visualization
Description:
Bondar Drive v2.1 is a tool for visualizing real-time order flow data. It highlights price movements and volume deltas in an intuitive, easy-to-read format. Indicator can be used in conjunction with the Anchored Volume Profile and Volume Footprint (Type: Total).
Features:
Real-Time Print Visualization:
Displays order flow prints with delta colors for buy/sell dominance.
Adjustable size and transparency for varying order thresholds.
Volume Delta Analysis:
Categorizes orders into Tiny, Small, Session, Large, and Huge based on user-defined thresholds.
Provides a tooltip showing order time and price.
Customizable Time Range:
Keeps prints visible for a specified duration (in seconds).
Flexible User Inputs:
Adjustable time zones, print sizes, starting bar index, and volume thresholds.
Visual Enhancements:
Line connections between prints show progression of orders and market direction.
How It Works:
The indicator gathers volume delta and price data in real time.
It dynamically displays circular labels with varying sizes and colors, reflecting the size and type of orders. Labels and lines are automatically removed after the specified time range, ensuring a clean and uncluttered chart.
Customization Options:
Number of Prints: Control how many prints are displayed.
Order Size Filters: Exclude small trades to highlight significant orders.
Color Options: Customize print colors, text, and connecting lines.
Time Offset: Adjust for your local time zone.
Use Cases:
Identify order flow imbalances and price levels dominated by buyers or sellers.
Track the progression of large orders for better trade execution.
Spot market reversals and momentum shifts using real-time prints and delta.

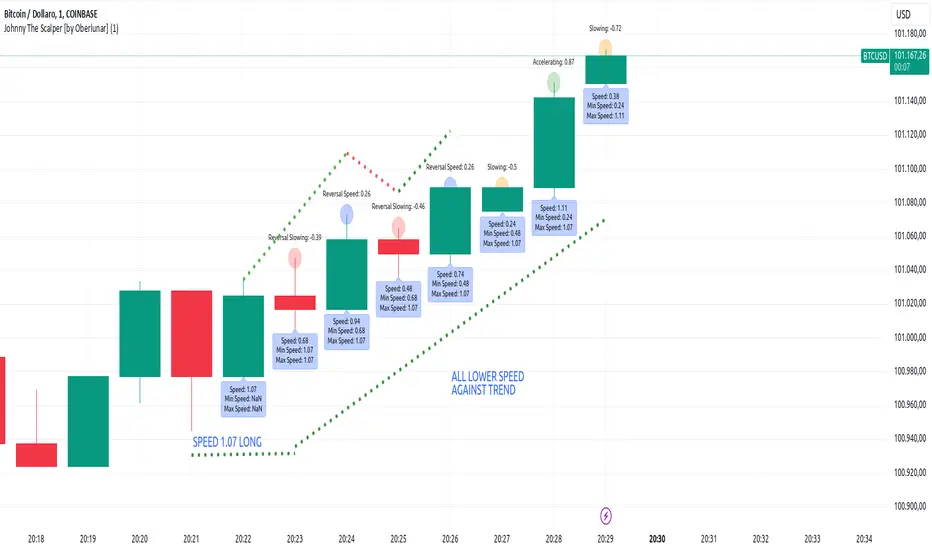
Johnny The Scalper - Momentum/Speed [by Oberlunar]The Johnny The Scalper indicator is designed to provide scalpers with insights into market momentum and speed dynamics by analyzing the price movement within candles. It calculates the "candle speed," defined as the range of a candle (high minus low) divided by the elapsed time in seconds since the candle opened. Users can customize the distance for comparison by specifying how many candles back the indicator should look when calculating the speed difference (`Diff`).
The script retrieves the speed of the specified candle from the past (`candle_speed_x`) and compares it to the speed of the current candle, calculating the difference (`speed_difference`). The indicator also identifies whether the current candle and the candle from the past are bullish (green) or bearish (red), using this information to interpret the dynamics of the difference.
If the difference is negative, it means the current candle's speed is slower than the reference candle's speed. A negative difference combined with candles of the same direction suggests a slowdown, while candles of opposite directions indicate a slowing reversal. A positive difference suggests that the current candle is faster. If the candles have the same direction, it signifies an acceleration in the current trend; if their directions differ, it indicates a faster reversal.
The results are displayed graphically as labels on the chart. Labels above the candles show the difference Diff with color-coded backgrounds based on the calculated dynamics:
orange for a slowdown in the same direction,
red for a slowing reversal,
green for acceleration in the same direction,
and blue for a faster reversal.
An additional label below the candle optionally displays the current candle's speed in real time. This indicator helps scalpers identify momentum shifts and potential reversals in a highly customizable manner, adapting to different trading strategies and timeframes.
EMA SCALPING SUITE v1.0 [1M-5M]EMA SCALPING SUITE v1.0
A scalping indicator designed for quick entries on lower timeframes, combining EMA
stacks with volume confirmation and automatic risk management levels.
CORE FEATURES:
1. EMA Stack System:
- 50 EMA (Blue): Fastest trend
- 100 EMA (Yellow): Entry trigger line
- 150 EMA (Orange): Stop loss reference
- 200 EMA (Red): Base trend
2. Entry System:
- LONG: When price dips to 100 EMA during bullish fan
- SHORT: When price rises to 100 EMA during bearish fan
- Signals shown as triangles at entry points
3. Risk Management:
- Auto Stop Loss: 150 EMA (red line)
- Auto Take Profit: Based on RR ratio (green line)
- Entry Price Marker: Current close (blue line)
4. Volume Confirmation:
- High volume dots (>1.5x average)
- Filters out weak signals
- Adjustable sensitivity
HOW IT WORKS:
1. Wait for EMAs to fan out (trend alignment)
2. Look for price to touch 100 EMA
3. Check for volume confirmation
4. Enter when signal appears
5. Use auto-generated SL and TP levels
BEST TIMEFRAMES:
- Primary: 1 minute
- Secondary: 3-5 minutes
- Not recommended: >15 minutes
RECOMMENDED SETTINGS:
- Volume Filter: ON
- Volume Multiplier: 1.5
- Risk:Reward: 1.5

TechniTrendMasterIntroducing "TechniTrendMaster"
The TechniTrendMaster indicator is designed to bring clarity and depth to your trading strategy. This indicator combines robust trend analysis with volume insights, giving you a comprehensive view of the market’s pulse. Let's break down the features.
🔵 Analysis Mode
TechniTrendMaster's Analysis Mode provides various configurations tailored to specific market behaviors. Here are the options you can utilize:
🔹Strong Movements: Focuses on powerful market shifts, ideal for capturing major trend changes and high-momentum moves. Perfect for identifying strong breakout opportunities.
🔹Reversal: Detects potential turning points in the market, signaling when a trend might be about to change direction, allowing for well-timed entries and exits.
🔹Consolidations: Spots periods of low volatility where the market moves sideways, helping you avoid trading traps and anticipate breakout scenarios.
🔹Momentum-Driven: Prioritizes momentum in the market, identifying when the force behind price movement is accelerating or decelerating.
🔹Balanced: Offers a well-rounded view of the market by weighing both trend direction and volume equally, making it suitable for stable market conditions.
🔹Volatility Adapted: Adjusts to periods of increased or decreased volatility, providing accurate signals regardless of market conditions.
🔹Trend Confirmation: Confirms the strength and sustainability of a trend, allowing traders to enter trades with higher confidence.
🔹Short-Term Scalping: Tailored for traders who focus on Short-Term and Scalp trades, offering rapid insights for intraday or short-term trading strategies.
🔵 Trend Analysis Mode
The Trend Analysis Mode allows you to customize how trends are detected and analyzed:
🔹Default: A balanced mode for general use, offering reliable trend identification across different market conditions.
🔹Aggressive: A more sensitive setting that reacts quickly to market changes, ideal for traders looking to capitalize on smaller, quicker movements.
🔹Conservative: Takes a cautious approach, favoring long-term stability over short-term fluctuations, perfect for risk-averse traders.
🔹Volatility Aware: Focuses on adapting to volatility shifts, giving accurate trend signals even in erratic markets.
🔹Range Bound: Targets horizontal price movements and channel trades, helping traders take advantage of well-defined ranges.
🔵 Divergence
Divergence is a powerful tool within TechniTrendMaster, highlighting discrepancies between price movement and underlying volume. These differences can indicate potential reversals or trend continuations before they are visible on price charts alone.
🔵 Hidden Divergence
Hidden divergence is a subtle yet crucial signal that reveals when an existing trend might resume after a temporary correction. This mode provides early detection of trend continuity opportunities, giving traders a significant advantage in timing.
🔵 Divergence Mode
TechniTrendMaster includes different divergence detection settings to suit your analysis style:
🔹Standard: Captures typical divergence patterns for general analysis.
🔹Short-Term Focused: Concentrates on short-lived divergences, offering rapid detection of shifts for active traders.
🔹Long-Term Analysis: Highlights divergence in a broader context, which is better for understanding the overall market direction.
🔹High Sensitivity: Prioritizes capturing even the smallest shifts in the market, making it excellent for high-frequency trading or volatile environments.
🔹Low Sensitivity: Reduces market noise, only reacting to more significant changes in trend or volume. It’s perfect for traders who seek higher accuracy with fewer false signals.
🔵 Dynamic Channel
TechniTrendMaster features a Dynamic Channel, that automatically adapts to market conditions. This channel provides a visual guide to price action, adjusting in real-time based on current trends and volatility. It identifies key support and resistance zones, making it easier to spot breakouts, trend continuations, or potential reversals.
🔵 Volume Integration
Volume is a critical part of TechniTrendMaster, offering deeper insights beyond just price movement. By analyzing volume patterns alongside trends, the indicator highlights the strength and reliability of market shifts. This integration ensures that traders can distinguish between genuine movements backed by solid volume and weak trends that might not hold.
🔵 A Solution for All Trading Styles
TechniTrendMaster’s strength lies in its versatility. No matter your trading approach—be it scalping, swing trading, trend following, or range trading—this indicator adapts to your needs. Here's how it caters to different trader profiles:
🔹Scalpers get precise, quick-response insights through the Short-Term Scalping and High Sensitivity settings, helping them capture minute price movements.
🔹Swing Traders benefit from modes like Reversal, Balanced, and Momentum-Driven, which focus on identifying trends and shifts that occur over several days.
🔹Long-Term Investors will find the Conservative, Low Sensitivity, and Long-Term Analysis modes ideal for filtering noise and sticking to broader market trends.
🔹Volatility Traders can rely on the Volatility Adapted and Volatility Aware options to get accurate signals even during unpredictable periods.
🔓 Unlock Access :
Check out the Author's Instructions or Dm me to Unlock the Access.

Dynamic Buy/Sell VisualizationDynamic Trend Visualization Indicator
Description:
This simple and easy to use indicator has helped me stay in trades longer.
This indicator is designed to visually represent potential buy and sell signals based on the crossover of two Simple Moving Averages (SMA). It's crafted to assist traders in identifying trend directions in a straightforward manner, making it an excellent tool for both beginners and experienced traders.
Features:
Customizable Moving Averages: Users can adjust the period length for both short-term (default: 10) and long-term (default: 50) SMAs to suit their trading strategy.
Visual Signals: Dynamic lines appear at the points of SMA crossover, with labels to indicate 'BUY' or 'SELL' opportunities.
Color and Style Customization: Customize the appearance of the buy and sell lines for better chart readability.
Alert Functionality: Alerts are set up to notify users when a crossover indicating a buy or sell condition occurs.
How It Works:
A 'BUY' signal is generated when the short-term SMA crosses above the long-term SMA, suggesting an upward trend.
A 'SELL' signal is indicated when the short-term SMA crosses below the long-term SMA, pointing to a potential downward trend.
Use Cases:
Trend Following: Ideal for markets with clear trends. For example, if trading EUR/USD on a daily chart, setting the short SMA to 10 days and the long SMA to 50 days might help in capturing longer-term trends.
Scalping: In a volatile market, setting shorter periods (e.g., 5 for short SMA and 20 for long SMA) might catch quicker trend changes, suitable for scalping.
Examples of how to use
* Short-term for Quick Trades:
SMA 5 and SMA 21:
Purpose: This combination is tailored for day traders or those looking to engage in scalping. The 5 SMA will react rapidly to price changes, providing early signals for buy or sell opportunities. The 21 SMA, being a Fibonacci number, offers a slightly longer-term view to confirm the short-term trend, helping to filter out minor fluctuations that might lead to false signals.
* Middle-term for Swing Trading:
SMA 10 and SMA 50:
Purpose: Suited for swing traders who aim to capitalize on medium-term trends. The 10 SMA picks up on immediate market movements, while the 50 SMA gives insight into the medium-term direction. This setup helps in identifying when a short-term trend aligns with a longer-term trend, providing a good balance for trades that might last several days to a couple of weeks.
* Long-term Trading:
SMA 50 and SMA 200:
Purpose: Investors focusing on long-term trends would benefit from this pair. The crossover of the 50 SMA over the 200 SMA can indicate the beginning or end of major market trends, ideal for making decisions about long-term holdings that might span months or years.
Example Strategy if not using the Buy / Sell Label Alerts:
Entry Signal: Enter a long position when the shorter SMA crosses above the longer SMA. For example:
SMA 10 crosses above SMA 50 for a medium-term bullish signal.
Exit Signal: Consider exiting or initiating a short position when:
SMA 10 crosses below SMA 50, suggesting a bearish turn in the medium-term trend.
Confirmation: Use these crossovers in conjunction with other indicators like volume or momentum indicators for better confirmation. For instance, if you're using the 5/21 combination, look for volume spikes on crossovers to confirm the move's strength.
When Not to Use:
Sideways or Range-Bound Markets: The indicator might generate many false signals in a non-trending market, leading to potential losses.
High Volatility Without Clear Trends: Rapid price movements without a consistent direction can result in misleading crossovers.
As a Standalone Tool: It should not be used in isolation. Combining with other indicators like RSI or MACD for confirmation can enhance trading decisions.
Practical Example:
Buy Signal: If you're watching Apple Inc. (AAPL) on a weekly chart, a crossover where the 10-week SMA moves above the 50-week SMA could suggest a buying opportunity, especially if confirmed by volume increase or other technical indicators.
Sell Signal: Conversely, if the 10-week SMA dips below the 50-week SMA, it might be time to consider selling, particularly if other bearish signals are present.
Conclusion:
The "Dynamic Trend Visualization" indicator provides a visual aid for trend-following strategies, offering customization and alert features to streamline the trading process. However, it's crucial to use this in conjunction with other analysis methods to mitigate the risks of false signals or market anomalies.
Legal Disclaimer:
This indicator is for educational purposes only. It does not guarantee profits or provide investment advice. Trading involves risk; please conduct thorough or consult with a financial advisor. The creator is not responsible for any losses incurred. By using this indicator, you agree to these terms.

FibLevel Size CalculatorThis skript calculates position sizes and new take profits for sizing into an long or short position with 3 entrys defined at custom fibonacci retracement levels.
TP: -0,272
Entry1: 0.382
Entry2: 0.618
Entry3: 0.83
SL: 1.05
Expected RR per trade is 0.2 with a High Win rate definitly profitable.
Search for an established trend on the higher timeframe, drop to the smaller ones and look for correction waves. Once they break to the trenddirection of the higher timeframe take the fib from lowest to highes point. Draw a fib level on the chart and use the Indicator to define these Levels above. The calculator gives you the Margin to use in each position, and will check that you will not get liquidated an that you have enough margin. It tells you the new TP for Limit2 and Limit3 if they get hit so you can get out of the trade full TP with a small bounce.
Inputs:
Account Balance, Risk Percentage, and Leverage: These inputs are used to calculate the position size and risk.
Entry 1, Entry 2, Entry 3, Take Profit (TP), and Stop Loss (SL): These prices are used for calculating position sizes, risk, and profit for up to three entry points.
Calculations:
Risk Amount: Calculated based on the account balance and risk percentage.
Position Sizes (Qty): For each entry point, the position size is determined. The second and third entries have a multiplier (3x for Entry 2, 5x for Entry 3) compared to the first.
Stop Loss and Profit Calculation: The script calculates the potential profit and adjusts the TP levels based on the average entries for Limit 2 and Limit 3.
Margin Calculation: Margin requirements for each position are calculated based on leverage.
Output:
Table Display: A table shows key values like entry prices, position sizes, TP levels, potential profit, and margin requirements for each limit.
Warnings: It includes a liquidation warning and a check for whether the account is at risk of liquidation based on leverage.
Position Type: It automatically detects if the trade is a long or short based on the relationship between TP and SL.
Visualization:
Lines: It draws horizontal lines on the chart to visually represent the entry, TP, and SL levels.
Overall, this script is designed to help traders manage risk and calculate position sizes for multi-level entries using leverage.
Pls drop feedback in the comments.

[BRAIN] Absolute Volatility of Price
Hello traders!
Today I want to share with you a series of scripts and strategies that I developed a few years ago. This is one of my first works, born from the curiosity of seeing a candlestick representation in a different way, without considering the price movement along the y-axis.
Imagine observing the price movement in dollars and percentages, always starting from the same reference point: the 0 axis. This approach can offer new insights and ideas on how and how much prices move.
To explain it better, the open of each candle does not start from the previous close negotiations but always starts from the 0 axis . In this way, it is possible to clearly compare the bodies of the candles with each other.
Script Visualization Methods and Input
- Study Normal: Simply reports the prices, including the negative ones of the red candles, on the same scale in absolute terms (ABS), as shown in the first indicator above.
- Study Normal Neg: In this version, the red candles vary negatively below zero, instead of in absolute terms above zero, as shown in the second indicator above.
- Study Perc: Similar to "Study Normal" but uses percentage values instead of dollars, useful for very low timeframes and low variations with many decimals, such as 1 minute on EUR/USD.
- Study Perc Neg: Similar to "Study Normal Neg" but uses percentage values.
Additionally, I have added the possibility to display or not, through two buttons, an average of the candle bodies adjustable in length via input and the range of each candle, always correlated in dollars or percentages, as per the main study setting.
I hope this work can be useful to many of you. I invite you to like if you appreciate my scripts and want to see more like these. Do not hesitate to comment or contact me for any doubts or questions.
PS: If you notice that in the script the sum of the percentage values between the shadow and the body of the candle does not correspond to the range, it is only a rounding issue. Change the precision setting to a lower value and you will see that the rounding disappears.
PS: In the script, to better visualize the percentage growth and decline of the instrument on very high timeframes, I decided to represent it as follows:
- If close ≥ open: (high - low) / low * 100
- If close < open: (high - low) / high * 100
The same method is also applied for calculating the percentage variations of the shadows relative to themselves.
I hope you like this version! If you need any further modifications or adjustments, let me know. Good luck with your project!
(In the photos below I show 3 versions of the indicator open on 3 different tickers as an example: from top to bottom in the 3 indicators are set these Study: Study Normal, Study Perc and Study Perc Neg)

First Candle High Low LevelsDescription
The "First Candle High Low Levels" Pine Script indicator is designed to highlight the high and low levels of the first candle of the day on your TradingView chart. It works across different timeframes and specifically handles the Indian stock market trading hours (9:15 AM to 3:30 PM IST). The script draws a box from the start to the end of the trading session, visually marking the price range defined by the first candle of the day. Traders can customize the box's border color, fill color, and line width.
Features
Customizable Timeframe: Users can select the desired timeframe for the first candle (e.g., 5-minute, 15-minute, etc.).
Custom Box Appearance: Options to adjust the border color, fill color, and line width of the drawn box.
Auto Reset for Each New Day: The high and low of the first candle are reset daily to mark the start of the next trading day.
Accurate Market Session Handling: The box is drawn from the start of the first candle to the end of the trading session (3:30 PM IST).
Usage
Adding to Chart: Apply the script by copying it into the Pine Script editor in TradingView. Once added, the script will automatically draw a box representing the high and low of the first candle of the day.
Select Timeframe: You can adjust the First Candle Timeframe input to define which timeframe candle will be used for marking the high and low. For example, if you choose a 5-minute timeframe, the high and low of the first 5-minute candle will be used.
Customization:
Adjust the Border Color and Box Fill Color through the input settings to match your chart's style.
Modify the Box Line Width to make the box lines more or less prominent.

Thrax - QuickStrike 5-Mins Scalping** Indicator Description **
1. Price Change Threshold (%) – The minimum price change required for a candle to be recognized as significant. Candles exceeding this threshold are considered potential candidates for zone creation. Default value for 5 min is 0.5%. As you move on higher timeframe the threshold should increase
2. Percentage Change for Zones (%) – The amount of price movement needed to form a dynamic support or resistance zone. Tweak this to control how sensitive the indicator is to price fluctuations. 5 min default value is 1%. For 15 min suggested is 2-3%.
3. Break Threshold for Zones (%) – Defines how much price must break above or below a zone for it to be removed from the chart/mitigated. Keeps the chart clean by removing invalidated zones. Default value is 0.1% in 5 min, for 15 min it is 0.5%.
4. Buy Zone Retracement Level (%) – The percentage retracement level for defining the inner buy zone within a broader bullish zone. Ideal for timing precision entries. Ideal value is 75%
5. Sell Zone Retracement Level (%) – The percentage retracement level used to determine the inner sell zone within a larger bearish zone. Helps in identifying potential reversal areas or exits. Ideal value is 25%
By tailoring these inputs, traders can fully customize the indicator to suit their scalping strategies, enhancing their ability to navigate fast-moving markets with confidence.
---------------------------------------------------------------------------
There are two primary approaches for scalping using this indicator:
1. Candle-Based Scalping:
a. Bullish Signal: When you observe a bullish candle highlighted in blue (by default), you can consider entering a long position at the close of this candle. It’s advisable to wait for the candle to close before taking action. For a more aggressive scalp, you might take profits based on your scalp target after a few subsequent candles. If the price remains stagnant or moves unfavorably in the next few candles, you can exit with a small loss. Alternatively, if you have a higher risk tolerance, you may hold the position even if the price initially declines within a set percentage.
b. Bearish Signal: For a bearish candle highlighted in yellow, you can enter a short trade at the close of the candle. Similar to the bullish setup, you have the option to exit after a few candles if the price doesn’t move as expected or hold the position with a higher risk tolerance if the price goes up initially.
2. Zone-Based Scalping:
Entering Zones: Monitor the price as it enters a defined support or resistance zone. If you are open to higher risk, you can enter a trade immediately upon the price entering the zone. For a more cautious approach with a smaller stop loss, wait for the price to reach a retracement level within the zone before initiating your trade. This approach allows for a more precise entry but may result in missing out on trades if the price reverses before hitting the retracement level. Conversely, entering at the zone’s boundary offers the potential for early trade capture but comes with a higher stop loss risk.
Adjust these strategies based on your risk tolerance and trading preferences to optimize your scalping opportunities.

Heikin Ashi Price DetectionThis script performs custom calculations for both bullish and bearish bars, providing a numerical result that can be used to gauge price movements and potential trading signals.
How It Works
Bullish Bars:
Calculates the absolute difference between the open and low prices (BullOpenLow).
Calculates the absolute difference between the high and close prices (BullHighClose).
Compares BullOpenLow and BullHighClose:
If BullOpenLow is greater, the difference is divided by BullOpenLow.
If BullHighClose is greater, the difference is divided by BullHighClose.
The result is normalized to a percentage and subtracted from 100 to produce a final value.
Bearish Bars:
Calculates the absolute difference between the close and low prices (BearCloseLow).
Calculates the absolute difference between the high and open prices (BearHighOpen).
Compares BearCloseLow and BearHighOpen:
If BearCloseLow is greater, the difference is divided by BearCloseLow.
If BearHighOpen is greater, the difference is divided by BearHighOpen.
The result is normalized to a percentage and subtracted from 100 to produce a final value.
Key Features
Bullish and Bearish Calculations: The script identifies bullish and bearish bars and applies separate calculations to each.
Normalized Results: The calculations provide a normalized result that can be easily interpreted.
Visual Representation: Results are plotted on the chart for quick visual reference.

Buy-Sell Volume Bar Gauge [By MUQWISHI]▋ INTRODUCTION :
The Buy-Sell Volume Bar Gauge is developed to provide traders with a detailed analysis of volume in bars using a low timeframe, such as a 1-second interval, to measure the dominance of buy and sell for each bar. By highlighting the balance between buying and selling activities, the Buy-Sell Volume Bar Gauge helps traders identify potential volume momentum of a bar; aimed at being a useful tool for day traders and scalpers.
_______________________
▋ OVERVIEW:
_______________________
▋ METHODOLOGY:
The concept is based on bars from a lower timeframe within the current chart timeframe bar, where volume is categorized into Up, Down, and Neutral Volume, with each one displayed as a portion of a column plot. Up Volume is recorded when the price experiences a positive change, Down Volume occurs when the price experiences a negative change, and Neutral Volume is observed when the price shows no significant change.
_______________________
▋ INDICATOR SETTINGS:
(1) Fetch data from the selected lower timeframe. Note: If the selected timeframe is invalid (higher than chart), the indicator will automatically switch to 1 second.
(2) Price Source.
(3) Treating Neutral Data (Price Source) as
Neutral: In a lower timeframe, when the bar has no change in its price, the volume is counted as Neutral Volume.
Previous Move: In a lower timeframe, when the bar has no change in its price, the volume is counted as the previous change; “Up Volume” if the previous change was positive, and “Down Volume” if the previous change was negative.
Opposite Previous Move: In a lower timeframe, when the bar has no change in its price, the volume is counted as the opposite previous change; “Up Volume” if the previous change was negative, and “Down Volume” if the previous change was positive.
(4) Average Volume Length, it's used for lighting/darkening columns in a plot.
(5) Enable Alert.
(7) Total bought (%) Level.
(8) Total Sold (%) Level.
_____________________
▋ COMMENT:
The Buy-Sell Volume Bar Gauge can be taken as confirmation for predicting the next move, but it should not be considered a major factor in making a trading decision.

Sniper BreakoutThis indicator is based on 3 indicator :=
1) Forex Market Session 2) Ema 200 3) Volume
This indicator is for Forex market ..in Forex market (ex- Eur/Usd ) price often (67%) do rotation in every session means example :let suppose a trade take trade in asian session and have 30 pips stop loss 67 % chance price will come back to entry price after London session or New York session so trade have less chance to make trade without hitting stop loss
in this indicator we are using Forex market session indicator to get session range start to end ..this indicator will only search opportunity in London And New York Session range and that can be customize from input section . user can select time zone and time of session from input section indicator and color of session .
next indicator using 200 length Exponential Moving Average for trend identification .if close price is above 200 Ema means trend is upside moving & if close price is below 200 Ema means price is moving downside .user can change length and source of Ema from input section .
Third and most important part is volume indicator when a session start (Example-London session it keep Look back 6 previous candle and compare volume imbalance between look back candle .look back candle can be customize from input section default look back candle input is (6).
next we are using trade range time to only show trade on certain time because often market convert into trading range so given specific input time it only take trade when volume and price is rising or falling .time range can be selected from input section .
Trade Entry Buy Signal -if price is either London or New York session and price is above 200 Ema and volume not in imbalance last number of candle it give Feb (first entry buy ) we keep save high price of every candle after Feb (label ) signal .if any candle break above Feb label it show a confirm buy signal ..Below in example as we can see
Example Image Buy Signal -
in this above example step -1 we searching imbalance of volume and price as we can see imbalance of volume and price on green candle .next we look price is above 200 ema .next step(2) we got Feb (first entry buy ) signal this is not a confirm buy signal .we save high of candle next candle high close above previous candle high we got confirm buy signal .
Trade Entry Sell Signal - if price is either London or New York session and price is below 200 Ema and volume not in imbalance last number of candle it give Feb (first entry Sell ) we keep save low price of every candle after Fes (label ) signal .if any candle break below Fes label it show a confirm sell signal ..Below in example as we can see
step-1 starting of london session we start getting imbalance between price and volume .price is getting rejected but volume is rising on green candle we got fes (first entry sell signal ).next we save low of fes candle but price close above that low of candle we dont get confirm sell entry next price break below low of previous candle so open a new sell signal ..
Example 3 - No Confirm buy/sell Signal
In this above Image example we did not get any confirm signal...we got first entry buy signal but price did not close high of candle in london session .so that day chance price can go any side ..
Example 4 -Feb signal and later confirm buy entry
in this above example we got imbalance of volume and feb(first entry buy signal) but we dont get any confirm buy signal price is just going high then previous candle ..later we see price crossover high of previous candle we got confirm buy signal
Use Of Indicator - This indicator helps traders identify potential trade setups by signaling the first entry points and confirming them later. It's particularly useful for avoiding getting caught in price rotations and aligning trades with significant volume and price movements. Traders should analyze price action and news before confirming a trade.

BINANCE-BYBIT Cross Chart: Spot-Perpetual CorrelationName: "Binance-Bybit Cross Chart: Spot-Perpetual Correlation"
Category: Scalping, Trend Analysis
Timeframe: 1M, 5M, 30M, 1D (depending on the specific technique)
Technical analysis: This indicator facilitates a comparison between the price movements shown on the Binance spot chart and the Bybit perpetual chart, with the aim of discerning the correlation between the two charts and identifying the dominant market trends. It automatically generates the corresponding chart based on the ticker selected in the primary chart. When a Binance pair is selected in the main chart, the indicator replicates the Bybit perpetual chart for the same pair and timeframe, and vice versa, selecting the Bybit perpetual chart as the primary chart generates the Binance spot chart.
Suggested use: You can utilize this tool to conduct altcoin trading on Binance or Bybit, facilitating the comparison of price actions and real-time monitoring of trigger point sensitivity across both exchanges. We recommend prioritizing the Binance Spot chart in the main panel due to its typically longer historical data availability compared to Bybit.
The primary objective is to efficiently and automatically manage the following three aspects:
- Data history analysis for higher timeframes, leveraging the extensive historical data of the Binance spot market. Variations in indicators such as slow moving averages may arise due to differences in historical data between exchanges.
- Assessment of coin liquidity on both exchanges by observing candlestick consistency on smaller timeframes or the absence of gaps. In the crypto market, clean charts devoid of gaps indicate dominance and offer enhanced reliability.
- Identification of precise trigger point levels, including daily, previous day, or previous week highs and lows, which serve as sensitive areas for breakout or reversal operations.
All-Time High (ATH) and All-Time Low (ATL) levels may vary significantly across exchanges due to disparities in historical data series.
This tool empowers traders to make informed decisions by leveraging historical data, liquidity insights, and precise trigger point identification across Binance Spot and Bybit Perpetual market.
Configuration:
EMA length:
- EMA 1: Default 5, user configurable
- EMA 2: Default 10, user configurable
- EMA 3: Default 60, user configurable
- EMA 4: Default 223, user configurable
- Additional Average: Optional display of an additional average, such as a 20-period average.
Chart Elements:
- Session separator: Indicates the beginning of the current session (in blue)
- Background: Indicates an uptrend (60 > 223) with a green background and a downtrend (60 < 223) with a red background.
Instruments:
- EMA Daily: Shows daily averages on an intraday timeframe.
- EMA levels 1h - 30m: Shows the levels of the 1g-30m EMAs.
- EMA Levels Highest TF: Provides the option to select additional EMA levels from the major timeframes, customizable via the drop-down menu.
- "Hammer Detector: Marks hammers with a green triangle and inverted hammers with a red triangle on the chart
- "Azzeramento" signal on TF > 30m: Indicates a small candlestick on the EMA after a dump.
- "No Fomo" signal on TF < 30m: Indicates a hyperextended movement.
Trigger Points:
- Today's highs and lows: Shows the opening price of the day's candlestick, along with the day's highs and lows (high in purple, low in red, open in green).
- Yesterday's highs and lows: Displays the opening price of the daily candlestick, along with the previous day's highs and lows (high in yellow, low in red).
You can customize the colors in "Settings" > "Style".
It is best used with the Scalping The Bull indicator on the main panel.
Credits:
@tumiza999: for tests and suggestions.
Thanks for your attention, happy to support the TradingView community.

[AlbaTherium] MTF External Ranges Analysis - ERA-Orion for SMC MTF External Ranges Analysis - ERA - Orion for Smart Money Concepts
Introduction:
The MTF External Ranges Analysis - ERA - Orion offers enhanced insights into multi-timeframe external structure points, swing structure points, POIs (Points of Interest), and order blocks (OB) . By incorporating this enhancement, your multi-timeframe analysis are streamlined, simplifying the process and reducing chart workload, no need for manual chart drawing anymore, stay focus on Low Time Frame and get High Time Frame insights in one single Time frame.
This identification process remains effective even when focusing on Lower Time Frames (LTF), providing detailed insights without sacrificing the broader market perspective.
The MTF External Ranges Analysis - ERA – Orion is specifically designed to be used in conjunction with OptiStruct™ Premium for Smart Money Concepts . This strategic combination enhances the workflow of identifying optimal entry points. OptiStruct acts as the analysis tool for Lower Time Frames (LTF), zeroing in on immediate interest areas, while Orion expands this analysis to Higher Time Frames (HTF), providing a broader view of market trends and importants key levels . The integration of Orion with OptiStruct seamlessly merges LTF and HTF analyses, ensuring a thorough understanding of market dynamics for informed and strategic decision-making. This toolkit in one package assembly is pivotal for traders relying on Smart Money Concepts, offering unmatched clarity and actionable insights to navigate the markets effectively.
This tool offers an advanced smart money technical analysis to improve your trading experience. It introduces four key concepts:
Main Features:
Entries Enhancements
Inducements HTF
High/Low Markings HTF
Multiple Timeframes and Confluences on Extreme, Dec and SMT Order Blocks
By integrating these concepts into one, traders can identify high-probability zones across multiple timeframes and develop a thorough understanding of market dynamics. These confluence zones enhance order block skills and potential, establishing them as essential pillars in smart money trading strategies and enabling traders to make more informed decisions.
Settings Overview:
HTF Settings Enable HTF Analysis
Select timeframe {Select or 4H Chart}
Labels Alignment for Lines and Boxes
Inside bar ranges HTF
Break of Structure /Change of Character HTF
Inducements HTF
High/Low Markings HTF
High/Low Sweeps HTF
Extreme Order Blocks HTF
Decisional Order Blocks HTF
Smart Money Traps HTF
IDM Demands and Supplies HTF
Historical Order Blocks HTF
OB Mitigation HTF {touch/ extended}
Understanding the Features:
Chapter 1: Entries Enhancements
In this chapter, we delve into strategies to refine trading entries, focusing on the multi-timeframe analysis of extreme or decisional order blocks in the High Time Frame timeframe as a key point of interest. We highlight the significance of transitioning to the Low Time Frame chart for observing pivotal shifts in market behavior. By examining these concepts, traders can gain deeper insights into market dynamics and make more informed entries decisions at critical junctures.
Practical Example:
We had an Order Block Extreme on the 1-hour timeframe, and currently, we are on the recommended chart for trade entry, which is the 5-minute timeframe. We are patiently waiting to observe a 5-minute ChoCh in the market to enter a buying position since it's an OB Extreme Demand on the 1-hour timeframe. Here, it's crucial and important to focus on the entry timeframe rather than checking what's happening in the higher timeframe. The indicator facilitates this task as it provides us with real-time perspective and visibility of everything happening in the higher timeframe.
Chapter 2: Inducements HTF
It is important and useful to be aware of the various liquidity points across the different timeframes we use; sometimes, a reliable entry point in the Lower Time Frame (LTF) may be surrounded by inducements. Consequently, this point becomes unreliable, and prior to the arrival of this functionality, such anomalies could not be detected, especially when focusing on the market in the LTF. From now on, there will be no more such issues.
Practical Example:
Suppose we identify an Order Block Extreme on the 5M timeframe, indicating a potential entry level. However, when we switch to the 5M timeframe to look for an entry point, we observe an accumulation of inducements around this Order Block coming from a higher timeframe, whether it's M15 or H1. This suggests a potential weakness in the entry point and significant market liquidity, which will act as a trap zone. Before the introduction of this feature, we might have missed this crucial observation, but now we can detect these anomalies and adjust our strategy accordingly.
The only practical way to see theses confluences is to use this Indicator, see the example below
Chapter 03: High/Low – Bos - ChoCh Markings HTF
The High/Low Markings HTF feature in the MTF External Ranges Analysis - ERA - Orion provides a comprehensive view into the market's heartbeat across different timeframes, right from within the convenience of the Lower Time Frame (LTF). It meticulously highlights pivotal shifts, allowing traders to seamlessly discern market sentiment and anticipate potential price reversals without needing to toggle between multiple charts. This innovation ensures that critical market movements and sentiment across various timeframes are visible and actionable from a single, focused LTF perspective, enhancing decision-making and strategic planning in trading activities.
Understanding High/Low Markings in HTF Analysis
High/Low Markings in High Time Frame (HTF) analysis mark the market's extremities within a given period, pinpointing potential areas for reversals or continuation and delineating crucial support and resistance levels. These markings are not arbitrary but represent significant market responses, serving as essential indicators for traders and analysts to gauge market momentum and sentiment.
The Role of HTF in Market Analysis
HTF analysis extends a comprehensive view over market movements, distinguishing between ephemeral fluctuations and substantial trend shifts. By scrutinizing these high and low points across wider time frames, analysts can unravel the underlying market momentum, enabling more strategic, informed trading decisions.
Identifying High/Low Markings
Identifying these crucial points entails detailed chart analysis over extended durations—daily, weekly, or monthly. The search focuses on the utmost highs and lows within these periods, which are more than mere points on a chart. They are significant market levels that have historically elicited robust market reactions, serving as key indicators for future market behavior.
Real-world Example:
Chapter 04: Multiple Timeframes and Confluences on Extreme, Dec and SMT Order Blocks Across HTF
The Orion indicator serves as a bridge between the multiple dimensions of the market, enabling a unified and strategic interpretation of potential movements. It's an indispensable tool for those seeking to capitalize on major opportunity zones, where the convergence of diverse perspectives creates ideal conditions for significant market movements.
Designed to navigate through the data of different timeframes and market analysis, Orion provides a clear and consolidated view of major points of interest. With this indicator, traders can not only spot opportunity zones where consensus is strongest but also adjust their strategies based on the dynamic interaction of various market participants, all while remaining within the Lower Time Frame (LTF).
Conclusion:
MTF External Ranges Analysis - ERA - Orion for Smart Money Concepts as “ The Orion ” indicator captures consensus among scalpers, day traders , swing traders, and investors, turning key areas into major opportunities. It allows for precise identification of areas of interest by analyzing the convergence of actions from various market participants. In short, Orion is crucial for detecting and leveraging the most promising points of convergence in the market.
This identification occurs even while focusing on Lower Time Frames (LTF), allowing for detailed insights without losing the broader market perspective.
This document provides an extensive overview of MTF External Ranges Analysis - ERA - Orion , emphasizing its importance in comprehending market dynamics and utilizing essential smart money concepts trading principles.

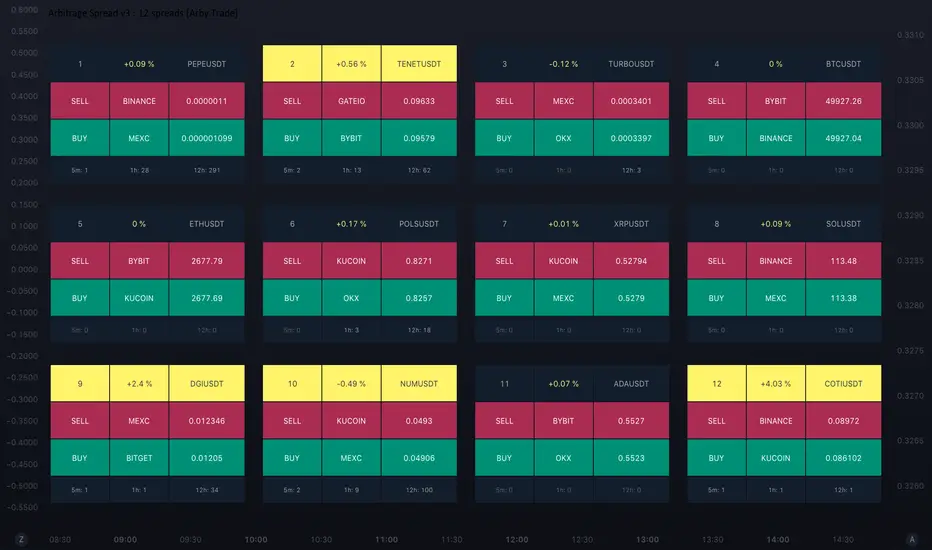
Arbitrage Spread v3 : 12 spreads dashboard [Arby.Trade]This indicator allows you to track in real time the change in the spread (the difference in the exchange rate) between two assets simultaneously for 12 trading pairs.
⚙️ How does the indicator work?
In the indicator settings menu, the user selects two trading pairs, for example BTCUSDT on the Binance exchange and BTCUSDT on the Bybit exchange, after which the script will receive prices from both exchanges and compare them with each other, calculating the percentage deviation between prices (spread). The script will do this work with all 12 trading pairs added to the script settings menu. The script can only work with those assets and exchanges that are on board TradingView, and this is not a small thing.
⚡️ How to use it?
At times when the spread value is negative, this means that the price of the asset on the first exchange is less than on the second. That is, by buying an asset on the first exchange and selling it on the second one, you can earn money (of course, it is important to take into account the commissions of the exchanges for these transactions). When the spread is above zero, the opposite is true. The exchanges and the prices at which to buy are displayed in the green Buy row. Prices and exchanges for sale are in the Sell row and highlighted in red. When the spread is zero, the prices on both exchanges are the same and there is no arbitrage situation.
To improve the accuracy of the indicator, try to use the minimum timeframe available for your TradingView subscription – minute or second.
🕒 Counter of arbitration situations
For each trading pair, the table below the Buy row shows the number of arbitrage situations that have been on the asset for a certain period of time. In this case, an arbitrage situation is understood as the moment when the spread value exceeded the Signal Threshold Level set by the user. Each time the spread value of the Signal Threshold Level is exceeded, the counter will add one. The counter takes into account only those arbitrage situations that were on the market during the time period back from the current moment. For example, for a 1-hour period (1h) of the counter, the number of arbitration situations for the last hour will be displayed. For each asset you can simultaneously track the number of arbitrage situations during three selected time periods from 5 minutes to a day.
The counter will allow you to evaluate the prospects of arbitrage of selected trading pairs. For example, if the number of arbitrage situations on a trading pair was 1-2 within an hour, then it is obvious that it is better not to waste time waiting for another such situation on this pair and look for the next one.
🔔 Setting up Alerts
In the script settings, you can set the threshold value of the spread – Spread Signal Threshold. When this level is reached, the table related to the asset whose spread has reached this level will be highlighted. Also, this level is a signal level for setting up alerts from the indicator.
To set up alerts, open the Alerts tab in the TradingView menu on the right. Click the "Create Alert" button. Then, in the window that opens, select this indicator in the "Condition" line. After that, you can set a name for this alert and complete the notification setup by clicking the "Create" button.
We, the authors of this script, have been engaged in cryptocurrency arbitrage for a long time and, first of all, created it for ourselves and our daily arbitrage trading, but this does not prevent you from using it at your discretion for any types of assets and in any markets.
We have a lighter version of the indicator that allows you to track the spread for only one trading pair or three at the same time. In these versions you can also view the chart of the spread itself, which can be useful for assessing the nature of the spread movement in the history. If this indicator seems too heavy for you and your device, you can use these lighter versions:
🧩 Arbitrage Spread v1 : 1 pair + 1 chart
🧩 Arbitrage Spread v2 : 3 pairs + 3 charts
If, on the contrary, the capabilities of your hardware allow, do not forget that you can always add several indicators to your screen – for example, use the version with 12 pairs as a dashboard with many pairs, and in addition to it one of the versions with a spread chart and look at a more detailed picture of one or three instruments separately.
--
Данный индикатор позволяет отслеживать в реальном времени изменение спреда (разницы в курсе) между двумя активами одновременно для 12 торговых пар.
⚙️ Как устроен индикатор?
В меню настроек индикатора пользователь выбирает две торговые пары, например BTCUSDT на бирже Binance и BTCUSDT на бирже Bybit, после чего скрипт получит цены с обеих бирж и сравнит их между собой, рассчитав процентное отклонение между ценами (спред). Такую работу скрипт проделает со всеми 12 торговыми парами добавленными в меню настроек скрипта. Скрипт может работать только с теми активами и биржами, которые есть на борту TradingView, и это не мало.
⚡️ Как пользоваться?
В моменты, когда значение спреда отрицательное, это означает, что цена на актив на первой бирже меньше, чем на второй. То есть, купив актив на первой бирже и продав его на второй можно заработать (конечно при этом важно учитывать комиссии бирж на совершение данных сделок). Когда спред выше нуля - наоборот. Биржи и цены, по которым надо покупать отображаются в зеленой строке Buy. Цены и биржи для продажи – в строке Sell и выделены красным цветом. Когда спред равен нулю – цены на обеих биржах одинаковы и арбитражная ситуация отсутствует.
Для повышения точности работы индикатора старайтесь использовать минимально доступный для вашей подписки TradingView таймфрейм – минутный или секундный.
🕒 Счетчик арбитражных ситуаций
По каждой торговой паре в таблице под строкой Buy отображается количество арбитражных ситуаций, которые были на инструменте в течение определенного промежутка времени. В данном случае под арбитражной ситуацией понимается момент, когда значение спреда превысило установленный пользователем сигнальный уровень спреда Signal Threshold Level. При каждом превышении значения спреда уровня Signal Threshold Level счетчик будет прибавлять единицу. Счетчик учитывает только те арбитражные ситуации, которые были на рынке в течение временного периода назад от текущего момента. К примеру, для 1-часового периода (1h) счетчика будет отображаться количество арбитражных ситуаций за последний час. По каждому инструменту одновременно можно отслеживать количество арбитражных ситуаций в течение трех выбранных временных периода от 5 минут до суток.
Счетчик позволит оценить перспективность арбитража выбранных торговых пар. К примеру, если количество арбитражных ситуаций на торговой паре в течение часа было 1-2, то очевидно, что лучше не тратить время на ожидание очередной такой ситуации на данной паре и поискать следующую.
🔔 Настройка оповещений
В настройках скрипта можно настроить пороговое значение спреда – Spread Signal Threshold. При достижении этого уровня будет подсвечена таблица относящаяся к активу, спред которого достиг этого уровня. Так же, этот уровень является сигнальным для настройки оповещений от индикатора.
Для настройки оповещений откройте вкладку «Оповещения» в меню TradingView справа. Нажмите кнопку «Создать оповещение». Затем в открывшемся окне в строке «Условие» выберете данный индикатор. После чего вы можете задать название данному оповещению и завершить настройку оповещения, нажав кнопку «Создать».
Мы, авторы данного скрипта, давно занимаемся арбитражем криптовалюты и, в первую очередь, создавали его для себя и своей каждодневной арбитражной торговли, но это не мешает вам использовать его по своему усмотрению для любых видов активов и на любых рынках.
У нас есть более легкая версия индикатора, позволяющая отслеживать спред только по одной торговой паре или одновременно по трем. В этих версиях также можно просматривать график самого спреда, что может быть полезным для оценки характера движения спреда в истории. Если данный индикатор покажется для вас и вашего устройства слишком тяжелым вы можете воспользоваться этими более легкими версиями:
🧩 Arbitrage Spread v1 : 1 pair + 1 chart
🧩 Arbitrage Spread v2 : 3 pairs + 3 charts
Если, наоборот, возможности вашего железа позволяют, не забывайте, что вы всегда можете добавить себе на экран несколько индикаторов – например, версию с 12 парами использовать как дашборд с множеством пар, а в дополнение к ней одну из версий с графиком спреда и смотреть более детальную картину по одному или трем инструментам отдельно.