10 in 1 Different Moving Averages ( SMA/EMA/WMA/RMA )This indicator is a combination of different types of moving averages where you can select which kind of moving average you want according to your need.
It consists of 10 moving averages none of which is fixed by default, you can change the properties of any MA according to your will.
I hope you all will like it.
Cerca negli script per "中海油+10年股价涨幅"

[5F] Aggregated Volume Spot BTC 10 Exchanges-══════════════════════════════-
10 exchanges aggregated spot volume of Bitcoin.
You can choose which exchanges to display.
Each color characterizes an exchange.
Sorry for my bad english
Note : The list of exchanges in the infopanel is always the same, even if you disable exchanges. If I have the time, I will try to fix this.
Here are the listed exchanges :
- Okex
- Huobi
- Binance
- Bitfinex
- Bitstamp
- Coinbase
- FTX
- Kraken
- Gemini
- Phemex
Thanks to all Pinecoders who share their work with the community.
-══════════════════════════════-


Moving Averages (10, 55, 100 EMAs, 200 SMA close)10, 55, 100 EMAs, 200 SMA close. Increasing line stroke, standard colors.

SPX +10 / -10 From 9:30 Open//@version=5
indicator("SPX +10 / -10 From 9:30 Open", overlay=true)
// Exchange Time (New York)
sess = input.session("0930-1600", "Regular Session (ET)")
// Detect session and 9:30 AM bar
inSession = time(timeframe.period, sess)
// Capture the 9:30 AM open
var float open930 = na
if inSession
// If this is the first bar of the session (9:30 AM)
if time(timeframe.period, sess) == na
open930 := open
else
open930 := na
// Calculate movement from 9:30 AM open
up10 = close >= open930 + 10
dn10 = close <= open930 - 10
// Plot reference lines
plot(open930, "9:30 AM Open", color=color.orange)
plot(open930 + 10, "+10 Level", color=color.green)
plot(open930 - 10, "-10 Level", color=color.red)
// Alert conditions
alertcondition(up10, title="SPX Up +10", message="SPX moved UP +10 from the 9:30 AM open")
alertcondition(dn10, title="SPX Down -10", message="SPX moved DOWN -10 from the 9:30 AM open")
// Plot signals on chart
plotshape(up10, title="+10 Hit", style=shape.labelup, color=color.green, text="+10", location=location.belowbar, size=size.tiny)
plotshape(dn10, title="-10 Hit", style=shape.labeldown, color=color.red, text="-10", location=location.abovebar, size=size.tiny)

FVG 9:31–10:00 AM ETFVG 9:31–10:00 AM ET - Script Description
What This Script Does
This indicator finds **Fair Value Gaps (FVGs)** that form during the first 29 minutes of the U.S. stock market (9:31 AM to 10:00 AM Eastern Time). A Fair Value Gap is a price imbalance where there's a gap between candles that often becomes an important support or resistance level.
Key Features:
- **Time Window**: Only looks for FVGs between 9:31-10:00 AM ET (most important opening period)
- **One Per Day**: Finds only the first FVG that forms in this time window each day
- **Visual Display**: Draws a purple box around the gap with a clear "FVG" label
- **Price Tracking**: Monitors when price comes back to test the gap level
- **Alert System**: Sends notifications when price returns to the FVG zone
How FVGs Are Detected:
- **Bullish FVG**: When there's a gap up (low of middle candle is above high of 3rd candle back)
- **Bearish FVG**: When there's a gap down (high of middle candle is below low of 3rd candle back)
The 9:31-10:00 AM window is chosen because this is when institutions and algorithms create their biggest price moves right after market open, making these gaps very reliable.
Customization Options
User Settings
Extend FVG Box (Bars)
- **What it does**: Makes the purple box longer to the right
- **Default**: 0 (box ends right after the gap forms)
- **Options**: Any number from 0 to 100+
- **When to use**:
- Keep at 0 for clean historical view
- Set to 10-20 to track the gap during the current session
- Set higher for longer reference
Code Settings (Can Be Changed)
Time Window
- **Start**: 9:31 AM Eastern Time
- **End**: 10:00 AM Eastern Time
- **Can modify**: Change the hour/minute numbers in the code
Visual Style
- **Color**: Purple with see-through background
- **Label**: Shows "FVG" text in white
- **Can modify**: Change colors and transparency in the code
How to Use:
Setup
Chart Settings
1. Use 1-minute, 5-minute, or 15-minute charts (works best on these timeframes)
2. Apply to liquid markets like ES, NQ, major stocks, or forex pairs
3. Set the "Extend FVG Box" to your preference (start with 0 or 10)
What You'll See
- A purple box appears when an FVG forms during 9:31-10:00 AM
- Box shows the exact price levels of the gap
- "FVG" label appears on the box
- Only one FVG per day will be marked
Trading Strategies
Basic FVG Trading
1. **Wait for Formation**: Let the purple box appear during 9:31-10:00 AM
2. **Watch Price Movement**: See if price moves away from the gap
3. **Enter on Retest**: When price comes back to the purple box area, consider entering
4. **Trade Direction**:
- Bullish FVG = look for long opportunities when price retests
- Bearish FVG = look for short opportunities when price retests
Entry Methods
- **Bounce Play**: Enter when price touches the FVG box and bounces away
- **Break Play**: Enter if price strongly breaks through the FVG box
- **Rejection Play**: Enter opposite direction if price gets rejected at the FVG
Risk Management
Stop Losses
- Place stops just outside the FVG box (a few ticks beyond the gap)
- If trading a bounce, stop goes on opposite side of the gap
- If trading a break, stop goes back inside the gap
Position Sizing
- Start small until you understand how FVGs work in your market
- Bigger gaps = smaller position size (more risk)
- Smaller gaps = can use larger position size
Profit Targets
- Take profits at obvious levels like round numbers, previous highs/lows
- Consider taking half profits at 1:1 risk/reward ratio
- Let some position run if the move is strong
Best Practices
When It Works Best
- High-volume stocks and futures (ES, NQ work great)
- Normal market days without major news during the 9:31-10:00 window
- When there's clear institutional activity in the opening period
When to Be Careful
- Low-volume stocks or markets
- Major economic news releases during the time window
- Market holidays when volume is low
- Very choppy or sideways days
Alert Usage
- The script will alert you when price comes back to test the FVG
- Don't trade the alert blindly - always check the current market situation
- Use the alert as a heads-up to start watching the setup more closely
Tips for Success
- The earlier the FVG forms in the 9:31-10:00 window, often the more significant it is
- FVGs that form with high volume are usually more reliable
- Always consider the overall market direction - don't fight the main trend
- Practice on paper first to understand how FVGs behave in your chosen market
🔗 Works Best With:
✅ Liquidity Levels — Smart Swing Lows: Spot key structural lows that can fuel stop hunts and reversals.
✅ ICT Turtle Soup — Liquidity Reversal: Add a classic reversal pattern to your toolkit to catch fakeouts cleanly.
✅ ICT SMC Liquidity Grabs and OBs- Liquidity Grabs, Order Block Zones, and Fibonacci OTE Levels, allowing traders to identify institutional entry models with clean, rule-based visual signals.
This script is most valuable for day traders who want to catch institutional moves right after market open, but it can also help swing traders identify important intraday levels.
✅ ICT Macro Zones (Grey Box Version)- It tracks real-time highs and lows for each Silver Bullet session.
✅ Weekly Opening Gap (cryptonnnite)

Yearly History Calendar-Aligned Price up to 10 Years)Overview
This indicator helps traders compare historical price patterns from the past 10 calendar years with the current price action. It overlays translucent lines (polylines) for each year’s price data on the same calendar dates, providing a visual reference for recurring trends. A dynamic table at the top of the chart summarizes the active years, their price sources, and history retention settings.
Key Features
Historical Projections
Displays price data from the last 10 years (e.g., January 5, 2023 vs. January 5, 2024).
Price Source Selection
Choose from Open, Low, High, Close, or HL2 ((High + Low)/2) for historical alignment.
The selected source is shown in the legend table.
Bulk Control Toggles
Show All Years : Display all 10 years simultaneously.
Keep History for All : Preserve historical lines on year transitions.
Hide History for All : Automatically delete old lines to update with current data.
Individual Year Settings
Toggle visibility for each year (-1 to -10) independently.
Customize color and line width for each year.
Control whether to keep or delete historical lines for specific years.
Visual Alignment Aids
Vertical lines mark yearly transitions for reference.
Polylines are semi-transparent for clarity.
Dynamic Legend Table
Shows active years, their price sources, and history status (On/Off).
Updates automatically when settings change.
How to Use
Configure Settings
Projection Years : Select how many years to display (1–10).
Price Source : Choose Open, Low, High, Close, or HL2 for historical alignment.
History Precision : Set granularity (Daily, 60m, or 15m).
Daily (D) is recommended for long-term analysis (covers 10 years).
60m/15m provides finer precision but may only cover 1–3 years due to data limits.
Adjust Visibility & History
Show Year -X : Enable/disable specific years for comparison.
Keep History for Year -X : Choose whether to retain historical lines or delete them on new year transitions.
Bulk Controls
Show All Years : Display all 10 years at once (overrides individual toggles).
Keep History for All / Hide History for All : Globally enable/disable history retention for all years.
Customize Appearance
Line Width : Adjust polyline thickness for better visibility.
Colors : Assign unique colors to each year for easy identification.
Interpret the Legend Table
The table shows:
Year : Label (e.g., "Year -1").
Source : The selected price type (e.g., "Close", "HL2").
Keep History : Indicates whether lines are preserved (On) or deleted (Off).
Tips for Optimal Use
Use Daily Timeframes for Long-Term Analysis :
Daily (1D) allows 10+ years of data. Smaller timeframes (60m/15m) may have limited historical coverage.
Compare Recurring Patterns :
Look for overlaps between historical polylines and current price to identify potential support/resistance levels.
Customize Colors & Widths :
Use contrasting colors for years you want to highlight. Adjust line widths to avoid clutter.
Leverage Global Toggles :
Enable Show All Years for a quick overview. Use Keep History for All to maintain continuity across transitions.
Example Workflow
Set Up :
Select Projection Years = 5.
Choose Price Source = Close.
Set History Precision = 1D for long-term data.
Customize :
Enable Show Year -1 to Show Year -5.
Assign distinct colors to each year.
Disable Keep History for All to ensure lines update on year transitions.
Analyze :
Observe how the 2023 close prices align with 2024’s price action.
Use vertical lines to identify yearly boundaries.
Common Questions
Why are some years missing?
Ensure the chart has sufficient historical data (e.g., daily charts cover 10 years, 60m/15m may only cover 1–3 years).
How do I update the data?
Adjust the Price Source or toggle years/history settings. The legend table updates automatically.

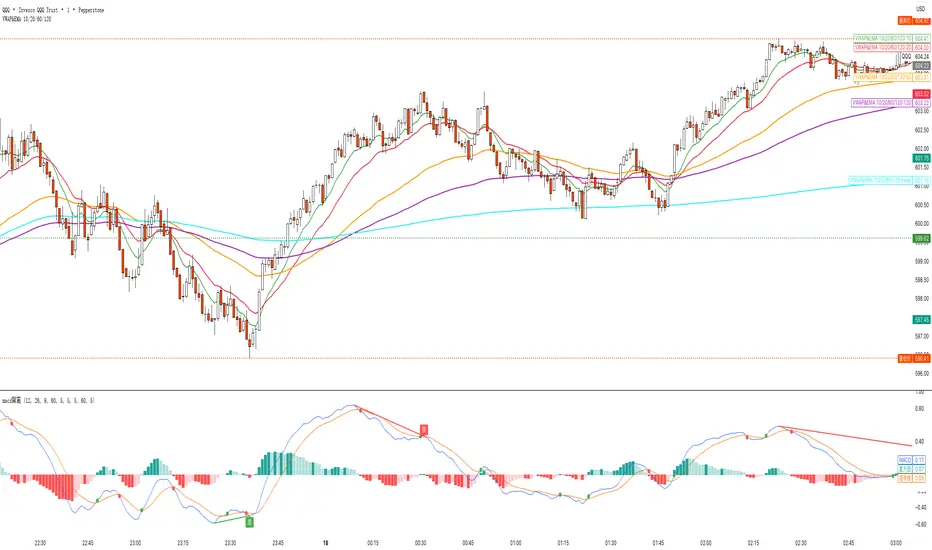
VWAP&EMA 10/20/60/120his script is a clean and straightforward technical analysis tool designed to provide traders with a clear view of market trends and key price levels by overlaying five essential moving averages onto your chart:
Volume Weighted Average Price (VWAP)
Four (4) Exponential Moving Averages (EMAs) at lengths 10, 20, 60, and 120.
By combining these indicators, traders can quickly assess short-term momentum, medium-term trends, and long-term direction, all while referencing the volume-weighted average price as a key benchmark for institutional activity.
Features & Components
This indicator plots five distinct lines on your chart, each color-coded for easy identification:
VWAP (Volume Weighted Average Price)
Plot: Plotted as a bright blue line.
Purpose: The VWAP represents the true average price of an asset for the day (or session), weighted by volume. It is a critical level for many day traders and institutions.
Prices above VWAP are often considered bullish.
Prices below VWAP are often considered bearish.
It frequently acts as a dynamic level of support or resistance.
EMA 10 (Short-Term Momentum)
Plot: Plotted as a green line.
Purpose: This is the fastest-moving average, reflecting the most recent price action and short-term momentum.
EMA 20 (Short-Term Trend)
Plot: Plotted as a red line.
Purpose: Often used in conjunction with the EMA 10, this average helps confirm the immediate trend. Crossovers between the 10 and 20 EMAs can signal potential entry or exit points.
EMA 60 (Medium-Term Trend)
Plot: Plotted as an orange line.
Purpose: This average provides a clearer picture of the medium-term trend, filtering out much of the short-term noise. It often serves as a significant dynamic support or resistance level.
EMA 120 (Long-Term Trend)
Plot: Plotted as a purple line.
Purpose: This is the slowest-moving average in the script, defining the major underlying trend. As long as the price remains above the EMA 120, the long-term bias is generally considered bullish, and vice-versa.
How to Use This Indicator
This indicator is versatile and can be adapted to various trading strategies:
Trend Confirmation: Use the alignment of the EMAs to determine the trend.
Strong Bullish Trend: Price > EMA 10 > EMA 20 > EMA 60 > EMA 120.
Strong Bearish Trend: Price < EMA 10 < EMA 20 < EMA 60 < EMA 120.
Dynamic Support & Resistance: Watch how the price reacts to each of the five lines. In an uptrend, the EMAs and VWAP will often act as "bounces" or support levels for pullbacks. In a downtrend, they will act as resistance.
Entry & Exit Signals (Crossovers):
A bullish crossover (e.g., EMA 10 crossing above EMA 20) can signal buying interest.
A bearish crossover (e.g., EMA 10 crossing below EMA 20) can signal selling pressure.
VWAP Confluence: Pay special attention to areas where an EMA (like the 20 or 60) crosses or travels close to the VWAP. This "confluence" can create a very strong and significant price level. For example, if the price pulls back to the VWAP and also finds support at the EMA 60, it can be a high-probability trade setup.
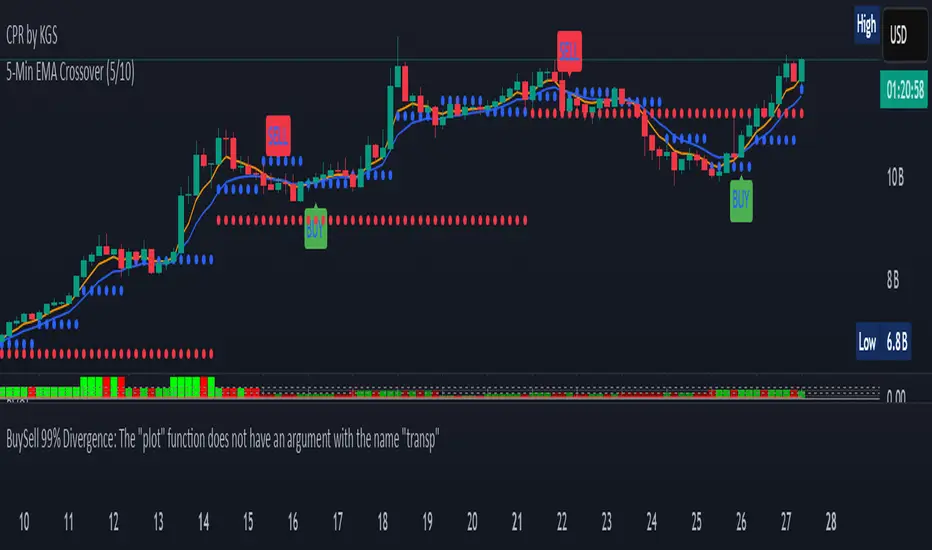
5-Min EMA Crossover (5/10)The 5-Minute EMA Crossover (5/10) strategy is a technical trading approach that uses two Exponential Moving Averages (EMAs) on a 5-minute chart to identify potential buy and sell signals based on trend shifts. Here's a description:
EMAs Used:
Fast EMA: 5-period EMA calculated on 5-minute candles. This EMA reacts quickly to recent price changes since it gives more weight to the latest data.
Slow EMA: 10-period EMA calculated on 5-minute candles. It responds more slowly, smoothing out short-term fluctuations.
How the Crossover Works:
A buy signal (long entry) occurs when the 5-period EMA crosses above the 10-period EMA. This suggests that recent price momentum is gaining strength upward, potentially indicating a bullish trend beginning or resuming.
A sell signal (short entry) happens when the 5-period EMA crosses below the 10-period EMA, signaling weakening recent price momentum and a possible bearish trend.
Purpose:
This crossover method helps traders catch short-term trends on a 5-minute timeframe by signaling moments when momentum shifts.
Because EMAs weight recent prices more heavily, the signals tend to be more responsive to fast market moves compared to simple moving averages.
Typical Usage:
Traders apply this to intraday charts (5-minute candles) looking for quick entries and exits.
It is common to use this crossover in combination with other indicators or price action context to reduce false signals.
Example of Signal Application:
When the 5 EMA crosses above the 10 EMA, consider entering a long position.
When the 5 EMA crosses below the 10 EMA, consider exiting longs or entering shorts.
This method leverages short-term momentum shifts visible on the 5-minute timeframe to help take advantage of intraday trends or reversals.
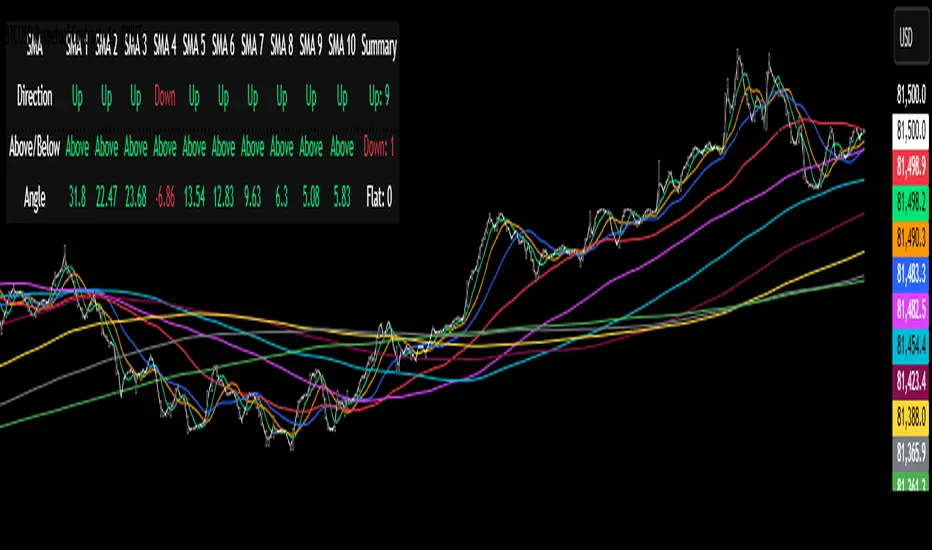
Multi-SMA Dashboard (10 SMAs)Description:
This script, "Multi-SMA Dashboard (10 SMAs)," creates a dashboard on a TradingView chart to analyze ten Simple Moving Averages (SMAs) of varying lengths. It overlays the chart and displays a table with each SMA’s direction, price position relative to the SMA, and angle of movement, providing a comprehensive trend overview.
How It Works:
1. **Inputs**: Users define lengths for 10 SMAs (default: 5, 10, 20, 50, 100, 150, 200, 250, 300, 350), select a price source (default: close), and customize table appearance and options like angle units (degrees/radians) and debug plots.
2. **SMA Calculation**: Computes 10 SMAs using the `ta.sma()` function with user-specified lengths and price source.
3. **Direction Determination**: The `sma_direction()` function checks each SMA’s trend:
- "Up" if current SMA > previous SMA.
- "Down" if current SMA < previous SMA.
- "Flat" if equal (no strength distinction).
4. **Price Position**: Compares the price source to each SMA, labeling it "Above" or "Below."
5. **Angle Calculation**: Tracks the most recent direction change point for each SMA and calculates its angle (atan of price change over time) in degrees or radians, based on the `showInRadians` toggle.
6. **Table Display**: A 12-column table shows:
- Columns 1-10: SMA name, direction (Up/Down/Flat), Above/Below status, and angle.
- Column 11: Summary of Up, Down, and Flat counts.
- Colors reflect direction (lime for Up/Above, red for Down/Below, white for Flat).
7. **Debug Option**: Optionally plots all SMAs and price for visual verification when `debug_plots_toggle` is enabled.
Indicators Used:
- Simple Moving Averages (SMAs): 10 user-configurable SMAs ranging from short-term (e.g., 5) to long-term (e.g., 350) periods.
The script runs continuously, updating the table on each bar, and overlays the chart to assist traders in assessing multi-timeframe trend direction and momentum without cluttering the view unless debug mode is active.
Wick Size in USD with 10-Bar AverageWick Size in USD with 10-Bar Average
Version: 1.0
Author: QCodeTrader
🔍 Overview
This indicator converts the price wicks of your candlestick chart into USD values based on ticks, providing both raw and smoothed data via a 10-bar simple moving average. It helps traders visualize the monetary impact of price extremes, making it easier to assess volatility, potential risk, and plan appropriate stop loss levels.
⚙️ Key Features
Tick-Based Calculation:
Converts wick sizes into ticks (using a fixed tick size of 0.01, typical for stocks) and then into USD using a customizable tick value.
10-Bar Moving Average:
Smooths out the wick values over the last 10 bars, giving you a clearer view of average wick behavior.
Bullish/Bearish Visual Cues:
The chart background automatically highlights bullish candles in green and bearish candles in red for quick visual assessment.
Stop Loss Optimization:
The indicator highlights long wick sizes, which can help you set more accurate stop loss levels. Even when the price moves in your favor, long wicks may indicate potential reversals—allowing you to account for this risk when planning your stop losses.
User-Friendly Customization:
Easily adjust the USD value per tick through the settings to tailor the indicator to your specific instrument.
📊 How It Works
Wick Calculation:
The indicator calculates the upper and lower wicks by measuring the distance between the candle’s high/low and its body (open/close).
Conversion to Ticks & USD:
These wick sizes are first converted from price points to ticks (dividing by a fixed tick size of 0.01) and then multiplied by the user-defined tick value to convert the measurement into USD.
Smoothing Data:
A 10-bar simple moving average is computed for both the upper and lower wick values, providing smoothed data that helps identify trends and deviations.
Visual Representation:
Columns display the raw wick sizes in USD.
Lines indicate the 10-bar moving averages.
Background Color shifts between green (bullish) and red (bearish) based on candle type.
⚡ How to Use
Add the Indicator:
Apply it to your chart to begin visualizing wick sizes in monetary terms.
Customize Settings:
Adjust the Tick Value in USD in the settings to match your instrument’s tick value.
(Note: The tick size is fixed at 0.01, which is standard for many stocks.)
Optimize Your Stop Loss:
Analyze the raw and averaged wick values to understand volatility. Long wicks—even when the price moves in your favor—may indicate potential reversals. This insight can help you set more accurate stop loss levels to protect your gains.
Analyze:
Use the indicator’s data to gauge market volatility and assess the significance of price movements, aiding in more informed trading decisions.
This indicator is perfect for traders looking to understand the impact of extreme price movements in monetary terms, optimize stop loss levels, and effectively manage risk across stocks and other instruments with similar tick structures.

[SHORT ONLY] 10 Bar Low Pullback█ STRATEGY DESCRIPTION
The "10 Bar Low Pullback" strategy is a contrarian short trading system designed to capture pullbacks after a new 10‐bar low is made. it identifies a potential short opportunity when the current bar’s low breaks below the lowest low of the previous 10 bars, provided that the bar exhibits strong internal momentum as measured by its IBS value. An optional trend filter further refines entries by requiring that the close is below a 200-period EMA.
█ WHAT IS INTERNAL BAR STRENGTH (IBS)?
Internal Bar Strength (IBS) measures where the closing price falls within the high-low range of a bar. It is calculated as:
ibs = (close - low) / (high - low)
- Low IBS (≤ 0.2): Indicates the close is near the bar's low, suggesting oversold conditions.
- High IBS (≥ 0.8): Indicates the close is near the bar's high, suggesting overbought conditions.
█ SIGNAL GENERATION
1. SHORT ENTRY
A Short Signal is triggered when:
The current bar’s low is below the lowest low of the past X bars (default: 10).
The bar’s IBS is greater than the specified threshold (default: 0.85).
The signal occurs within the defined trading window (between Start Time and End Time).
If the EMA Filter is enabled, the close must be below the 200-period EMA.
2. EXIT CONDITION
An exit Signal is generated when the current close falls below the previous bar’s low (close < low ), indicating a potential bearish reversal and prompting the strategy to close its short position.
█ ADDITIONAL SETTINGS
Lookback Period: Defines the number of bars (default is 10) over which the lowest low is calculated.
IBS Threshold: Sets the minimum required IBS value (default is 0.85) to qualify as a pullback.
Trading Window: Trades are only executed between the user-defined Start Time and End Time.
EMA Filter (Optional): When enabled, short entries are only considered if the current close is below the 200-period EMA, with the EMA period being adjustable (default is 200).
█ PERFORMANCE OVERVIEW
Designed for shorting opportunities, this strategy aims to capture pullbacks following an aggressive 10-bar low break.
It leverages a combination of a lookback low and IBS measurement to identify overextended bullish moves that may revert.
The optional EMA filter helps confirm a bearish market environment by ensuring the price remains under the trend line.
Suitable for use on various assets, including stocks and ETFs, on daily or similar timeframes.
Backtesting and parameter optimization are recommended to tailor the strategy to specific market conditions.

XAUUSD 10-Minute StrategyThis XAUUSD 10-Minute Strategy is designed for trading Gold vs. USD on a 10-minute timeframe. By combining multiple technical indicators (MACD, RSI, Bollinger Bands, and ATR), the strategy effectively captures both trend-following and reversal opportunities, with adaptive risk management for varying market volatility. This approach balances high-probability entries with robust volatility management, making it suitable for traders seeking to optimise entries during significant price movements and reversals.
Key Components and Logic:
MACD (12, 26, 9):
Generates buy signals on MACD Line crossovers above the Signal Line and sell signals on crossovers below the Signal Line, helping to capture momentum shifts.
RSI (14):
Utilizes oversold (below 35) and overbought (above 65) levels as a secondary filter to validate entries and avoid overextended price zones.
Bollinger Bands (20, 2):
Uses upper and lower Bollinger Bands to identify potential overbought and oversold conditions, aiming to enter long trades near the lower band and short trades near the upper band.
ATR-Based Stop Loss and Take Profit:
Stop Loss and Take Profit levels are dynamically set as multiples of ATR (3x for stop loss, 5x for take profit), ensuring flexibility with market volatility to optimise exit points.
Entry & Exit Conditions:
Buy Entry: T riggered when any of the following conditions are met:
MACD Line crosses above the Signal Line
RSI is oversold
Price drops below the lower Bollinger Band
Sell Entry: Triggered when any of the following conditions are met:
MACD Line crosses below the Signal Line
RSI is overbought
Price moves above the upper Bollinger Band
Exit Strategy: Trades are closed based on opposing entry signals, with adaptive spread adjustments for realistic exit points.
Backtesting Configuration & Results:
Backtesting Period: July 21, 2024, to October 30, 2024
Symbol Info: XAUUSD, 10-minute timeframe, OANDA data source
Backtesting Capital: Initial capital of $700, with each trade set to 10 contracts (equivalent to approximately 0.1 lots based on the broker’s contract size for gold).
Users should confirm their broker's contract size for gold, as this may differ. This script uses 10 contracts for backtesting purposes, aligned with 0.1 lots on brokers offering a 100-contract specification.
Key Backtesting Performance Metrics:
Net Profit: $4,733.90 USD (676.27% increase)
Total Closed Trades: 526
Win Rate: 53.99%
Profit Factor: 1.44 (1.96 for Long trades, 1.14 for Short trades)
Max Drawdown: $819.75 USD (56.33% of equity)
Sharpe Ratio: 1.726
Average Trade: $9.00 USD (0.04% of equity per trade)
This backtest reflects realistic conditions, with a spread adjustment of 38 points and no slippage or commission applied. The settings aim to simulate typical retail trading conditions. However, please adjust the initial capital, contract size, and other settings based on your account specifics for best results.
Usage:
This strategy is tuned specifically for XAUUSD on a 10-minute timeframe, ideal for both trend-following and reversal trades. The ATR-based stop loss and take profit levels adapt dynamically to market volatility, optimising entries and exits in varied conditions. To backtest this script accurately, ensure your broker’s contract specifications for gold align with the parameters used in this strategy.

EMA 5/10/20/34/55/60/120/255Overview
- Plots eight Exponential Moving Averages on the price chart: EMA(5/10/20/34/55/60/120/255) .
- Designed for light (white) theme with high-contrast colors and uniform linewidth=1 .
- Written in Pine Script v6 ( overlay=true ), no alerts or extra visuals.
Why These Lengths
- 5, 10 : Short-term momentum and intraday rhythm.
- 20, 34 : Swing trend and pullback structure (34 is Fibonacci-based).
- 55, 60 : Deeper swing/weekly alignment commonly used by trend traders.
- 120, 255 : Mid/long-term trend filters (~half-year and ~annual trading days).
How To Read
- Trend filter: Price above EMA(120/255) favors bullish context; below favors bearish.
- Alignment: Strong bull trend when 5 > 10 > 20 > 34 > 55 > 60 > 120 > 255 and slopes up; inverse for bear trends.
- Pullbacks: Shallow pullbacks often respect 5/10 ; standard pullbacks 20/34 ; deeper tests 55/60 .
- Slope matters: Up/flat/down slopes of the longer EMAs ( 120/255 ) reflect trend strength more reliably than single crossovers.
Typical Use Cases
- Trend following: Trade in the direction of 120/255 and the stacked EMA order.
- Pullback entries: Look for stabilizing price action around 20/34 within a trend.
- Breakout confirmation: Sustain above/below a key EMA, then retest and hold.
- Risk management: Place stops beyond nearby EMAs, optionally buffered by ATR.
Tips
- Use the Data Window to identify each EMA line by its title ( EMA(5) , EMA(10) , etc.).
- Combine with volatility/strength filters (e.g., ATR, ADX) to reduce range-bound noise.
- Multi-timeframe consistency (e.g., higher TF EMA(255) aligned with current TF EMA(55/60) ) improves selectivity.
Limitations
- All moving averages are lagging by design; expect delayed signals.
- In consolidations, frequent crossovers can create whipsaws; apply filters or focus on slope and structure.
Disclaimer
- For educational purposes only. Not financial advice. Always validate on your instruments and timeframes and manage risk accordingly.

Silver Bullet ICT Strategy [TradingFinder] 10-11 AM NY Time +FVG🔵 Introduction
The ICT Silver Bullet trading strategy is a precise, time-based algorithmic approach that relies on Fair Value Gaps and Liquidity to identify high-probability trade setups. The strategy primarily focuses on the New York AM Session from 10:00 AM to 11:00 AM, leveraging heightened market activity within this critical window to capture short-term trading opportunities.
As an intraday strategy, it is most effective on lower timeframes, with ICT recommending a 15-minute chart or lower. While experienced traders often utilize 1-minute to 5-minute charts, beginners may find the 1-minute timeframe more manageable for applying this strategy.
This approach specifically targets quick trades, designed to take advantage of market movements within tight one-hour windows. By narrowing its focus, the Silver Bullet offers a streamlined and efficient method for traders to capitalize on liquidity shifts and price imbalances with precision.
In the fast-paced world of forex trading, the ability to identify market manipulation and false price movements is crucial for traders aiming to stay ahead of the curve. The Silver Bullet Indicator simplifies this process by integrating ICT principles such as liquidity traps, Order Blocks, and Fair Value Gaps (FVG).
These concepts form the foundation of a tool designed to mimic the strategies of institutional players, empowering traders to align their trades with the "smart money." By transforming complex market dynamics into actionable insights, the Silver Bullet Indicator provides a powerful framework for short-term trading success
Silver Bullet Bullish Setup :
Silver Bullet Bearish Setup :
🔵 How to Use
The Silver Bullet Indicator is a specialized tool that operates within the critical time windows of 9:00-10:00 and 10:00-11:00 in the forex market. Its design incorporates key principles from ICT (Inner Circle Trader) methodology, focusing on concepts such as liquidity traps, CISD Levels, Order Blocks, and Fair Value Gaps (FVG) to provide precise and actionable trade setups.
🟣 Bullish Setup
In a bullish setup, the indicator starts by marking the high and low of the session, serving as critical reference points for liquidity. A typical sequence involves a liquidity grab below the low, where the price manipulates retail traders into selling positions by breaching a key support level.
This movement is often orchestrated by smart money to accumulate buy orders. Following this liquidity grab, a market structure shift (MSS) occurs, signaled by the price breaking the CISD Level—a confirmation of bullish intent. The indicator then highlights an Order Block near the CISD Level, representing the zone where institutional buying is concentrated.
Additionally, it identifies a Fair Value Gap, which acts as a high-probability area for price retracement and trade entry. Traders can confidently take long positions when the price revisits these zones, targeting the next significant liquidity pool or resistance level.
Bullish Setup in CAPITALCOM:US100 :
🟣 Bearish Setup
Conversely, in a bearish setup, the price manipulates liquidity by creating a false breakout above the high of the session. This move entices retail traders into long positions, allowing institutional players to enter sell orders.
Once the price reverses direction and breaches the CISD Level to the downside, a change of character (CHOCH) becomes evident, confirming a bearish market structure. The indicator highlights an Order Block near this level, indicating the origin of the institutional sell orders, along with an associated FVG, which represents an imbalance zone likely to be revisited before the price continues downward.
By entering short positions when the price retraces to these levels, traders align their strategies with the anticipated continuation of bearish momentum, targeting nearby liquidity voids or support zones.
Bearish Setup in OANDA:XAUUSD :
🔵 Settings
Refine Order Block : Enables finer adjustments to Order Block levels for more accurate price responses.
Mitigation Level OB : Allows users to set specific reaction points within an Order Block, including: Proximal: Closest level to the current price. 50% OB: Midpoint of the Order Block. Distal: Farthest level from the current price.
FVG Filter : The Judas Swing indicator includes a filter for Fair Value Gap (FVG), allowing different filtering based on FVG width: FVG Filter Type: Can be set to "Very Aggressive," "Aggressive," "Defensive," or "Very Defensive." Higher defensiveness narrows the FVG width, focusing on narrower gaps.
Mitigation Level FVG : Like the Order Block, you can set price reaction levels for FVG with options such as Proximal, 50% OB, and Distal.
CISD : The Bar Back Check option enables traders to specify the number of past candles checked for identifying the CISD Level, enhancing CISD Level accuracy on the chart.
🔵 Conclusion
The Silver Bullet Indicator is a cutting-edge tool designed specifically for forex traders who aim to leverage market dynamics during critical liquidity windows. By focusing on the highly active 9:00-10:00 and 10:00-11:00 timeframes, the indicator simplifies complex market concepts such as liquidity traps, Order Blocks, Fair Value Gaps (FVG), and CISD Levels, transforming them into actionable insights.
What sets the Silver Bullet Indicator apart is its precision in detecting false breakouts and market structure shifts (MSS), enabling traders to align their strategies with institutional activity. The visual clarity of its signals, including color-coded zones and directional arrows, ensures that both novice and experienced traders can easily interpret and apply its findings in real-time.
By integrating ICT principles, the indicator empowers traders to identify high-probability entry and exit points, minimize risk, and optimize trade execution. Whether you are capturing short-term price movements or navigating complex market conditions, the Silver Bullet Indicator offers a robust framework to enhance your trading performance.
Ultimately, this tool is more than just an indicator; it is a strategic ally for traders who seek to decode the movements of smart money and capitalize on institutional strategies. With the Silver Bullet Indicator, traders can approach the market with greater confidence, precision, and profitability.

Overlay Higher Timeframe EMA 10Plot the daily and weekly EMA 10 on any timeframe.
The Daily EMA 10 is useful for helping a trader decide whether the price is overextended without switching back to the daily timeframe and losing focus. It will change colour to indicate which order the EMA 10 and EMA 20 is in.
The Weekly EMA 10 is useful for helping a trader decide whether to take a trade based on long term momentum. If it is over the current price then the market has more momentum to the downside and if it is under then the market has more momentum to the upside. It will also change colour depending on which order the EMA 10 and EMA 20 is in. The weekly is often forgotten in trade planning.
You can switch the Daily and the Weekly on and off independently and change styles if you wish.

Turtle System 1 (20/10) + N-Stop + MTF Table V7.2🐢 Description: Turtle System 1 (20/10) IndicatorThis indicator implements the original trading signals of the Turtle Trading System 1 based on the classic Donchian Channels. It incorporates a historically correct, volatility-based Trailing Stop (N-Stop) and a Multi-Timeframe (MTF) status dashboard. The script is written in Pine Script v6, optimized for performance and reliability.📊 Core Logic and ParametersThe system is a pure trend-following model, utilizing the more widely known, conservative parameters of the Turtle System 1:FunctionParameterValueDescriptionEntry$\text{Donchian Breakout}$$\mathbf{20}$Buy/Sell upon breaking the 20-day High/Low.Exit (Turtle)$\text{Donchian Breakout}$$\mathbf{10}$Close the position upon breaking the 10-day Low/High.Volatility$\mathbf{N}$ (ATR Period)$\mathbf{20}$Calculation of market volatility using the Average True Range (ATR).Stop-LossMultiplier$\mathbf{2.0} BER:SETS the initial and Trailing Stop at $\mathbf{2N}$.🛠️ Key Technical Features1. Original Turtle Trailing Stop (Section 4)The stop-loss mechanism is implemented with the historically accurate Turtle Trailing Logic. The stop is not aggressively tied to the current candle's low/high, which often causes premature exits. Instead, the stop only trails in the direction of the trend, maximizing the previous stop price against the new calculated $\text{Close} \pm 2N$:$$\text{New Trailing Stop} = \text{max}(\text{Previous Stop}, \text{Close} \pm (2 \times N))$$2. Reliable Multi-Timeframe (MTF) Status (Section 6)The indicator features a robust MTF status table.Purpose: It calculates and persistently stores the Turtle System 1 status (LONG=1, SHORT=-1, FLAT=0) for various timeframes (1H, 4H, 8H, 1D, and 1W).Method: It uses global var int variables combined with request.security(), ensuring the status is accurately maintained and updated across different bars and timeframes, providing a reliable higher-timeframe context.3. VisualizationsChannels: The 20-period (Entry) and 10-period (Exit) Donchian Channels are plotted.Stop Line: The dynamic $\mathbf{2N}$ Trailing Stop is visible as a distinct line.Signals: plotshape markers indicate Entry and Exit.MTF Table: A clean, color-coded status summary is displayed in the upper right corner.

9:00-9:59 NY Range -> 10:00-11:00 Lines (v6)//@version=6
indicator("9:00-9:59 NY Range -> 10:00-11:00 Lines (v6)", overlay=true, max_lines_count=500)
// --- state vars ---
var float sessionHigh = na
var float sessionLow = na
var line hiLine = na
var line loLine = na
var line v10 = na
var line v11 = na
// --- New York time ---
t_ny = time("America/New_York")
hr = hour(t_ny)
mn = minute(t_ny)
// --- reset / clear at 16:00 (4 PM NY) ---
if hr == 16 and mn == 0
sessionHigh := na
sessionLow := na
if not na(hiLine)
line.delete(hiLine)
hiLine := na
if not na(loLine)
line.delete(loLine)
loLine := na
if not na(v10)
line.delete(v10)
v10 := na
if not na(v11)
line.delete(v11)
v11 := na
// --- accumulate 9:00 - 9:59 NY range ---
if hr == 9
if mn == 0
sessionHigh := high
sessionLow := low
else
sessionHigh := na(sessionHigh) ? high : math.max(sessionHigh, high)
sessionLow := na(sessionLow) ? low : math.min(sessionLow, low)
// --- at 10:00 NY: draw horizontal lines (start) and vertical dashed at 10:00 ---
if hr == 10 and mn == 0
// delete previous day's horizontal lines if any
if not na(hiLine)
line.delete(hiLine)
hiLine := na
if not na(loLine)
line.delete(loLine)
loLine := na
hiLine := line.new(bar_index, sessionHigh, bar_index, sessionHigh, color=color.red, width=1, extend=extend.none)
loLine := line.new(bar_index, sessionLow, bar_index, sessionLow, color=color.red, width=1, extend=extend.none)
if not na(v10)
line.delete(v10)
v10 := na
v10 := line.new(bar_index, low, bar_index, high, color=color.red, width=1, style=line.style_dashed)
// --- at 11:00 NY: draw vertical dashed at 11:00 ---
if hr == 11 and mn == 0
if not na(v11)
line.delete(v11)
v11 := na
v11 := line.new(bar_index, low, bar_index, high, color=color.red, width=1, style=line.style_dashed)
// --- extend the horizontal lines forward every bar, but only until 11:00 ---
if hr < 11
if not na(hiLine)
line.set_x2(hiLine, bar_index)
if not na(loLine)
line.set_x2(loLine, bar_index)
// --- required output so script compiles (hidden) ---
plot(na)

Multi Momentum 10/21/42/63 — Histogram + 2xSMAMY MM INDICATOR INDIRED BY KARADI
It averages four rate-of-change snapshots of price, all anchored at today’s close.
If “Show as %” is on, the value is multiplied by 100.
Each term is a simple momentum/ROC over a different lookback.
Combining 10, 21, 42, 63 bars blends short, medium, and intermediate horizons into one number.
Positive MM → average upward pressure across those horizons; negative MM → average downward pressure.
Why those lengths?
They roughly stack into ~2× progression (10→21≈2×10, 21→42=2×21, 63≈1.5×42). That creates a “multi-scale” momentum that’s less noisy than a single fast ROC but more responsive than a long ROC alone.
How to read the panel
Gray histogram = raw Multi-Momentum value each bar.
SMA Fast/Slow lines (defaults 12 & 26 over the MM values) = smoothing of the histogram to show the trend of momentum itself.
Typical signals
Zero-line context:
Above 0 → bullish momentum regime on average.
Below 0 → bearish regime.
Crosses of SMA Fast & Slow: momentum trend shifts (fast above slow = improving momentum; fast below slow = deteriorating).
Histogram vs SMA lines: widening distance suggests strengthening momentum; narrowing suggests momentum is fading.
Divergences: price makes a new high/low but MM doesn’t → potential exhaustion.
Compared to a classic ROC
A single ROC(20) is very sensitive to that one window.
MM averages several windows, smoothing idiosyncrasies (e.g., a one-off spike 21 bars ago) and reducing “lookback luck.”
Settings & customization
Lookbacks (10/21/42/63): you can tweak for your asset/timeframe; the idea is to mix short→medium horizons.
Percent vs raw ratio: percent is easier to compare across symbols.
SMA lengths: shorter = more reactive but choppier; longer = smoother but slower.
Practical tips
Use regime + signal: trade longs primarily when MM>0 and fast SMA>slow SMA; consider shorts when MM<0 and fast

Last 10 Sessions: High, Low, Pivot, GapLast 10 Sessions: High, Low, Pivot, Gap
This indicator highlights the most important price levels from the last 10 completed trading sessions to help intraday and swing traders quickly spot potential support, resistance, and price reaction zones.
Key Features:
Previous Highs and Lows : Visualize the high and low from each of the past 10 sessions. These are the most commonly tested breakout and reversal points for day trading.
Session Pivots: The classic pivot formula ((High + Low + Close) / 3) for each of the last 10 sessions, often acting as a market “equilibrium” or intraday magnet.
Gaps: Displays the difference between each day’s open and the previous session’s close (“gap”), showing sentiment shifts and possible gap fill targets.
Clean, Faded Visuals: All lines and labels are subtly faded so your chart remains clear and uncluttered, with each level labeled by how many sessions ago it occurred.
Full Customization: Instantly toggle any level type (High, Low, Pivot, Gap) ON/OFF in settings, extend lines to the right, and adjust their forward length.
Bulletproof Logic: Never throws runtime errors. Lines and labels only display when valid data is present.
How to Use:
Use recent highs/lows for breakout, breakdown, or mean reversion trades.
Spot where multiple levels from past sessions cluster together for high-probability reversal or breakout areas.
Watch pivots for intraday bias, and gaps for sentiment and possible fill plays.
Perfect for all intraday timeframes.
If you want a powerful yet minimal map of where price is most likely to react, this indicator is for you!
Developed by

EMA 10/55/200 - LONG ONLY MTF (4h with 1D & 1W confirmation)Title: EMA 10/55/200 - Long Only Multi-Timeframe Strategy (4h with 1D & 1W confirmation)
Description:
This strategy is designed for trend-following long entries using a combination of exponential moving averages (EMAs) on the 4-hour chart, confirmed by higher timeframe trends from the daily (1D) and weekly (1W) charts.
🔍 How It Works
🔹 Entry Conditions (4h chart):
EMA 10 crosses above EMA 55 and price is above EMA 55
OR
EMA 55 crosses above EMA 200
OR
EMA 10 crosses above EMA 500
These entries indicate short-term momentum aligning with medium/long-term trend strength.
🔹 Confirmation (multi-timeframe alignment):
Daily (1D): EMA 55 is above EMA 200
Weekly (1W): EMA 55 is above EMA 200
This ensures that we only enter long trades when the higher timeframes support an uptrend, reducing false signals during sideways or bearish markets.
🛑 Exit Conditions
Bearish crossover of EMA 10 below EMA 200 or EMA 500
Stop Loss: 5% below entry price
⚙️ Backtest Settings
Capital allocation per trade: 10% of equity
Commission: 0.1%
Slippage: 2 ticks
These are realistic conditions for crypto, forex, and stocks.
📈 Best Used On
Timeframe: 4h
Instruments: Trending markets like BTC/ETH, FX majors, or growth stocks
Works best in volatile or trending environments
⚠️ Disclaimer
This is a backtest tool and educational resource. Always validate on demo accounts before applying to real capital. Do your own due diligence.
