Intraday Fibonacci Levels [Gorb]Welcome to the Intraday Fibonacci Levels indicator, a dynamic and customizable tool designed for traders who incorporate Fibonacci retracements and extensions into their technical analysis. This indicator focuses on intraday price action, allowing you to select a specific candle from any trading session and visualize crucial Fibonacci levels derived from its high and low prices.
Features:
Candle Selection for Fibonacci Analysis: Select any candle based on its time to plot Fibonacci levels, giving you control over the period of analysis.
Customizable .236 and .618 Fibonacci Levels: Plot and customize the .236 and .618 Fibonacci retracement and extension levels. Adjust color and line style for each level to fit your chart preferences.
User-Friendly Interface: Easy-to-use input fields for selecting the candle time and configuring Fibonacci settings. Intuitive toggle options to display or hide specific Fibonacci levels.
Dynamic Updating: The indicator updates in real-time as new price data is received, ensuring you have the latest Fibonacci levels on your chart.
Usage Case:
This indicator is ideal for day traders and technical analysts who utilize Fibonacci tools to identify potential support and resistance levels, trend reversals, or continuation patterns. Whether you are analyzing a high-impact news event candle or a significant pivot point in the trading day, this indicator helps bring clarity to your Fibonacci-based trading strategy.
Guidelines for Usage:
Use the indicator settings to select the candle time and configure your desired Fibonacci levels. You can choose any time you want, in order to use premarket candles you need to enable electronic hours on your chart to have levels plot from pre/post.
These auto plotted levels can act as pivot points or points of support and resistance for traders to make informed trading decisions near these levels. Analyze the plotted Fibonacci levels in conjunction with other technical indicators or price action patterns for informed trading decisions.
Conclusion:
This indicator is a versatile and essential tool for traders who rely on Fibonacci analysis as part of their trading arsenal. By offering the flexibility to analyze specific candles and customize Fibonacci levels, this indicator empowers you to make more informed trading decisions. Its user-friendly design and real-time updating capabilities ensure that you have access to accurate and relevant Fibonacci data at any moment of the trading day.
RISK DISCLAIMER
All content, tools, scripts & education provided by Monstanzer or Gorb Algo are for informational & educational purposes only. Trading is risk and most lose their money, past performance does not guarantee future results.
Cerca negli script per "半导体设备ETF"

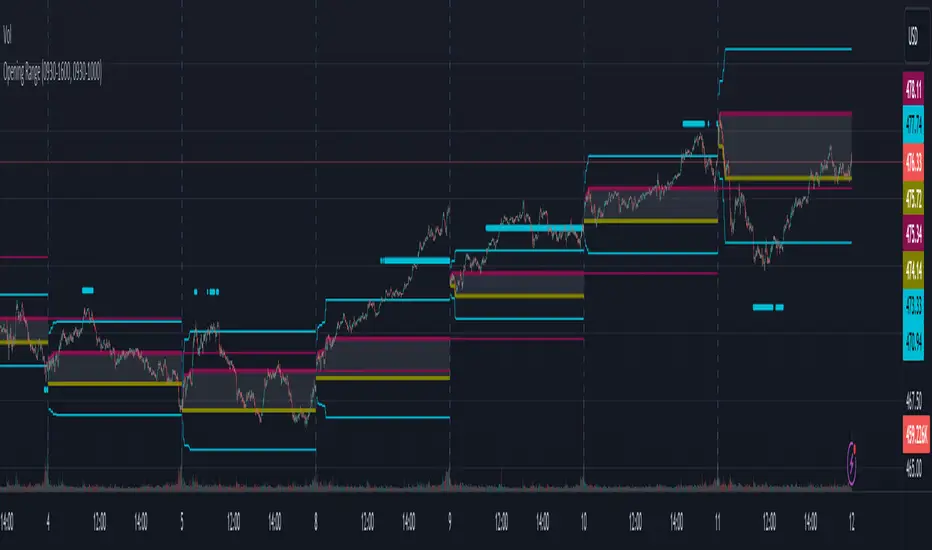
Opening RangeThe opening range or first 30 minutes of trading during the day sets the tone and becomes an important reference through the rest of the day. Price will react as it reaches the high and low of the opening range.
Backtesting has shown that the strategies based on the opening range have merit and provide an edge in trading. By not being aware of these points of reference you put yourself at risk.
In addition to the opening range, the distance from the high or low of the opening range plus the width of the opening range forms another important reference point.
Opening Range Rules.
Price must break out of the opening range in order to have a trending day. As long as price is inside the opening range, expect the trade to be choppy.
Once price leaves the opening range the market can begin to trend. However, before it trends most times it will retest the boundary of the opening range. This is a critical point, and a better than average entry for a position to join the trend. However, if price closes back inside the opening range watch out. Re-entry to the opening range has a high probability of going to the middle of the opening range, and a better than average probability of crossing the entire opening range.
In the above chart we can see price broke below the opening range then returned to retest the opening range before beginning a downward trend that delivered 175 pts on NQ.
Upon re-entering the opening range price tried to break down again but ultimately traveled up until it hit the 50% mark of the opening range.
Once a trend has begun the first target is the green line which is 1 width of the opening range outside of the opening range.
Once price broke out of the opening range to the upside, it came back to retest the opening range high, before beginning an uptrend that delivered 120 pts on NQ.
ARIMA Moving Average and Forecaster [SS]Finally releasing this. This took months, over 3 months to be precise, to figure out, code and troubleshoot! I honestly was going to give up on this project, but I finally got it to actually work fairly reliably. So hopefully you like it!
This is a very basic ARIMA modeler. It can do the following:
1. Provide you with an ARIMA based Moving Average;
2. Provide you with a standard error band;
3. Auto-select a lag length for assessment based on stationarity;
3. Provide you with the option of extending the error range by a user selected amount of standard deviations; and
4. Forecasting and plotting the forecast on the chart.
I will go over each function individually, but before I do, I think its important to talk a bit about what an ARIMA Model is and does:
ARIMA stands for AutoRegressive Integrated Moving Average and is an approach to modeling and time series forecasting. In simple terms, it combines autoregressive (AR) and moving average (MA) components to capture the underlying patterns in a time series data. The "AutoRegressive" part accounts for the relationship between an observation and its previous values, while the "Moving Average" part considers the relationship between an observation and a residual error from past observations. The "Integrated" component involves differencing the time series to make it stationary, which aids in stabilizing the model. ARIMA models help predict future values based on patterns observed in historical data, making them useful for forecasting in various fields such as economics, finance, and weather prediction.
The benefits to ARIMA is it will forecast based on the current trend, but it also provides for both the up and down scenario of the trend (i.e., if we are in a downtrend, what it would look like and what values we could expect if the trend reverses and vice versa). All of this is within the scope of this indicator, believe it or not!
If you would like more information on ARIMA, you can check out my educational post about it here:
Alrighty, now for the indicator functions.
ARIMA Moving Average and Standard Error Band
The ARIMA moving average is very simple, it takes the SMA of the current trend, lags it and plots out the lagged SMA. You can toggle the auto-select lag on, or you can pick your own lag manually. The above image is an auto-selected lag, but if we manually lag it by 5, this is what it looks like:
Its simply a lagged average of the 5 SMA (that is essentially how ARIMA works, by creating a moving average and lagging the moving average).
There are some implications to selecting a lag factor when it comes to forecasting, but I will cover this in the forecasting section. But I do want to make mention, you can use the ARIMA moving average in lieu of other moving averages. The advantage to doing this is it will be able to plot out the error bands. For example, if we wanted to get an ARIMA MA of the 200 SMA, we can toggle on the error bands and this is what we get:
Or the 50 MA:
NOTE: You ABSOLUTELY SHOULD NEVER use more than a lag of 4 or 5 for Forecasting (will be discussed later).
Auto-Select Lag
The indicator pulls the ARIMA modeler framework from my Forecasting library and pulls the stationarity assessment from my SPTS library. When you are doing an ARIMA model for forecasting, we need to ensure the data is stationary. Thus, if you want to forecast out the current trend, its highly recommended you select the "Auto Determine Lag Length" to find the most appropriate lag and forecast accordingly.
You can, however, chose your own lag order (model order), but this should never be above 4 or 5.
You should never select a lag of more than 5 because you are introducing too much "trendiness" into the equation, and you will get astronomical readings. ARIMA models never generally exceed a lag of 3 or 4 at most, as they are supposed be stationary and de-trended.
Extending by Standard Deviation
There is an option to select a standard deviation extension band. This is helpful for active day trading. Here is NIO extended by 2 standard deviations:
General suggestion is to only extend by 2 standard deviations and this is sufficient for most stocks.
Forecasting
The hallmark of an ARIMA model is the ability to use it for forecasting. Thus, the forecasting feature is a large portion of this indicator. You can see it displayed in the main chart above, but let's show some other examples:
NIO on the 1 hour:
TSLA on the 4 hour:
You can also display a forecasting table:
The result row shows the most likely, conservative, price at each time increment.
The Upper Confidence and Lower Confidence show what the trend would look like if it continued up or down at the current rate and the 95% confidence intervals show the values that the true source is likely to fall between at various increments in time with a 95% confidence (i.e. 95% probability that it should fall between these levels at period xyz assuming normal distribution).
The important levels, in my opinion, are the upper and lower confidence levels. These show you the current rate of decline or increase that the stock is expecting and what the trend would look like with a continuation or a reversal. This is ARIMA's biggest strength, as it has the ability to plot both outcomes assuming the current trend rate and time remains constant.
And that is the indicator! ARIMA is a bit of a complex process, but its a very powerful tool when used properly!
Troubleshooting:
One thing of note. Sometimes when autoselecting a length for forecasting, if there has been a heavy trend in one direction, you will not get the upper or lower confidence levels because of the lack of any up or down movement. In this case, manually select a lag of 3 to 5 to correct for this.
Let me know if you have any questions below and safe trades everyone!

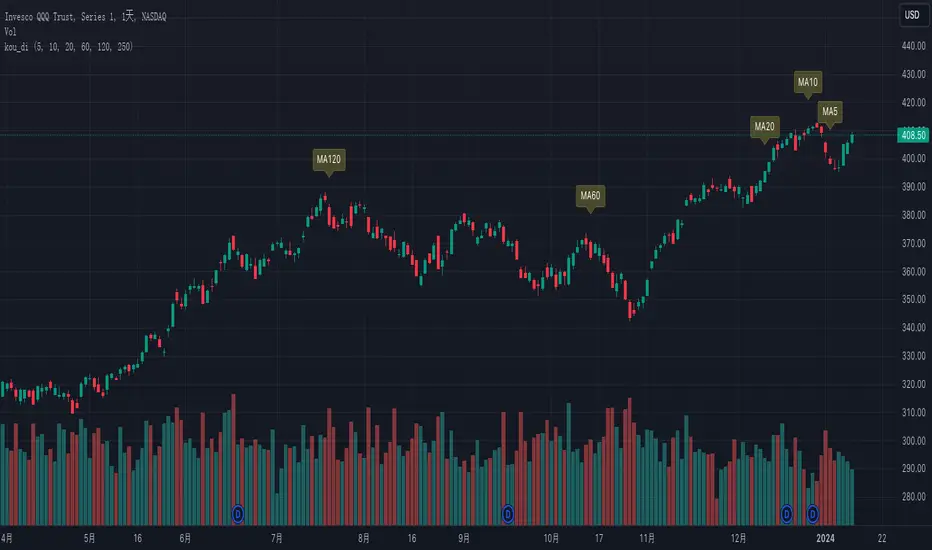
kou_diThe Simple Moving Average (SMA) is the most basic and widely used type of moving average. It’s calculated by taking the arithmetic mean of a given set of prices or data points over a specified period.
SMA = (P1 + P2 + ... + Pn) /n
Where
P1, P2, ... , Pn = prices of data points
n = number of periods
When a new SMA is calculated for a new candle stick, the oldest data point P1 is removed from the original data points (P1 + P2 + ... + Pn) and a new price Pn+1 is added to form a new SMA:
SMA_new = (P2 + ... + Pn + Pn+1) /n
If Pn+1 < P1, SMA line will become downward trend, or if Pn+1 > P1, SMA line will become upward trend. This logic help us predict the moving direction of SMA line which will form the prices trend in the future.
So it's important to highlight the "P1" candle stick for SMAs of different periods to help us predict the trend of SMA lines.
Since SMA5, SMA10, SMA20, SMA60, SMA120, SMA250 are the most popular SMAs, this indicator marks the "P1" candle stick for all of them by default, but you can optionally disable them.
该指标用于显示SMA5, SMA10, SMA20, SMA60, SMA120, SMA250 的扣抵位来监测均线拐点的出现
Split VolumeThe Split Volume indicator displays 'Upwards' and 'Downwards' volume with an additional method for distributing 'split' candle volume.
A 'split' candle is a candle whose direction is...'Split'...since the open and close are equal. (Ex. Doji)
Upwards and Downwards Volume is tracked by comparing the Open and Closes of the Lower Timeframes.
If the Close is Greater-than the Open, we track the Volume as 'Upwards' Volume.
If the Close is Less-than the Open, we track the Volume as 'Downwards' Volume.
If the Close and Open are Equal, we assume that the Volume is an even split 50/50, and track it as such.
The indicator pulls data from lower timeframes to achieve more granular Open,Close,& Volume Data
Specifically:
<5m Timeframe: 1 Second LTF
<60m Timeframe: 5 Second LTF
<1D Timeframe: 1 Minute LTF
>1D Timeframe: 60m LTF
We have also included some nice-to-have features
50% Volume Line: This line splits each columns in half, this is used as quick reference to see exactly which side the volume is on.
High Volume Candle Identification: We are detecting bars with high relative volume and coloring them on the upper chart for use as important zones.
Status Line Readouts: The Status line for this indicator is formatted for simple reading. It Reads(Left-to-Right):Total Volume, Downwards Volume, 50% Value, Upwards Volume

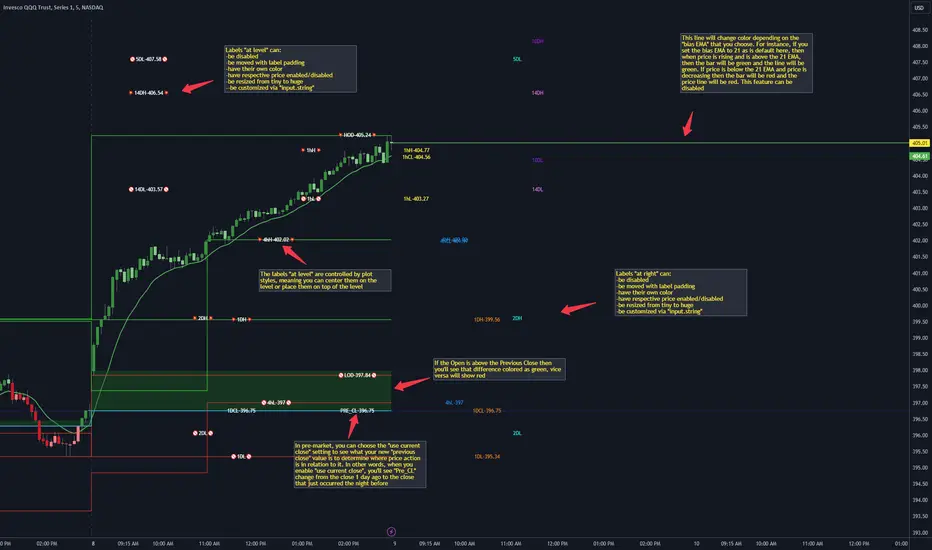
CANDLE LEVELS [PRO]This indicator provides you with 55 levels! with labels to help you identify quickly where current price is in relation to the OPEN, CLOSE, HIGH OF DAY and LOW OF DAY to a respective level. Choose from levels as low as the 5 minute time frame all the way up to 200 days. All of the levels except the day's OPEN, HIGH OF DAY AND LOW OF DAY use the PREVIOUS time frame's level. In other words, when you're looking at the "1 DAY HIGH", that's actually the previous day's HIGH OF DAY. Whether you're a scalper on the lower time frames or a swing trader that mainly uses the 1 hour and above, these candle levels can be an invaluable source of support and resistance; in other words you'll often see price bounce off of a level (whether price is increasing or decreasing) once or multiple times and that could be an indication of a price's direction. Another way that you could utilize this indicator is to use it in confluence with other popular signals, such as an EMA crossover. For instance, you could watch as price rises above the 21 EMA all the while price is also crossing up and over the previous day's HIGH OF DAY with a relative volume that's double that of the previous week's average. These are just a few of some potential bullish signals that you could look for to go long on a trade using the candle levels provided.
I've made this indicator extremely customizable:
⚡Each level has 2 labels: 1 "at level" and 1 "at right", each label and price can be disabled
⚡Each label has its own input for label padding. The "at right" label padding input allows you to zoom in and out of a chart without the labels moving along their respective axis
⚡Each label's text can be customized via an "input.string" code base
⚡Each level's label can be changed via a plot style setting to determine if the label is centered with it's respective level or rides along the top of it
⚡Significant figures input allows you to round price up or down
⚡A "bias EMA" tool that color codes the candles and price line to show you where price is in relation to the 21 EMA (or another value that you pick). As a result, this can be an effective visual to help reduce cognitive load
⚡A "fill level" where color is determined by price opening above or below the previous day's close
⚡A "use current close" setting that's great to use in pre-market as it shows you where price is in relation to the previous days' close
----------------------------------------------------------------------------------------------------------------------
🙏Thanks to (c)satymahajan for the inspiration behind the ATR "previous close" and "bias candle" code base
🙏Thanks to my mentor (c)SimpleCryptoLife for the libraries and extensive code to help create this indicator
Weighted Alpha with Zero line indicatorDescription:
This script introduces an Enhanced Weighted Alpha Indicator, designed for traders and analysts who seek a more nuanced view of market momentum and trend strength. The Weighted Alpha is a sophisticated measure that combines the concepts of price change and consistency of trend over a specified period. This version of the indicator is enhanced with a customizable lambda value, allowing users to fine-tune the sensitivity according to their trading strategy.
Key Features:
Weighted Alpha Calculation: The script calculates the Weighted Alpha based on the daily return of the asset, adjusted by a decay factor (lambda). This provides a smoothed, long-term view of the asset's momentum.
Customizable Lambda: Users can adjust the lambda value to modify the rate at which older data decreases in relevance. A higher lambda value gives more weight to recent data, making the indicator more sensitive to recent price movements.
Zero Line Indicator: A dotted red horizontal line at the 0 value on the y-axis serves as a quick visual reference. This line helps in identifying when the Weighted Alpha crosses from positive to negative or vice versa, indicating potential shifts in market momentum.
Separate Chart Pane: The Weighted Alpha is plotted on a separate pane below the main chart, providing a clear and uncluttered view.
Usage:
Trend Analysis: A positive Weighted Alpha indicates an upward trend, while a negative value suggests a downward trend. The magnitude of the Weighted Alpha gives an idea of the trend's strength.
Crossover Signals: Watch for the Weighted Alpha line crossing the zero line. Such crossovers can signal potential trend reversals.
Customization: Experiment with different lambda values to match the indicator's sensitivity with your trading style. A lower lambda smooths out the line more, while a higher lambda makes it more responsive to recent price changes.
Conclusion:
This Enhanced Weighted Alpha Indicator is a powerful tool for traders looking to analyze and anticipate market trends with greater precision. Its customization options and clear visual representation make it a valuable addition to any trader's toolkit.

Annualized ReturnThis is a straightforward tool for investors, offering the capability to select a specific start date and visualize the annualized return of the currently displayed asset.
Annualized return is a crucial metric for investors, as it provides a standardized measure of an investment's performance, making it easier to compare different investments. By annualizing returns, investors can gain insights into the average yearly growth rate of their investments, enabling more informed decision-making and portfolio management .
Selecting various start dates enables users to understand how market timing can influence the success of their investments.
The annualized return is calculated using the following formula :
AnnualizedReturn = (Ending price / Beginning price) ^ (1 / Number of Years) − 1

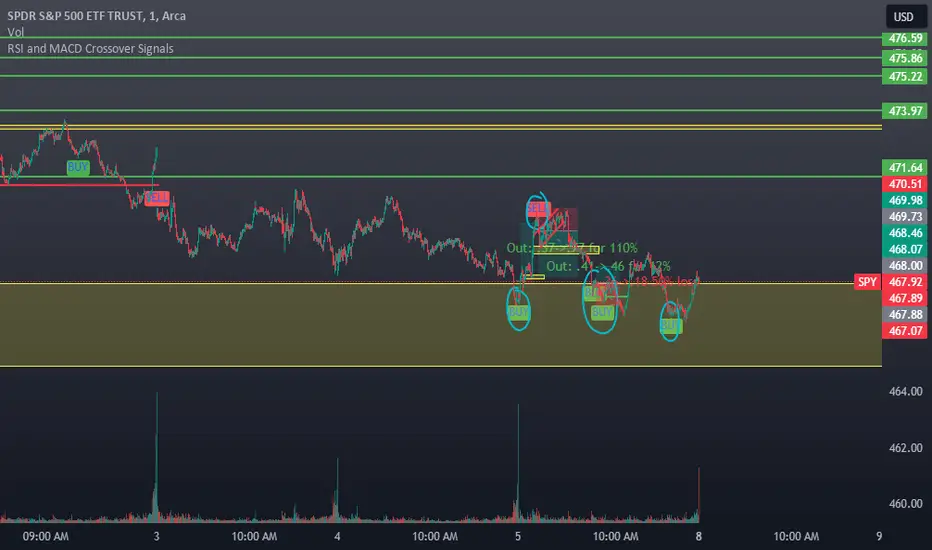
RSI and MACD Crossover SignalsBest for Short-Term/Intraday Trading on SPY, TSLA, NVDA
Strategy Concept:
This strategy is designed for short-term trading across various assets and timeframes (Recommend: 1min, 5min, 15min, 1hr, 4hr, 1day). It leverages the Relative Strength Index (RSI) and Moving Average Convergence Divergence (MACD) to identify potential buy and sell signals. The strategy aims to capture moments where the asset's price is likely to experience a reversal or a significant momentum shift.
By combining the RSI and MACD indicators, the strategy seeks to increase the accuracy of identifying potential trend reversals or continuations, taking into account both the momentum and the trend direction of the asset.
RSI (Relative Strength Index) Parameters:
The RSI period is set to 14
Overbought and oversold levels are set at 70 and 30, respectively
The RSI is used to identify potential reversal points when the asset is overbought or oversold
MACD (Moving Average Convergence Divergence) Parameters:
The MACD settings are configured with a fast length of 8, a slow length of 34, and a signal smoothing of 8
The MACD line crossing over or under the signal line is used to confirm the potential buy or sell signals indicated by the RSI
Signal Generation Logic:
Buy Signal:
Triggered when the RSI crosses above the oversold level (30).
Confirmed if the MACD line crosses above the signal line within a delay period of up to 4 candles after the RSI signal.
Sell Signal:
Triggered when the RSI crosses below the overbought level (70).
Confirmed if the MACD line crosses below the signal line within a delay period of up to 4 candles after the RSI signal.
Additional Features:
The script includes a notification system that alerts the trader when either a buy or sell signal is detected. The alert signal is combined with both the buy and sell signal in 1 so people without premium can be alerted when any signal appears.
Buy signals are visually represented on the chart below the price bars with a green "BUY" label.
Sell signals are indicated above the price bars with a red "SELL" label.
Usage and Application:
This strategy is versatile and recommended to be played with scalps and day trades. I prefer SPY 0DTE on the 1 and 5 minute timeframe and looking for bigger trend reversals on the 1hr, 4hr, and 1 day timeframe.
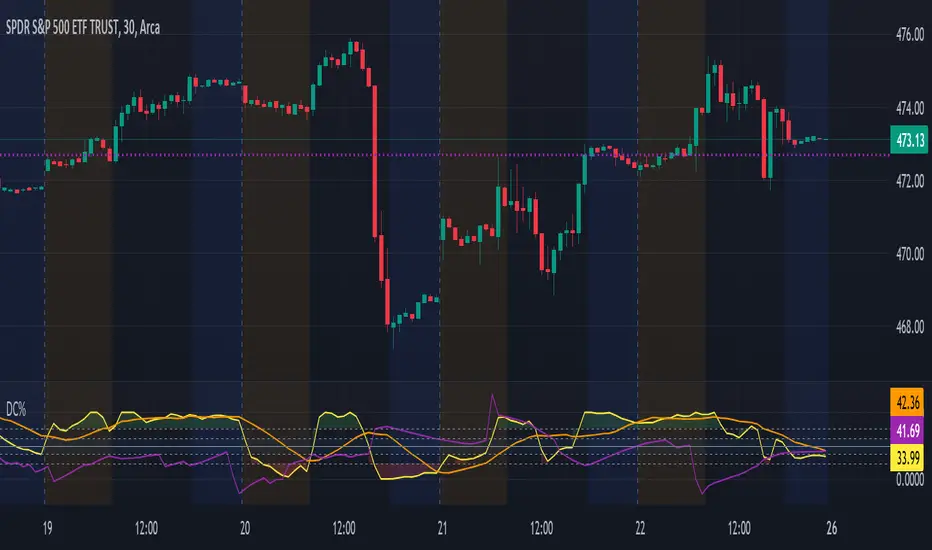
Activity & Chop ScoreRelease Notes:
The Activity and Chop Score was designed to help traders quickly determine if a market is active and/or choppy (not moving with any urgency). Slow and chopping markets should be approached with caution or avoided.
How does it work? The Activity Score incorporates momentum and the linear regression. Momentum (change in price over time) is compared over a long and short time period. Active markets are when those are moving together. This is combined with a linear regression of the price to determine the Correlation Coefficient (r^2) to measure of trend strength. The score is a is the average of the two momentum values, normalized by the standard deviation, and scaled by the trend (r^2 value). Chop is defined as divergence between long and short momentum periods. The divergences (chop) are quantified with a Jaccard Similarity Score, normalized by the standard deviation, and averaged to create a score.
How can you use it? This indicator is best used on lower timeframes. Activity Scores Values below 1 are considered low and values over 2 are high. Avoid markets where the Activity Score is below 1. There is an alert threshold in the options. Pivots are worth paying attention too as well as they indicate the start and stop of a recent move. You can compare markets or assets with the Chop Score. You make chose to avoid those with higher Chop Score. The position of the two lines relative to each other are useful. Ideally, the Activity Score is higher than the Chop Score. As with any indicators, it should be used in combination with others that best suits your trading style.

Saty Volume StackBreaks volume into buy and sell volume and stacks them based on which side has higher volume.
Dynamic Buy / Sell Stack
Unlike other buy/sell volume indicators, which statically display this information (typically green over red), this indicator dynamically stacks the higher volume side on top. For example, green over red indicates more buy-side volume, red over green indicators more sell-side volume.
Current Candle Volume Buy/Sell %
A label shows the % buy vs sell volume for the current candle in real-time. This label is also dynamic with the left position being higher volume.
How the Buy/Sell Volume is Calculated
Buy/Sell % is calculated based on price.
Buy % is calculated using the distance between the low of the candle to the closing value of the candle and dividing that by the total range of the candle high to low.
Sell % is calculated using the distance between the high of the candle to the closing value of the candle and dividing that by the total range of the candle high to low.
Please note this is a proxy metric and while it is incredibly useful, it is not going to match up exactly with actual buy/sell volume that can be found on tape.

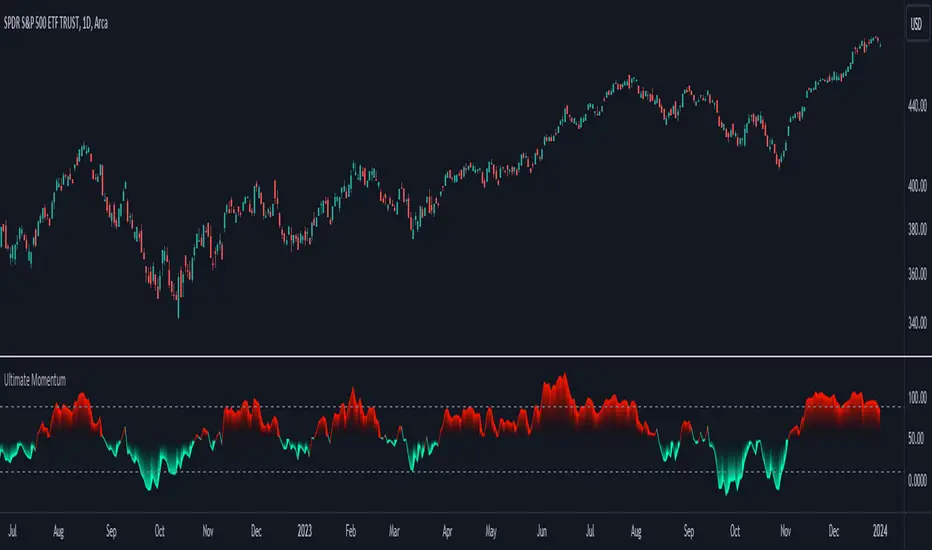
Ultimate Momentum"Ultimate Momentum" – Elevating Your Momentum Analysis
Experience a refined approach to momentum analysis with "Ultimate Momentum," a sophisticated indicator seamlessly combining the strengths of RSI and CCI. This tool offers a nuanced understanding of market dynamics with the following features:
1. Harmonious Fusion: Witness the dynamic interplay between RSI and CCI, providing a comprehensive understanding of market nuances.
2. Optimized CCI Dynamics: Delve confidently into market intricacies with optimized CCI parameters, enhancing synergy with RSI for a nuanced perspective on trends.
3. Standardized Readings: "Ultimate Momentum" standardizes RSI and CCI, ensuring consistency and reliability in readings for refined signals.
4. Native TradingView Integration: Immerse yourself in the reliability of native TradingView codes for RSI and CCI, ensuring stability and compatibility.
How RSI and CCI Work Together:
RSI (Relative Strength Index): Captures price momentum with precision, measuring the speed and change of price movements.
CCI (Commodity Channel Index): Strategically integrated to complement RSI, offering a unique perspective on price fluctuations and potential trend reversals.
Why "Ultimate Momentum"?
In a crowded landscape, "Ultimate Momentum" stands out, redefining how traders interpret momentum. Gain a profound understanding of market dynamics, spot trend reversals, and make informed decisions.
Your Insights Matter:
Share your suggestions to enhance "Ultimate Momentum" in the comments. Your feedback is crucial as we strive to deliver an unparalleled momentum analysis tool.
Z-Score Forecaster[SS]Hello everyone,
I just released a neat library for Forecasting stock and equities. In it, it has a couple of novel approaches to forecasting (namely, a Moving Average forecaster and a Z-Score Forecaster). These were accomplished applying basic theories on Autoregression, ARIMA modelling and Z-Score to make new approaches to forecasting.
This is one of the novel approaches, the Z-Score forecaster.
How this function works is it identifies the current trend over the duration of the Z-Score assessment period. So, if the Z-Score is being assessed over the previous 75 candles, it will identify the trend over the previous 75 candles. It will then plot out the forecasted levels according to the trend, up to a maximum of the max Z-Score the ticker has reached within its period. At that point, it will show a likely trend reversal.
Here is an example:
This shows that SPY may go to 475.42 before reversing, as 475.42 is the highest z-score that has been achieved in the current trend.
When it is in an uptrend, the forecast line will be green, when in a downtrend, it will be red.
The forecasting line is accomplished through pinescript's new polyline feature.
In addition to the line, you can also have the indicator plot out a forecast table. The Z-Score Forecast table was formatted in a similar way to ARIMA, where it makes no bias about trend, it simply plots out both ends of the spectrum. So, if an uptrend were to continue, it will list the various uptrend targets along the way, vice versa for downtrends.
It will also display what Z-Score these targets would amount to. Here is an example:
Looking at SPY on the daily, we can see that a likely upside target would be around 484 at just over 2 Standard Deviations (Z-Score).
Its not liklely to go higher than that because then we are getting into 3 and 4 standard deviations.
Remember, everything generally should be within 1 and -1 standard deviations of the mean. So if we look at the table, we can see that would be between 466 and 430.
Customization
You can customize the Z-Score length and source. You can also toggle off and on alerts. The alerts will pop up when a ticker is trading at a previous maximum or previous minimum.
I have also added a manual feature to plot the Z-Score SMA, which is simply the SMA over the desired Z-Score lookback time.
And that's the indicator!
If you are interested in the library, you can access it here .
Thanks for checking this out and leave your questions below!

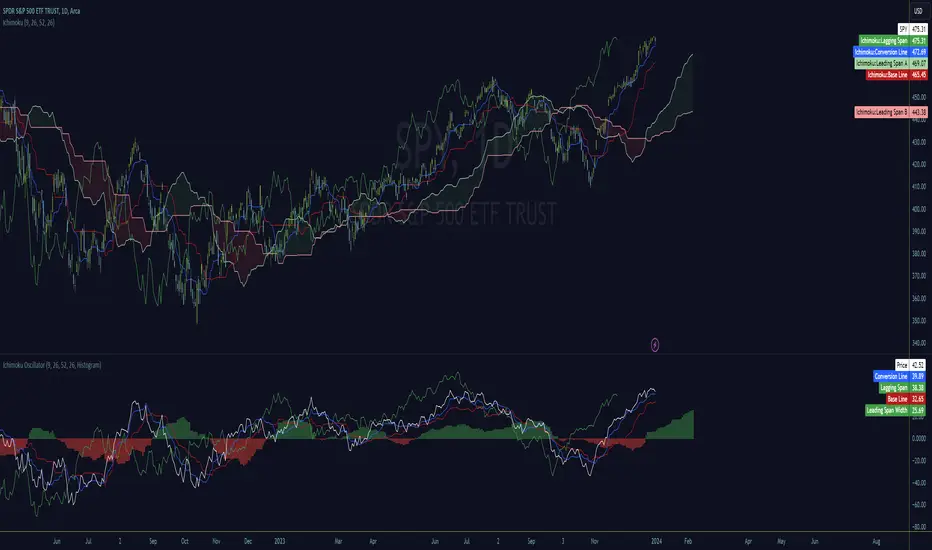
Ichimoku OscillatorFans of the Ichimoku cloud indicator may enjoy this lower study version.
It's all the exact same representation but the cloud is converted to an oscillation in histogram or classic cloud fill formats.
All of the original lines, except Kumo cloud lines, are provided but adjusted to be positionally accurate to the oscillation values.
The oscillation value is calculated simply by absolute subtraction of span a and b lines and as such become an additional width detection mechanism in what I consider to be a slightly cleaner display.
Since the entire cloud can be removed from the main chart, it's necessary to understand price location relative to the values which is calculated and displayed as the 'Price' plot. It is positionally accurate to the oscillation and cross signals can be observed.
My hope is that this serves as a foundation for others to create interesting Ichimoku lower study indicators, and to provide relief to traders looking for cleaner main charts.
I've done my best to ensure accuracy but if any issues are found please let me know.
Feedback and suggestions are welcome, enjoy.
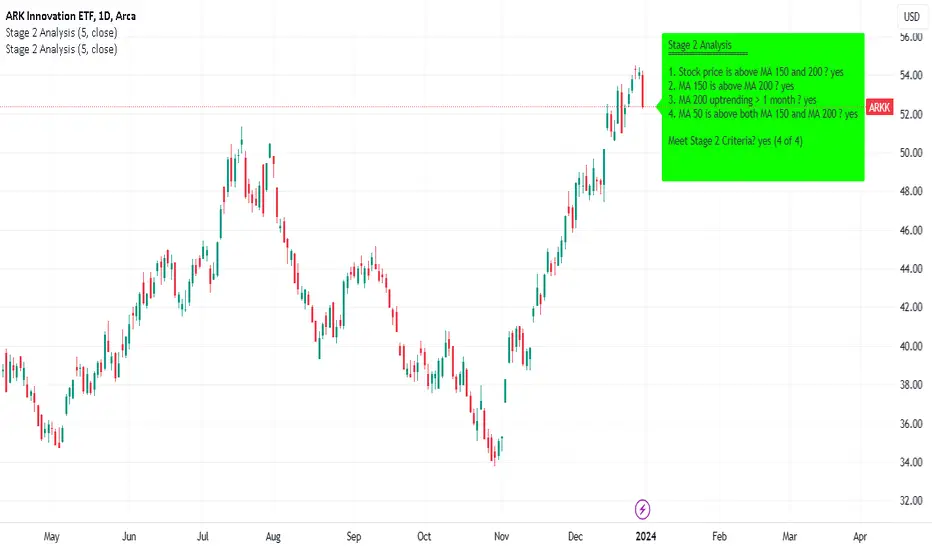
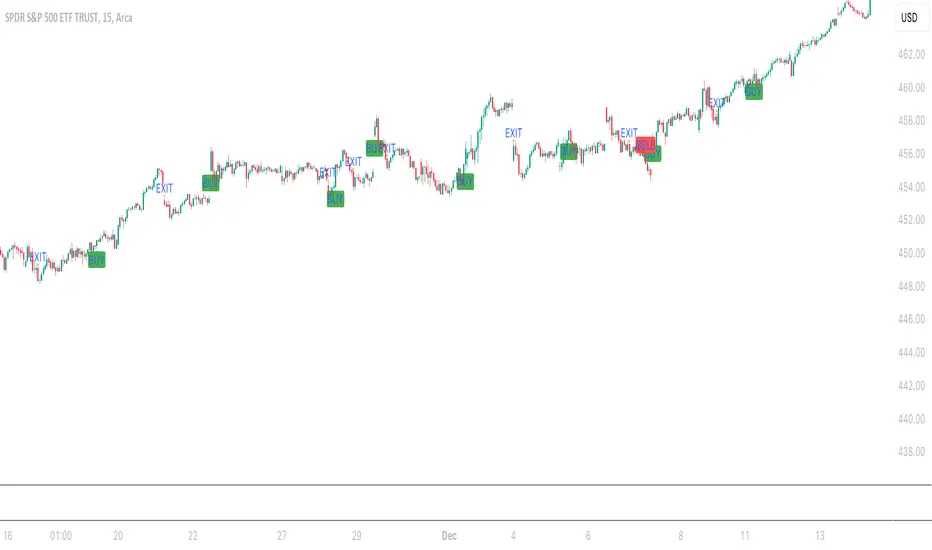
Minervini Stage 2 AnalysisHandbook for Minervini Stage 2 Analysis Indicator
Introduction
This handbook provides detailed instructions and guidelines for using the Minervini Stage 2 Analysis Indicator based on Mark Minervini's swing trading methodology. This indicator is designed for traders focusing on US stocks, aiming to capture gains in medium to short-term uptrends (swing trading).
Understanding Stage 2
Stage 2 represents a bullish uptrend in a stock's price. Mark Minervini emphasizes entering long positions during this phase. The stage is identified using four key criteria related to moving averages (MAs).
Indicator Criteria
Stock Price Above MA 150 and 200: Indicates an overall uptrend.
MA 150 Above MA 200: Signals a stronger medium-term trend compared to the long-term trend.
MA 200 Trending Up for At Least 1 Month (22 Days): Confirms a stable uptrend.
MA 50 Above Both MA 150 and 200: Shows short-term strength and momentum.
Using the Indicator
Entering Trades: Consider long positions when all four criteria are met. This signifies that the stock is in a Stage 2 uptrend.
Monitoring Trades: Regularly check if the stock continues to meet these criteria. The indicator provides a clear visual and textual representation for ease of monitoring.
Alarm Signals and Exit Strategy
One Criterion Not Met: This serves as an alarm signal. Increased vigilance is required, and traders should prepare for a potential exit.
Two Criteria Not Met: Strong indication to close the trade. This suggests the stock may be transitioning out of Stage 2, increasing the risk of holding the position.
Risk Management
Stop-Loss Orders: Consider setting a trailing stop-loss to protect profits and minimize losses.
Position Sizing: Adjust position sizes according to your risk tolerance and portfolio strategy.
Volume and Relative Strength Analysis
Volume Analysis: Look for increased trading volume as confirmation when the stock price moves above key MAs.
Relative Strength (RS) Rating: Compare the stock's performance to the broader market to gauge its strength.
Limitations and Considerations
Market Conditions: The indicator's effectiveness may vary with market conditions. It is more reliable in a bullish market environment.
Supplementary Analysis: Combine this indicator with other analysis methods (fundamental, technical) for a holistic approach.
Continuous Learning: Stay updated with market trends and adjust your strategy accordingly.
Conclusion
The Minervini Stage 2 Analysis Indicator is a powerful tool for identifying potential long positions in uptrending stocks. Its reliance on specific criteria aligns with Mark Minervini's proven swing trading strategy. However, always exercise due diligence and risk management in your trading decisions.
The Flash-Strategy with Minervini Stage Analysis QualifierThe Flash-Strategy (Momentum-RSI, EMA-crossover, ATR) with Minervini Stage Analysis Qualifier
Introduction
Welcome to a comprehensive guide on a cutting-edge trading strategy I've developed, designed for the modern trader seeking an edge in today's dynamic markets. This strategy, which I've honed through my years of experience in the trading arena, stands out for its unique blend of technical analysis and market intuition, tailored specifically for use on the TradingView platform.
As a trader with a deep passion for the financial markets, my journey began several years ago, driven by a relentless pursuit of a trading methodology that is both effective and adaptable. My background in trading spans various market conditions and asset classes, providing me with a rich tapestry of experiences from which to draw. This strategy is the culmination of that journey, embodying the lessons learned and insights gained along the way.
The cornerstone of this strategy lies in its ability to generate precise long signals in a Stage 2 uptrend and equally accurate short signals in a Stage 4 downtrend. This approach is rooted in the principles of trend following and momentum trading, harnessing the power of key indicators such as the Momentum-RSI, EMA Crossover, and Average True Range (ATR). What sets this strategy apart is its meticulous design, which allows it to adapt to the ever-changing market conditions, providing traders with a robust tool for navigating both bullish and bearish scenarios.
This strategy was born out of a desire to create a trading system that is not only highly effective in identifying potential trade setups but also straightforward enough to be implemented by traders of varying skill levels. It's a reflection of my belief that successful trading hinges on clarity, precision, and disciplined execution. Whether you are a seasoned trader or just beginning your journey, this guide aims to provide you with a comprehensive understanding of how to harness the full potential of this strategy in your trading endeavors.
In the following sections, we will delve deeper into the mechanics of the strategy, its implementation, and how to make the most out of its features. Join me as we explore the nuances of a strategy that is designed to elevate your trading to the next level.
Stage-Specific Signal Generation
A distinctive feature of this trading strategy is its focus on generating long signals exclusively during Stage 2 uptrends and short signals during Stage 4 downtrends. This approach is based on the widely recognized market cycle theory, which divides the market into four stages: Stage 1 (accumulation), Stage 2 (uptrend), Stage 3 (distribution), and Stage 4 (downtrend). By aligning the signal generation with these specific stages, the strategy aims to capitalize on the most dynamic and clear-cut market movements, thereby enhancing the potential for profitable trades.
1. Long Signals in Stage 2 Uptrends
• Characteristics of Stage 2: Stage 2 is characterized by a strong uptrend, where prices are consistently rising. This stage typically follows a period of accumulation (Stage 1) and is marked by increased investor interest and bullish sentiment in the market.
• Criteria for Long Signal Generation: Long signals are generated during this stage when the technical indicators align with the characteristics of a Stage 2 uptrend.
• Rationale for Stage-Specific Signals: By focusing on Stage 2 for long trades, the strategy seeks to enter positions during the phase of strong upward momentum, thus riding the wave of rising prices and investor optimism. This stage-specific approach minimizes exposure to less predictable market phases, like the consolidation in Stage 1 or the indecision in Stage 3.
2. Short Signals in Stage 4 Downtrends
• Characteristics of Stage 4: Stage 4 is identified by a pronounced downtrend, with declining prices indicating prevailing bearish sentiment. This stage typically follows the distribution phase (Stage 3) and is characterized by increasing selling pressure.
• Criteria for Short Signal Generation: Short signals are generated in this stage when the indicators reflect a strong bearish trend.
• Rationale for Stage-Specific Signals: Targeting Stage 4 for shorting capitalizes on the market's downward momentum. This tactic aligns with the natural market cycle, allowing traders to exploit the downward price movements effectively. By doing so, the strategy avoids the potential pitfalls of shorting during the early or late stages of the market cycle, where trends are less defined and more susceptible to reversals.
In conclusion, the strategy’s emphasis on stage-specific signal generation is a testament to its sophisticated understanding of market dynamics. By tailoring the long and short signals to Stages 2 and 4, respectively, it leverages the most compelling phases of the market cycle, offering traders a clear and structured approach to aligning their trades with dominant market trends.
Strategy Overview
At the heart of this trading strategy is a philosophy centered around capturing market momentum and trend efficiency. The core objective is to identify and capitalize on clear uptrends and downtrends, thereby allowing traders to position themselves in sync with the market's prevailing direction. This approach is grounded in the belief that aligning trades with these dominant market forces can lead to more consistent and profitable outcomes.
The strategy is built on three foundational components, each playing a critical role in the decision-making process:
1. Momentum-RSI (Relative Strength Index): The Momentum-RSI is a pivotal element of this strategy. It's an enhanced version of the traditional RSI, fine-tuned to better capture the strength and velocity of market trends. By measuring the speed and change of price movements, the Momentum-RSI provides invaluable insights into whether a market is potentially overbought or oversold, suggesting possible entry and exit points. This indicator is especially effective in filtering out noise and focusing on substantial market moves.
2. EMA (Exponential Moving Average) Crossover: The EMA Crossover is a crucial component for trend identification. This strategy employs two EMAs with different timeframes to determine the market trend. When the shorter-term EMA crosses above the longer-term EMA, it signals an emerging uptrend, suggesting a potential long entry. Conversely, a crossover below indicates a possible downtrend, hinting at a short entry opportunity. This simple yet powerful tool is key in confirming trend directions and timing market entries.
3. ATR (Average True Range): The ATR is instrumental in assessing market volatility. This indicator helps in understanding the average range of price movements over a given period, thus providing a sense of how much a market might move on a typical day. In this strategy, the ATR is used to adjust stop-loss levels and to gauge the potential risk and reward of trades. It allows for more informed decisions by aligning trade management techniques with the current volatility conditions.
The synergy of these three components – the Momentum-RSI, EMA Crossover, and ATR – creates a robust framework for this trading strategy. By combining momentum analysis, trend identification, and volatility assessment, the strategy offers a comprehensive approach to navigating the markets. Whether it's capturing a strong trend in its early stages or identifying a potential reversal, this strategy aims to provide traders with the tools and insights needed to make well-informed, strategically sound trading decisions.
Detailed Component Analysis
The efficacy of this trading strategy hinges on the synergistic functioning of its three key components: the Momentum-RSI, EMA Crossover, and Average True Range (ATR). Each component brings a unique perspective to the strategy, contributing to a well-rounded approach to market analysis.
1. Momentum-RSI (Relative Strength Index)
• Definition and Function: The Momentum-RSI is a modified version of the classic Relative Strength Index. While the traditional RSI measures the velocity and magnitude of directional price movements, the Momentum-RSI amplifies aspects that reflect trend strength and momentum.
• Significance in Identifying Trend Strength: This indicator excels in identifying the strength behind a market's move. A high Momentum-RSI value typically indicates strong bullish momentum, suggesting the potential continuation of an uptrend. Conversely, a low Momentum-RSI value signals strong bearish momentum, possibly indicative of an ongoing downtrend.
• Application in Strategy: In this strategy, the Momentum-RSI is used to gauge the underlying strength of market trends. It helps in filtering out minor fluctuations and focusing on significant movements, providing a clearer picture of the market's true momentum.
2. EMA (Exponential Moving Average) Crossover
• Definition and Function: The EMA Crossover component utilizes two exponential moving averages of different timeframes. Unlike simple moving averages, EMAs give more weight to recent prices, making them more responsive to new information.
• Contribution to Market Direction: The interaction between the short-term and long-term EMAs is key to determining market direction. A crossover of the shorter EMA above the longer EMA is an indicator of an emerging uptrend, while a crossover below signals a developing downtrend.
• Application in Strategy: The EMA Crossover serves as a trend confirmation tool. It provides a clear, visual representation of the market's direction, aiding in the decision-making process for entering long or short positions. This component ensures that trades are aligned with the prevailing market trend, a crucial factor for the success of the strategy.
3. ATR (Average True Range)
• Definition and Function: The ATR is an indicator that measures market volatility by calculating the average range between the high and low prices over a specified period.
• Role in Assessing Market Volatility: The ATR provides insights into the typical market movement within a given timeframe, offering a measure of the market's volatility. Higher ATR values indicate increased volatility, while lower values suggest a calmer market environment.
• Application in Strategy: Within this strategy, the ATR is instrumental in tailoring risk management techniques, particularly in setting stop-loss levels. By accounting for the market's volatility, the ATR ensures that stop-loss orders are placed at levels that are neither too tight (risking premature exits) nor too loose (exposing to excessive risk).
In summary, the combination of Momentum-RSI, EMA Crossover, and ATR in this trading strategy provides a comprehensive toolkit for market analysis. The Momentum-RSI identifies the strength of market trends, the EMA Crossover confirms the market direction, and the ATR guides in risk management by assessing volatility. Together, these components form the backbone of a strategy designed to navigate the complexities of the financial markets effectively.
1. Signal Generation Process
• Combining Indicators: The strategy operates by synthesizing signals from the Momentum-RSI, EMA Crossover, and ATR indicators. Each indicator serves a specific purpose: the Momentum-RSI gauges trend momentum, the EMA Crossover identifies the trend direction, and the ATR assesses the market’s volatility.
• Criteria for Signal Validation: For a signal to be considered valid, it must meet specific criteria set by each of the three indicators. This multi-layered approach ensures that signals are not only based on one aspect of market behavior but are a result of a comprehensive analysis.
2. Conditions for Long Positions
• Uptrend Confirmation: A long position signal is generated when the shorter-term EMA crosses above the longer-term EMA, indicating an uptrend.
• Momentum-RSI Alignment: Alongside the EMA crossover, the Momentum-RSI should indicate strong bullish momentum. This is typically represented by the Momentum-RSI being at a high level, confirming the strength of the uptrend.
• ATR Consideration: The ATR is used to fine-tune the entry point and set an appropriate stop-loss level. In a low volatility scenario, as indicated by the ATR, the stop-loss can be set tighter, closer to the entry point.
3. Conditions for Short Positions
• Downtrend Confirmation: Conversely, a short position signal is indicated when the shorter-term EMA crosses below the longer-term EMA, signaling a downtrend.
• Momentum-RSI Confirmation: The Momentum-RSI should reflect strong bearish momentum, usually seen when the Momentum-RSI is at a low level. This confirms the bearish strength of the market.
• ATR Application: The ATR again plays a role in determining the stop-loss level for the short position. Higher volatility, as indicated by a higher ATR, would warrant a wider stop-loss to accommodate larger market swings.
By adhering to these mechanics, the strategy aims to ensure that each trade is entered with a high probability of success, aligning with the market’s current momentum and trend. The integration of these indicators allows for a holistic market analysis, providing traders with clear and actionable signals for both entering and exiting trades.
Customizable Parameters in the Strategy
Flexibility and adaptability are key features of this trading strategy, achieved through a range of customizable parameters. These parameters allow traders to tailor the strategy to their individual trading style, risk tolerance, and specific market conditions. By adjusting these parameters, users can fine-tune the strategy to optimize its performance and align it with their unique trading objectives. Below are the primary parameters that can be customized within the strategy:
1. Momentum-RSI Settings
• Period: The lookback period for the Momentum-RSI can be adjusted. A shorter period makes the indicator more sensitive to recent price changes, while a longer period smoothens the RSI line, offering a broader view of the momentum.
• Overbought/Oversold Thresholds: Users can set their own overbought and oversold levels, which can help in identifying extreme market conditions more precisely according to their trading approach.
2. EMA Crossover Settings
• Timeframes for EMAs: The strategy uses two EMAs with different timeframes. Traders can modify these timeframes, choosing shorter periods for a more responsive approach or longer periods for a more conservative one.
• Source Data: The choice of price data (close, open, high, low) used in calculating the EMAs can be varied depending on the trader’s preference.
3. ATR Settings
• Lookback Period: Adjusting the lookback period for the ATR impacts how the indicator measures volatility. A longer period may provide a more stable but less responsive measure, while a shorter period offers quicker but potentially more erratic readings.
• Multiplier for Stop-Loss Calculation: This parameter allows traders to set how aggressively or conservatively they want their stop-loss to be in relation to the ATR value.
Here are the standard settings:

Aleem Trend Supertrend EMA Title: "Supertrend and 200 EMA Crossover Strategy"
Description:
This script is designed to provide traders with a robust and original trading strategy by combining the Supertrend indicator with a 200-period Exponential Moving Average (EMA). The core concept is to utilize the strengths of both indicators to determine optimal entry and exit points.
The Supertrend indicator is well-regarded for its precision in signaling trend reversals by considering the volatility of the market, as measured by the Average True Range (ATR). It is particularly useful for identifying ongoing trends and potential reversals.
The 200 EMA is a widely-used indicator that many traders look to as a determinant of the long-term trend. When the price is above the 200 EMA, the overall market sentiment is considered bullish, and when below, bearish.
By combining these two, the script generates a Buy signal under the following conditions:
When the Supertrend turns bullish (color changes from red to green) with the closing price above the 200 EMA, or
When the price crosses above the 200 EMA while the Supertrend is already green.
A Sell signal is generated when:
The Supertrend turns bearish (color changes from green to red) with the closing price below the 200 EMA, or
The price crosses below the 200 EMA while the Supertrend is already red.
To avoid repetitive signals and to maintain clarity, the script has been enhanced with a feature to prevent multiple consecutive Buy or Sell signals. Once a Buy or Sell signal is generated, the script will not produce another identical signal until an opposing signal or an exit condition is met.
Exit signals for both Buy and Sell positions are provided to indicate when the trend is weakening or reversing, based on the Supertrend's color change in relation to the 200 EMA.
This strategy is flexible and can be utilized across various time frames and asset classes. It aims to aid traders in making more informed decisions by highlighting potential reversals and continuations in the market trend.
Usage:
To use this script, traders should observe the Buy and Sell signals as potential entry points. Exit signals should be taken as prompts to close positions or to protect profits with stop-loss adjustments. As with all strategies, it's recommended to use this in conjunction with other analysis methods and to backtest thoroughly before live implementation.
ZenTrend Price CyclesZenTrend attempts to plot the cycles that occur as the price cycles between the top and bottom of long- and short-term price linear regression channels.
The indicator observes a fast (35-period) and a slow (100-period) linear regression channel and plots their slopes on an oscillator. When the slope of the fast channel crosses above or below the slope of the slow channel, a signal is plotted.
The red line is the slope of the fast channel; blue is the slope of the slow channel
A green dot and background indicates the slope of recent price action has crossed above the slope of long-term price action.
A red dot and background indicates the slope of recent price action has crossed below the slope of long-term price action.
A gray dot indicates the slope of recent price action is slowing. The difference between the long- and short-term slopes is narrowing.
Here are things I look for when observing price cycles
Where does the cross occur? Crosses high above or below the 'zero line' indicate a more extreme change in price channel slopes.
Flat line: crosses that occur while the lines are flat often indicate chop.
"Curve" of the line - a cross that occurs as the slope lines are starting to curve up/down indicates a sharper and more extreme change in price channel slope.

Donchian Channels %I enjoy Donchian Channels for identifying trends. However, I hate having them on my chart. They are next to impossible to interpret at a glance. This script converts DCs to a % making a useful oscillator. The horizontal lines on the chart correspond to the Fib retracements below 50%. There are many ways to trade using this script and it works on any time frame. Moving average crosses are worth your attention, particularly, the 34 period MA (purple line). Enjoy and happy trading.
Optimized Alligator RateA less conventional way of utilizing the "Williams Alligator," the Optimized Rate uses the rate of change of the averages within the Alligator in order to potentially forecast with greater accuracy. The true optimization comes from the calculation of the "McGinley Dynamic" to create zero lag smoothed moving averages. It's important to note the standard Alligator has always used the SMMA. Lastly, divergence between the rates has been calculated in plotting for clarification.

Catching Trend Reversals by shorting tops and buying bottomsHOLP (High of the low period) and LOHP (Low of the high period)
Catching Trend Reversals by shorting tops and buying bottoms
using this Swing High/Low Indicator
Trading Strategy comes from Mastering the Trade, by John Carter pg 300.
Trading Rules for Sells, Buys are reversed
1. Identifying a trending market, where today's price is making a 20-day high (17-18 day highs are also fine)
Note this is configurable by setting the trending period variable (defaults to 20)
For example if price is making a 20 period high or 20 period low, it will show a triangle up/down above the candle.
2. Identify the high bar in the uptrend
3. Go short once the price action closes below the low of this high bar
4. The initial stop is the high of the high bar.
5. If you are in the trade on the third day or period, use a 2 bar trailing stop.
You can check 2-bar trailing stop to draw the line, defaults to off.
Stop is indicated by the white dot.
Code Converted from TradeStation EasyLanguage
I can't find the original source anymore for the swing high/low plots, but if someone knows,
let me know and I'll credit here.

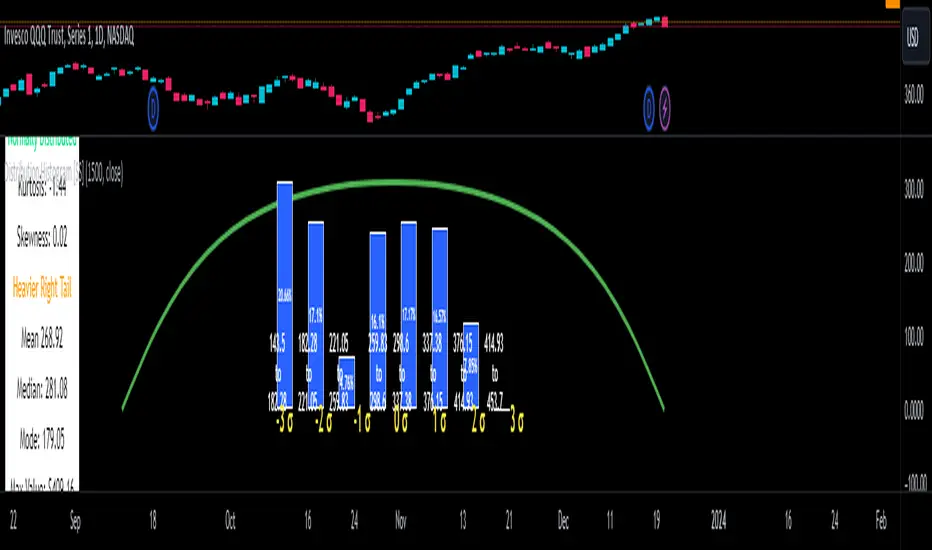
Distribution Histogram [SS]This is the frequency histogram indicator. It does just that—creates a frequency histogram distribution based on your desired lookback period. It then uses Pine's new Polyline function to plot a normal curve of the expected results for a normal distribution. This allows you to see quite a few things:
🎯 Firstly, it allows you to see where the accumulation rests in terms of a bell curve. The histogram represents a bell curve, and you can visually observe what the curve would look like.
🎯 Secondly, it will assess the normal distribution and the degree of skewness based on the curve itself. The indicator imports the SPTS statistics library to assess the distribution using Kurtosis and Skewness. However, it also adds functionality in this regard by making a qualitative assessment of the data. For example, if there are heavy left tails or heavier right tails present in the histogram, the indicator will alert you that a heavier left or right tail has been observed.
🎯 Thirdly, it provides you with the kurtosis and skewness of the dataset.
🎯 Fourthly, it provides the mean, median, and mode of the dataset, as well as the maximum and minimum values within the dataset.
🎯 Lastly, it provides you with the ability to toggle on tips/explanations of the curve itself. Simply toggle on "Show Distribution Explanation" in the settings menu:
How is the indicator helpful for trading?
If you are a mean reversion trader, this helps you identify the areas and price ranges of high and low accumulation. It also allows you to ascertain the probability by looking at the standard deviation of the bell curve. Remember, the majority of values should fall between -1 and 1 standard deviation of the mean (68%).
If it is revealed that the distribution has a heavier right or left tail, you will know that the stock is more likely to experience sudden drops and shifts in the curve in one direction or the other. Heavier left tails will tend to shift to the values on the far left, and vice versa for right tails.
Customization
You can turn off and on the following:
👉 The normal curve,
👉 The standard deviation levels, and
👉 The distribution explanations and tips.
Conclusion: And that is the indicator! Hope you enjoy it!
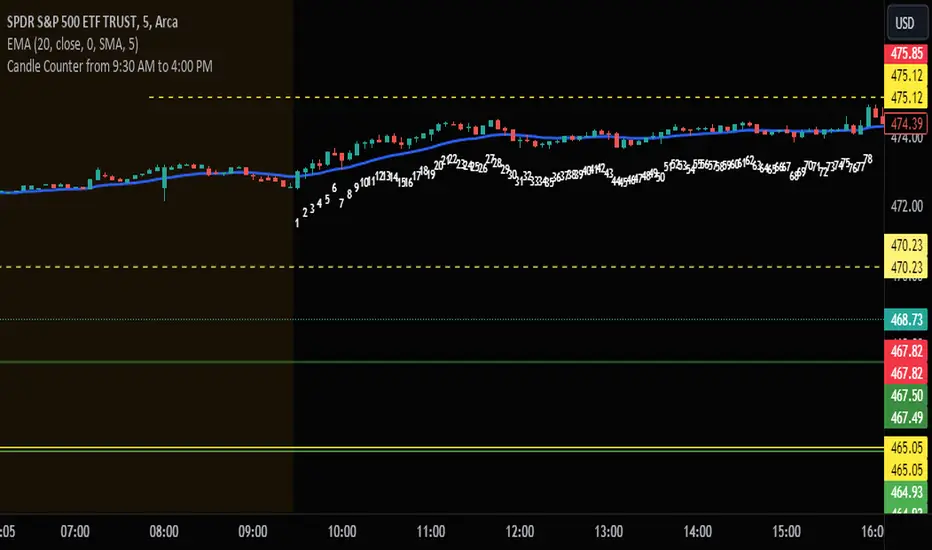
Candle Counter from 9:30 AM to 4:00 PMThis Pine Script, designed for TradingView, serves as a candle counter exclusively for a 5-minute chart. It operates within the specific market hours of 9:30 AM to 4:00 PM. Key features of the script include:
Market Hours Specification: The script is configured to track candles only during the trading hours from 9:30 AM to 4:00 PM.
Daily Reset: Each trading day, the candle counter resets, starting anew from the market opening at 9:30 AM.
Candle Counting: It increments a counter with each 5-minute candle during the specified market hours.
Label Display: The counter number for each candle is displayed as a label at the candle's low point. This label is in bright white color with large font size, ensuring clear visibility against various chart backgrounds.
5-Minute Chart Specificity: The script is tailored to function only when the chart is set to a 5-minute timeframe, making it ideal for traders focusing on intraday movements.
New Day Detection: Utilizes a function to identify the start of a new trading day, ensuring accurate daily counting.
This script is particularly useful for traders who focus on intraday trading within the standard stock market hours, providing a clear and easy-to-read candle count that resets daily.