Cerca negli script per "南方标普中国A股大盘红利低波50指数成分股行业分布及权重"

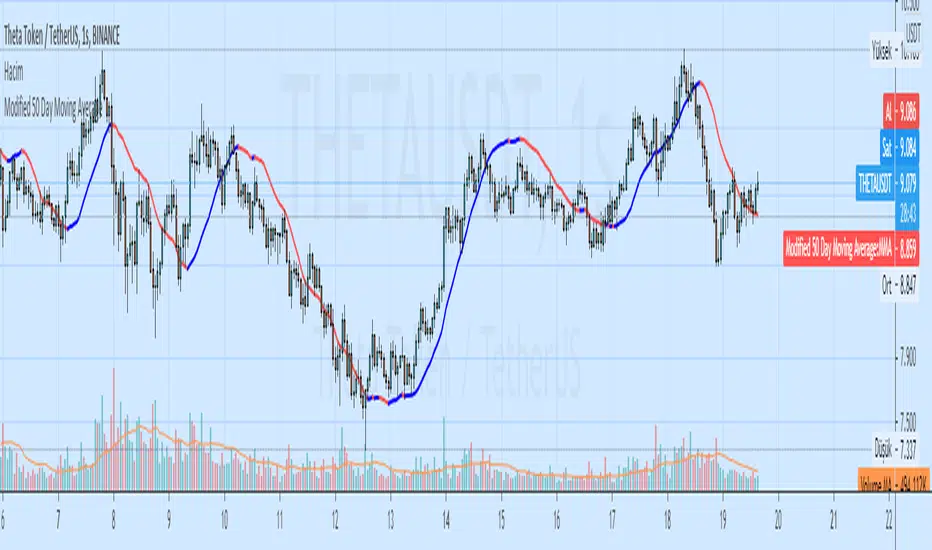
50-100-200 Day SMAA simple indicator that display the 50, 100, and 200 Daily SMA. It will always display the DAILY 50,100, 200, regardless of the time frame you are looking at. Makes it easy to quickly display these key averages while also looking at smaller timeframes like 1H candles.

Daily 50‑ & 200‑SMA Ceiling Radar — EnhancedDescription:
This custom TradingView indicator, developed by Trader Malik and licensed under Trades Per Minute, is a powerful visual tool for identifying how price behaves relative to major daily moving averages — the 50-SMA and 200-SMA. It helps traders quickly understand key technical dynamics such as trend alignment, MA proximity, and short-term momentum sentiment — all displayed on a clean, minimal overlay with visual alerts and an adjustable data table.
FEATURES
1. Daily 50 & 200 Simple Moving Averages (SMA):**
- Displayed directly on the chart using distinct blue and orange lines.
- These serve as primary trend filters and support/resistance zones.
2. Price Highlighting:
- A red background flashes momentarily when the price crosses either the 50-SMA or 200-SMA.
- A green background fills the chart when price is above both MAs (bullish zone).
- A red background persists if price is below both MAs (bearish zone).
3. MA Gap Analysis Table:
- 50-SMA Row**: Shows % gap between 50-SMA and 200-SMA.
- 200-SMA Row**: Shows % gap between 200-SMA and 50-SMA.
- Sentiment Row**: Displays short-term trend bias based on the slope of the past 7 daily closes — Bullish, Neutral, or Bearish.
USER SETTINGS
Table Location: Choose between **Top Right** or **Bottom Right** of the chart.
Table Size: Select **Small**, **Medium**, or **Large** to suit screen preferences and layout aesthetics.
This script is **intellectual property of Trades Per Minute** and distributed by **Trader Malik** for use under licensing terms. Redistribution or repurposing without authorization is strictly prohibited.

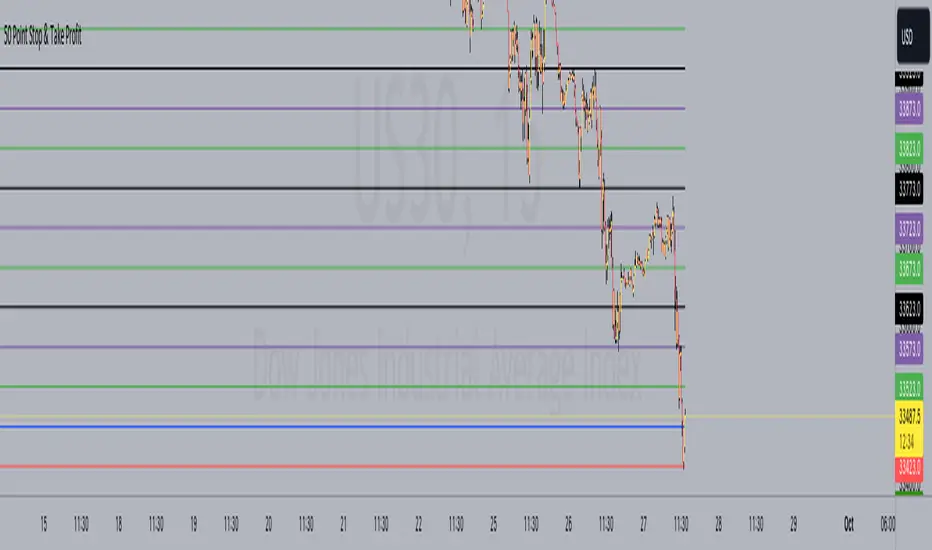
50 Point Stop & Take Profit**50 Point Stop & Take Profit**
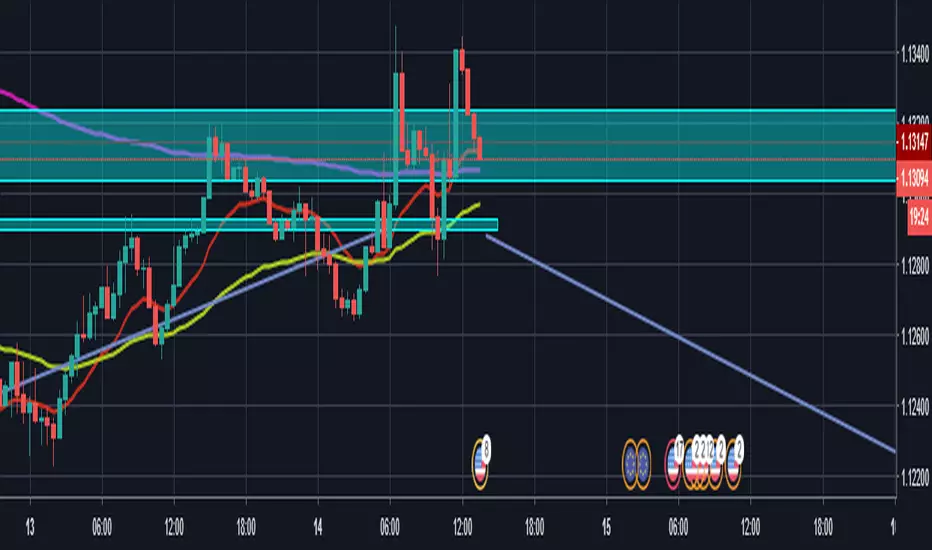
This custom TradingView indicator is designed for instruments like US30 or any asset following a point system. It assists traders in setting precise stop-loss and take-profit levels based on different risk-reward ratios. It calculates and plots horizontal lines at various price levels above and below your specified entry price, with a 50-point difference between each ratio.
**How It Benefits Your Strategy:**
- Each risk-reward ratio, whether it's 1:1, 2:1, 3:1, and so on, is separated by precisely 50 points. This deliberate spacing is tailored to provide you with clear and consistent reference points for managing trades in instruments using a point-based system.
- The 50-point increments make it easy to adjust your positions, ensuring that your risk and reward levels align with your trading strategy and objectives.
**Usage:**
1. Set your desired entry price using the "Entry Price" input.
2. The indicator is ideally suited for instruments like US30, where each point represents a distinct price movement. It will automatically calculate and plot multiple lines at the following levels, both for Long (L) and Short (S) positions:
- 1:1 Risk-Reward Ratio (±50 points)
- 2:1 Risk-Reward Ratio (±100 points)
- 3:1 Risk-Reward Ratio (±150 points)
- 4:1 Risk-Reward Ratio (±200 points)
- 5:1 Risk-Reward Ratio (±250 points)
- 6:1 Risk-Reward Ratio (±300 points)
- 7:1 Risk-Reward Ratio (±350 points)
- 8:1 Risk-Reward Ratio (±400 points)
- 9:1 Risk-Reward Ratio (±450 points)
- 10:1 Risk-Reward Ratio (±500 points)
**Customization Options:**
- **Alerts:** You can set alerts for each level to receive notifications when the price reaches a specific risk-reward ratio.
- **Color Customization:** Customize the colors of the plotted lines to suit your chart preferences.
- **Toggle Ratios:** Easily toggle on/off different risk-reward ratios to focus on specific levels that align with your trading strategy.
**How to Use:**
- Use the plotted lines as reference points for setting stop-loss and take-profit orders at your preferred risk-reward ratios.
- The blue horizontal line represents your specified entry price.
This indicator simplifies your trading strategy by providing clear visual cues for managing risk and reward levels, with each level thoughtfully spaced 50 points apart to cater to your strategy's precision.
*Note: Always use risk management and proper trade sizing in your trading strategy.*
**Version:** Pine Script version 5
Triple EMA (20, 50, 200) w/ LabelsI've combined the 20, 50, and 200 day exponential moving averages and added labels.
I created this due to finding EMA scripts that are either nothing but ugly to look at or have extra "features" that serve no purpose.
This gets rid of the clutter and gives a simple triple EMA with labels.
Labels are optional, you can turn them off in the settings.


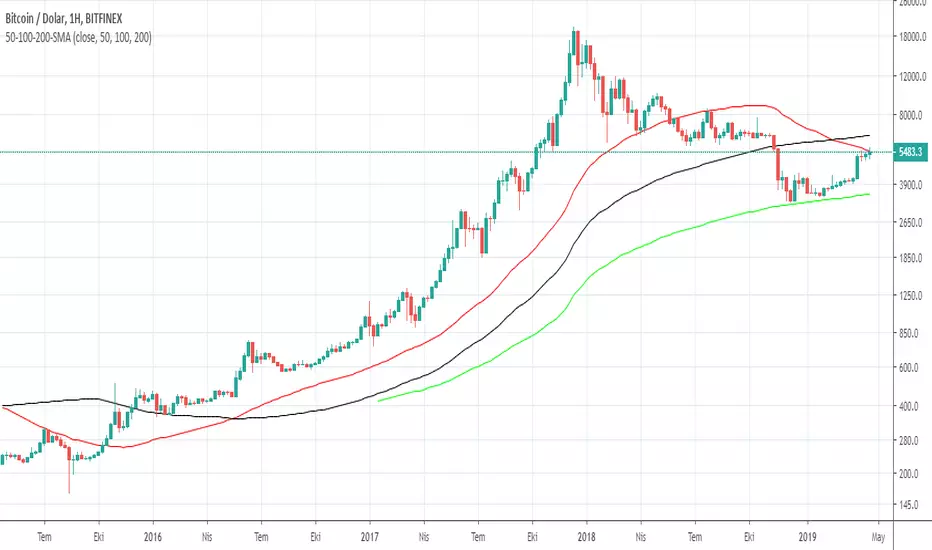
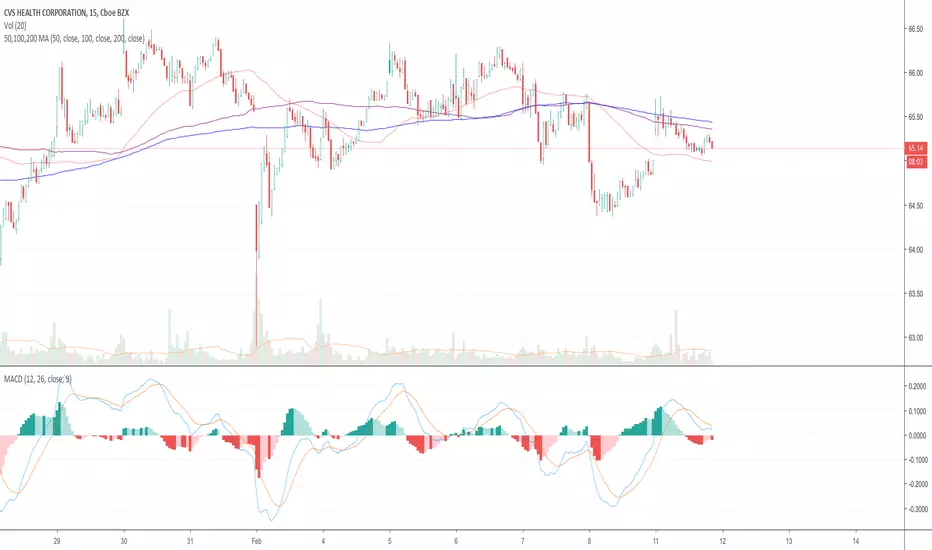
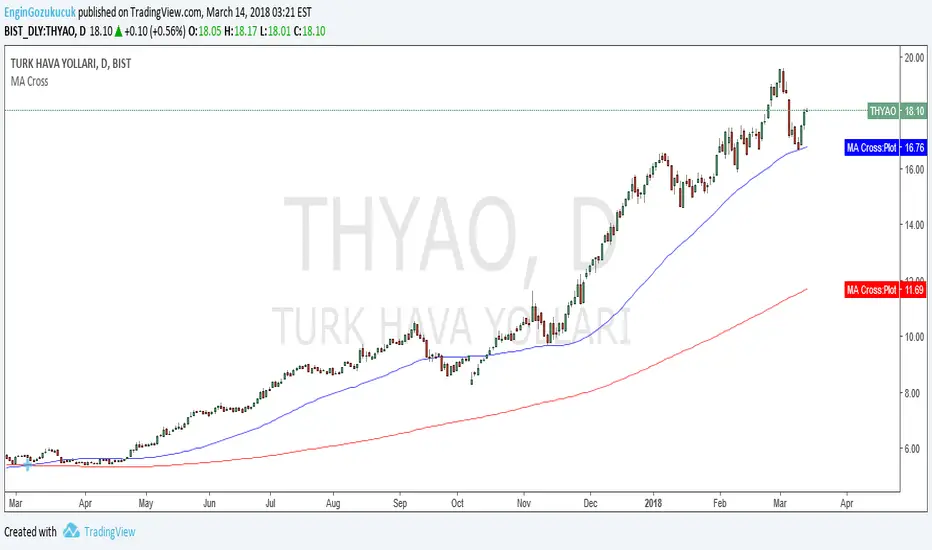
50,100,200 MA50, 100, and 200 simple moving averages in a single indicator. Fixed versions published by other members where 100 and 200 were plotted incorrectly and overlaying each other. Also removed close plot.

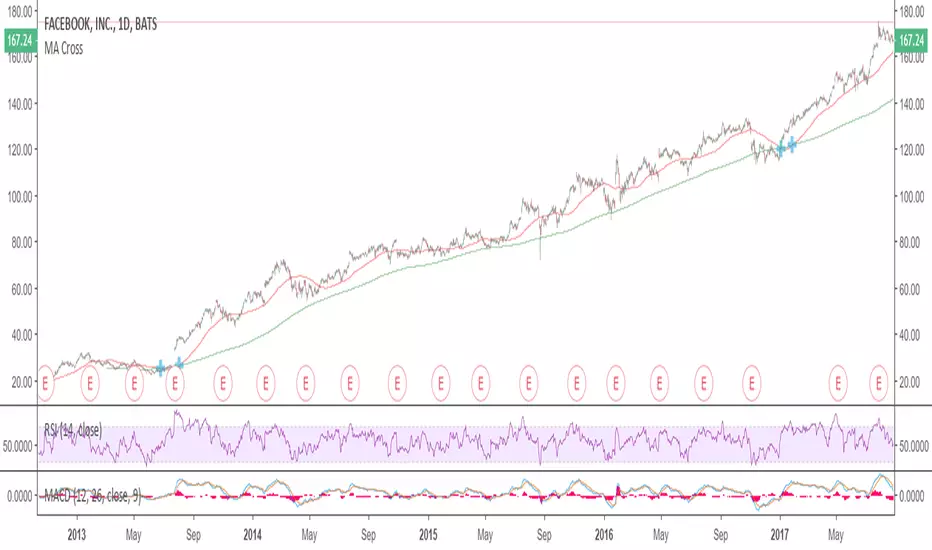


50/100 EMA Crossover with Candle Confirmation📘 **50/100 EMA Crossover with Candle Confirmation – Strategy Description**
The **50/100 EMA Crossover with Candle Confirmation** is a trend-following strategy designed to filter high-probability entries by combining exponential moving average (EMA) crossovers with strong price action confirmation. This strategy aims to reduce false signals commonly associated with EMA-only systems by requiring a **candle close confirmation in the direction of the trend**, making it more reliable for intraday or swing trading across Forex, crypto, and stock markets.
---
### 🔍 **Core Logic**
* The strategy is based on the interaction of the **50 EMA** (fast-moving average) and the **100 EMA** (slow-moving average).
* **Trend direction** is determined by the crossover:
* **Bullish Trend**: When the 50 EMA crosses **above** the 100 EMA.
* **Bearish Trend**: When the 50 EMA crosses **below** the 100 EMA.
* To **filter out false breakouts**, a **candle confirmation** is used:
* For a **Buy signal**: After a bullish crossover, wait for a strong bullish candle (e.g., full-body green candle) to **close above both EMAs**.
* For a **Sell signal**: After a bearish crossover, wait for a strong bearish candle to **close below both EMAs**.
---
### ✅ **Entry Conditions**
**Buy Entry:**
* 50 EMA crosses above 100 EMA.
* Latest candle closes **above both EMAs**.
* Candle must be bullish (green/full body preferred).
**Sell Entry:**
* 50 EMA crosses below 100 EMA.
* Latest candle closes **below both EMAs**.
* Candle must be bearish (red/full body preferred).
---
### 🛑 **Exit or Take-Profit Options**
* **Fixed TP/SL**: 1:2 or 1:3 risk-reward.
* **Trailing Stop**: Based on recent swing highs/lows or ATR.
* **EMA Exit**: Exit trade when the candle closes on the opposite side of 50 EMA.
---
### ⚙️ **Best Settings**
* **Timeframes**: 5M, 15M, 1H, 4H (works well on most).
* **Markets**: Forex, Crypto (e.g., BTC/ETH), Indices (e.g., NASDAQ, NIFTY50).
* **Recommended filters**:
* Use with RSI divergence or volume confirmation.
* Avoid using during high-impact news (especially on lower timeframes).
---
### 🧠 **Why This Works**
The 50/100 EMA crossover provides a **medium-term trend signal**, reducing noise seen in fast EMAs (like 9 or 21). The candle confirmation adds a **momentum filter**, ensuring price supports the directional bias. This makes it suitable for traders who want a balance of trend and entry precision without overcomplicating with too many indicators.
---
### 📈 **Advantages**
* Simple yet effective for identifying trends.
* Filters out fakeouts using candle confirmation.
* Easy to automate in Pine Script or other trading bots.
* Can be combined with support/resistance or SMC zones for better confluence.
---
### ⚠️ **Limitations**
* May lag slightly in ranging markets.
* Late entries possible due to confirmation candle.
* Works best with additional volume or volatility filter.

EMA Crossover with 50 EMA Filter50-period EMA: We added the 50-period EMA as the filterEMA variable.
Buy and Sell Conditions: The buy signal is generated only if the 8-period and 16-period EMAs both cross above each other and are above the 50-period EMA. Similarly, the sell signal is generated when the 8-period and 16-period EMAs cross below each other and are below the 50-period EMA.
Plotting: The 50-period EMA is also plotted on the chart (in orange).
This strategy will ensure that the buy signals are only triggered when the trend is considered "bullish" (both EMAs above the 50 EMA) and sell signals when the trend is "bearish" (both EMAs below the 50 EMA).
You can set up alerts for both buy and sell conditions using the alertcondition() function.
Let me know if you need further adjustments!
NOTE :- Applicable only for banknifty

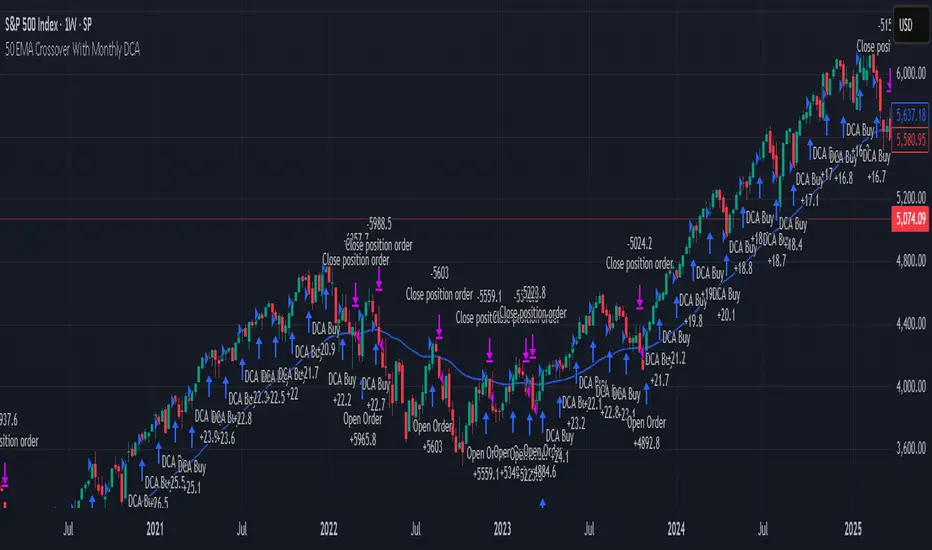
50 EMA Crossover With Monthly DCARecommended Chart Interval = 1W
Overview:
This strategy combines trend-following principles with dollar-cost averaging (DCA), aiming to efficiently deploy capital while minimizing market timing risk.
How It Works:
When the Long Condition is Not Met (i.e., Price < 50 EMA):
- If the price is below the 50 EMA, a fixed DCA amount is added to a cash reserve every month.
- This ensures that capital is consistently accumulated, even when the strategy isn't in a long position.
When the Long Condition is Met (i.e., Price > 50 EMA):
- A long position is opened when the price is above the 50 EMA.
- At this point, the entire capital, including the accumulated cash reserve, is deployed into the market.
- While the strategy is long, a DCA buy order is placed every month using the set DCA amount, continuously investing as the market conditions allow.
Exit Strategy:
If the price falls below the 50 EMA, the strategy closes all positions, and the cash reserve accumulation process begins again.
Key Benefits:
✔ Systematic Investing: Ensures consistent capital deployment while following trend signals.
✔ Cash Efficiency: Accumulates uninvested funds when conditions aren’t met and deploys them at optimal moments.
✔ Risk Management: Exits when the price trend weakens, protecting capital.
Conclusion:
This method allows for efficient capital growth by combining a trend-following approach with disciplined DCA, ensuring risk is managed while capital is deployed systematically at optimal points in the market. 🚀
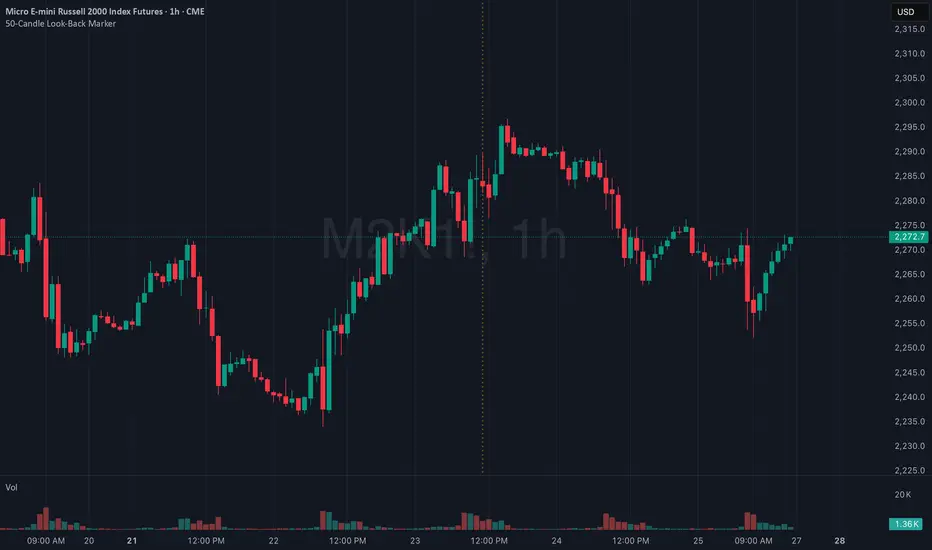
50-Candle Look-Back MarkerIt simply redraws one vertical dotted line that always sits exactly 50 bars behind the current bar, so you can check at a glance that any trend-line you draw has at least 50 candles of data to the right of it.
50 Pips A Day Strategy - Kaspricci50 Pips A Day Strategy
This strategy is designed to work on 1 hour timeframe. It is designed to capture the early market move of major forex pairs like EURUSD or GBPUSD. It takes the high and low of the first candle (7 a.m. GMT, London Stock Exchange opens) and places to pending orders at these prices levels.
High + additional gap in pips = buy stop pending order
Low + additional gap in pips = sell stop pending order
For both orders a stop loss of 15 pips and a take profit of 50 pips is used as a default. As soon as price triggers one pending order, the remaining pending order is cancelled. At the end of the configured session time all open and pending orders are closed / cancelled.
Settings
Trading Time - start and end time of session. It is configured for Monday to Friday only. At the beginning the first candle is used to define stop prices for pending orders.
Source for Buy Stop order - Default: high. Used to calculate buy stop order. You can add additional pips as a gap.
Source for Sell Stop order - Default: low. Used to calculate sell stop order. You can add additional pips as a gap.
Stop Loss in Pips - Default: 15. Used for both pending orders.
Take Profit in Pips - Default: 50. Used for both pending orders.
This strategy is for educational purposes only! It is not meant to be a financial recommendation.

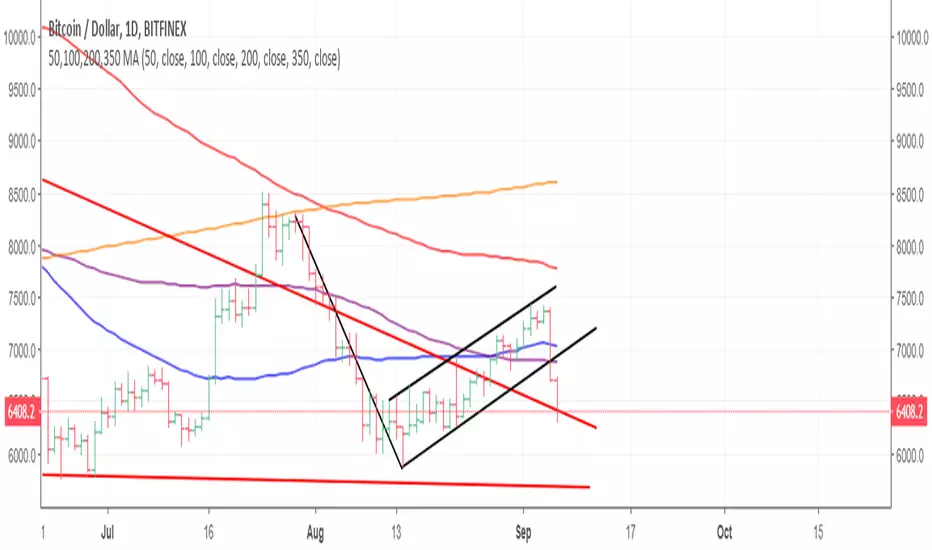
50,100,200,350 MAThis will display the 50, 100 & 200 moving average (MA) on your charts (also known as Simply Moving Average). When looking at these on a daily chart the 350ma is a representation of the 50 week moving average.
Hope this helps
Good Luck
Simon McCabe
Twitter: @simoncmccabe