Double RSIDouble RSI (DRSI) Indicator
The Double RSI (DRSI) is a technical analysis tool designed to provide traders with enhanced buy and sell signals by identifying uptrend and downtrend thresholds. It refines traditional RSI-based signals by applying a "double calculation" to the Relative Strength Index (RSI), improving precision in detecting trend changes.
Key Concepts Behind the Indicator
1. Double RSI Calculation
The DRSI indicator takes the standard RSI (calculated using the closing price over a specified length) and applies a second RSI calculation to it. This creates a smoother, more refined RSI value, making it more effective at highlighting the general trend of the market.
RSI: Measures the strength of recent price movements, ranging from 0 to 100.
Double RSI (DRSI): Applies the RSI formula to the RSI values themselves, smoothing out fluctuations and generating clearer signals.
How Does the Indicator Work?
The DRSI identifies uptrends and downtrends using two user-defined thresholds:
Uptrend Threshold (Default = 59): A value above this threshold signals a potential shift into an uptrend.
Downtrend Threshold (Default = 52): A value below this threshold signals a potential shift into a downtrend.
Signal Generation
Buy Signal: A crossover occurs when the DRSI value crosses above the Downtrend Threshold, signaling the beginning of an upward movement.
Sell Signal: A crossunder occurs when the DRSI value crosses below the Uptrend Threshold, signaling the beginning of a downward movement.
Customizable Inputs
The indicator offers customizable settings for increased flexibility:
DRSI Length (Default = 13): Determines the lookback period for RSI calculations. A shorter length increases sensitivity, while a longer length smooths the signals.
Uptrend Threshold (Default = 59): Sets the level above which an uptrend is confirmed.
Downtrend Threshold (Default = 52): Sets the level below which a downtrend is confirmed.
Bar Color and Glow Effects: Traders can enable colored candles or glowing DRSI lines for better visual representation.
Why is This Indicator Useful for Traders?
1. Noise Reduction
By applying a second RSI calculation, the DRSI smooths out minor fluctuations and highlights the overall trend.
2. Clear Uptrend and Downtrend Signals
The indicator provides intuitive buy (green arrow) and sell (red arrow) markers, simplifying decision-making.
3. Customizable Thresholds
Traders can adjust the thresholds and length to better suit specific trading strategies or market conditions.
4. Bar Coloring
Bars are color-coded to indicate the trend:
Green (Above Uptrend Threshold): Indicates an uptrend.
Red (Below Downtrend Threshold): Indicates a downtrend.
How the Indicator Appears on the Chart
DRSI Line: A smooth line derived from the double RSI calculation.
Threshold Lines: Two horizontal lines (green for the Uptrend Threshold, red for the Downtrend Threshold) to visualize trend changes.
Colored Candles: Candlesticks dynamically change color based on the trend direction (green for uptrends, red for downtrends).
Buy/Sell Markers:
Buy Signal: A green upward triangle below the bar, marking the start of an uptrend.
Sell Signal: A red downward triangle above the bar, marking the start of a downtrend.
In Summary
The Double RSI (DRSI) indicator is a powerful tool for identifying uptrends and downtrends with:
Smoothed trend detection using double-calculated RSI values.
Clear, actionable buy and sell signals.
Customizable settings to match different trading styles.
By focusing on trend thresholds rather than overbought or oversold levels, the DRSI provides traders with precise, noise-free signals to optimize their trading decisions.
Cerca negli script per "天铭科技RSI指标状态"

Global Index Spread RSI StrategyThis strategy leverages the relative strength index (RSI) to monitor the price spread between a global benchmark index (such as AMEX) and the currently opened asset in the chart window. By calculating the spread between these two, the strategy uses RSI to identify oversold and overbought conditions to trigger buy and sell signals.
Key Components:
Global Benchmark Index: The strategy compares the current asset with a predefined global index (e.g., AMEX) to measure relative performance. The choice of a global benchmark allows the trader to analyze the current asset's movement in the context of broader market trends.
Spread Calculation:
The spread is calculated as the percentage difference between the current asset's closing price and the global benchmark index's closing price:
Spread=Current Asset Close−Global Index CloseGlobal Index Close×100
Spread=Global Index CloseCurrent Asset Close−Global Index Close×100
This metric provides a measure of how the current asset is performing relative to the global index. A positive spread indicates the asset is outperforming the benchmark, while a negative spread signals underperformance.
RSI of the Spread: The RSI is then calculated on the spread values. The RSI is a momentum oscillator that ranges from 0 to 100 and is commonly used to identify overbought or oversold conditions in asset prices. An RSI below 30 is considered oversold, indicating a potential buying opportunity, while an RSI above 70 is overbought, suggesting that the asset may be due for a pullback.
Strategy Logic:
Entry Condition: The strategy enters a long position when the RSI of the spread falls below the oversold threshold (default 30). This suggests that the asset may have been oversold relative to the global benchmark and might be due for a reversal.
Exit Condition: The strategy exits the long position when the RSI of the spread rises above the overbought threshold (default 70), indicating that the asset may have become overbought and a price correction is likely.
Visual Reference:
The RSI of the spread is plotted on the chart for visual reference, making it easier for traders to monitor the relative strength of the asset in relation to the global benchmark.
Overbought and oversold levels are also drawn as horizontal reference lines (70 and 30), along with a neutral level at 50 to show market equilibrium.
Theoretical Basis:
The strategy is built on the mean reversion principle, which suggests that asset prices tend to revert to a long-term average over time. When prices move too far from this mean—either being overbought or oversold—they are likely to correct back toward equilibrium. By using RSI to identify these extremes, the strategy aims to profit from price reversals.
Mean Reversion: According to financial theory, asset prices oscillate around a long-term average, and any extreme deviation (overbought or oversold conditions) presents opportunities for price corrections (Poterba & Summers, 1988).
Momentum Indicators (RSI): The RSI is widely used in technical analysis to measure the momentum of an asset. Its application to the spread between the asset and a global benchmark allows for a more nuanced view of relative performance and potential turning points in the asset's price trajectory.
Practical Application:
This strategy works best in markets where relative strength is a key factor in decision-making, such as in equity indices, commodities, or forex markets. By assessing the performance of the asset relative to a global benchmark and utilizing RSI to identify extremes in price movements, the strategy helps traders to make more informed decisions based on potential mean reversion points.
While the "Global Index Spread RSI Strategy" offers a method for identifying potential price reversals based on relative strength and oversold/overbought conditions, it is important to recognize that no strategy is foolproof. The strategy assumes that the historical relationship between the asset and the global benchmark will hold in the future, but financial markets are subject to a wide array of unpredictable factors that can lead to sudden changes in price behavior.
Risk of False Signals:
The strategy relies heavily on the RSI to trigger buy and sell signals. However, like any momentum-based indicator, RSI can generate false signals, particularly in highly volatile or trending markets. In such conditions, the strategy may enter positions too early or exit too late, leading to potential losses.
Market Context:
The strategy may not account for macroeconomic events, news, or other market forces that could cause sudden shifts in asset prices. External factors, such as geopolitical developments, monetary policy changes, or financial crises, can cause a divergence between the asset and the global benchmark, leading to incorrect conclusions from the strategy.
Overfitting Risk:
As with any strategy that uses historical data to make decisions, there is a risk of overfitting the model to past performance. This could result in a strategy that works well on historical data but performs poorly in live trading conditions due to changes in market dynamics.
Execution Risks:
The strategy does not account for slippage, transaction costs, or liquidity issues, which can impact the execution of trades in real-market conditions. In fast-moving markets, prices may move significantly between order placement and execution, leading to worse-than-expected entry or exit prices.
No Guarantee of Profit:
Past performance is not necessarily indicative of future results. The strategy should be used with caution, and risk management techniques (such as stop losses and position sizing) should always be implemented to protect against significant losses.
Traders should thoroughly test and adapt the strategy in a simulated environment before applying it to live trades, and consider seeking professional advice to ensure that their trading activities align with their risk tolerance and financial goals.
References:
Poterba, J. M., & Summers, L. H. (1988). Mean Reversion in Stock Prices: Evidence and Implications. Journal of Financial Economics, 22(1), 27-59.

Multiple RSITitle: MultiRSI: A Versatile Multi-Timeframe RSI Indicator
Short Description:
A powerful RSI-based indicator that incorporates three RSI lengths (Fast, Medium, and Slow) to help traders analyze trends, momentum, and potential reversals with clear visual signals.
Full Description:
Overview:
The MultiRSI script provides traders with a dynamic tool to assess market conditions across multiple RSI timeframes. It calculates Fast, Medium, and Slow RSI values, assigns meaningful colors based on trend analysis, and highlights key crossover points for actionable insights.
Key Features:
Triple RSI Display:
Fast RSI (default: 8): Ideal for capturing short-term momentum.
Medium RSI (default: 12): Provides a balanced perspective.
Slow RSI (default: 16): Helps identify longer-term trends.
Trend Analysis:
Color-coded RSI lines:
Green, blue, and aqua for uptrends.
Yellow, orange, and red for potential downtrends.
Visual differentiation for easy interpretation.
Crossover Signals:
Upward Cross (triangle up): Indicates potential bullish momentum.
Downward Cross (triangle down): Suggests possible bearish momentum.
Marked directly on the chart for clarity.
Customizable Inputs:
Adjust RSI lengths to suit your trading strategy.
Grouped input settings for a seamless configuration experience.
Usage Scenarios:
Identify trend strength and reversals in different timeframes.
Spot key momentum shifts with crossover signals.
Combine with other indicators for a comprehensive trading strategy.
How It Works:
The script compares the Fast RSI against the Medium RSI and the Medium RSI against the Slow RSI to determine short-, medium-, and long-term trends. Crossovers between Medium and Slow RSI values signal potential momentum shifts.
Visualization:
Clear, color-coded plots for the three RSI levels.
Highlighted crossovers for quick decision-making.
License:
This script is open-source under the Mozilla Public License 2.0. Feel free to use, modify, and share!

MACD+RSI+BBDESCRIPTION
The MACD + RSI + Bollinger Bands Indicator is a comprehensive technical analysis tool designed for traders and investors to identify potential market trends and reversals. This script combines three indicators: the Moving Average Convergence Divergence (MACD), the Relative Strength Index (RSI), and Bollinger Bands. Each of these indicators provides unique insights into market behavior.
FEATURES
MACD (Moving Average Convergence Divergence)
The MACD is a trend-following momentum indicator that shows the relationship between two moving averages of a security’s price.
The script calculates the MACD line, the signal line, and the histogram, which visually represents the difference between the MACD line and the signal line.
RSI (Relative Strength Index)
The RSI is a momentum oscillator that measures the speed and change of price movements. It ranges from 0 to 100 and is typically used to identify overbought or oversold conditions.
The script allows users to set custom upper and lower thresholds for the RSI, with default values of 70 and 30, respectively.
Bollinger Bands
Bollinger Bands consist of a middle band (EMA) and two outer bands (standard deviations away from the EMA). They help traders identify volatility and potential price reversals.
The script allows users to customize the length of the Bollinger Bands and the multiplier for the standard deviation.
Color-Coding Logic
The histogram color changes based on the following conditions:
Black: If the RSI is above the upper threshold and the closing price is above the upper Bollinger Band, or if the RSI is below the lower threshold and the closing price is below the lower Bollinger Band.
Green (#4caf50): If the RSI is above the upper threshold but the closing price is not above the upper Bollinger Band.
Light Green (#a5d6a7): If the histogram is positive and the RSI is not above the upper threshold.
Red (#f23645): If the RSI is below the lower threshold but the closing price is not below the lower Bollinger Band.
Light Red (#faa1a4): If the histogram is negative and the RSI is not below the lower threshold.
Inputs
Bollinger Bands Settings
Length: The number of periods for the moving average.
Basis MA Type: The type of moving average (SMA, EMA, SMMA, WMA, VWMA).
Source: The price source for the Bollinger Bands calculation.
StdDev: The multiplier for the standard deviation.
RSI Settings
RSI Length: The number of periods for the RSI calculation.
RSI Upper: The upper threshold for the RSI.
RSI Lower: The lower threshold for the RSI.
Source: The price source for the RSI calculation.
MACD Settings
Fast Length: The length for the fast moving average.
Slow Length: The length for the slow moving average.
Signal Smoothing: The length for the signal line smoothing.
Oscillator MA Type: The type of moving average for the MACD calculation.
Signal Line MA Type: The type of moving average for the signal line.
Usage
This indicator is suitable for various trading strategies, including day trading, swing trading, and long-term investing.
Traders can use the MACD histogram to identify potential buy and sell signals, while the RSI can help confirm overbought or oversold conditions.
The Bollinger Bands provide context for price volatility and potential breakout or reversal points.
Example:
From the example, it can clearly see that the Selling Climax and Buying Climax, marked as orange circle when a black histogram occurs.
Conclusion
The MACD + RSI + Bollinger Bands Indicator is a versatile tool that combines multiple technical analysis methods to provide traders with a comprehensive view of market conditions. By utilizing this script, traders can enhance their analysis and improve their decision-making process.

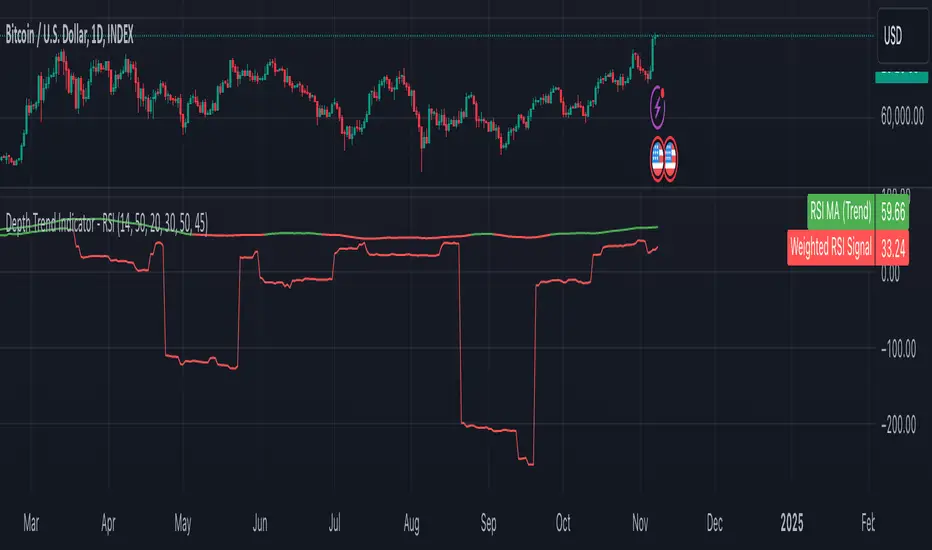
Depth Trend Indicator - RSIDepth Trend Indicator - RSI
This indicator is designed to identify trends and gauge pullback strength by combining the power of RSI and moving averages with a depth-weighted calculation. The script was created by me, Nathan Farmer and is based on a multi-step process to determine trend strength and direction, adjusted by a "depth" factor for more accurate signal analysis.
How It Works
Trend Definition Using RSI: The RSI Moving Average ( rsiMa ) is calculated to assess the current trend, using customizable parameters for the RSI Period and MA Period .
Trends are defined as follows:
Uptrend : RSI MA > Critical RSI Value
Downtrend : RSI MA < Critical RSI Value
Pullback Depth Calculation: To measure pullback strength relative to the current trend, the indicator calculates a Depth Percentage . This is defined as the portion of the gap between the moving average and the price covered by a pullback.
Depth-Weighted RSI Calculation: The Depth Percentage is then applied as a weighting factor on the RSI Moving Average , giving us a Weighted RSI line that adjusts to the depth of pullbacks. This line is rather noisy, and as such we take a moving average to smooth out some of the noise.
Key Parameters
RSI Period : The period for RSI calculation.
MA Period : The moving average period applied to RSI.
Price MA Period : Determines the SMA period for price, used to calculate pullback depth.
Smoothing Length : Length of smoothing applied to the weighted RSI, creating a more stable signal.
RSI Critical Value : The critical value (level) used in determining whether we're in an uptrend or a downtrend.
Depth Critical Value : The critical value (level) used in determining whether or not the depth weighted value confirms the state of a trend.
Notes:
As always, backtest this indicator and modify the parameters as needed for your specific asset, over your specific timeframe. I chose these defaults as they worked well on the assets I look at, but it is likely you tend to look at a different group of assets over a different timeframe than what I do.
Large pullbacks can create large downward spikes in the weighted line. This isn't graphically pleasing, but I have tested it with various methods of normalization and smoothing and found the simple smoothing used in the indicator to be best despite this.
Ultimate Machine Learning RSI (Deep Learning Edition)This script represents an advanced implementation of a Machine Learning-based Relative Strength Index (RSI) indicator in Pine Script, incorporating several sophisticated techniques to create a more adaptive, intelligent, and responsive RSI.
Key Components and Features:
Lookback Period: The period over which the indicator "learns" from past data, set to 1000 bars by default.
Momentum and Volatility Weighting: These factors control how much the momentum and volatility of the market influence the learning and signal generation.
RSI Length Range: The minimum and maximum values for the RSI length, allowing the algorithm to adjust the RSI length dynamically.
Learning Rate: Controls how quickly the system adapts to new data. An adaptive learning rate can change based on market volatility.
Memory Factor: Influences how much the system "remembers" previous performance when making adjustments.
Monte Carlo Simulations: Used for probabilistic modeling to create a more robust signal.
\
Price Change: Tracks the difference between the current close and the previous close.
Momentum: A measure of the rate of change in the price over the lookback period.
Volatility: Calculated using the standard deviation of the close prices.
ATR (Average True Range): Tracks the volatility of the market over a short period to influence decisions.
Monte Carlo Simulation:
Probabilistic Signal: This uses multiple random simulations (Monte Carlo) to generate potential future signals. These simulations are weighted by the momentum and volatility of the market. A cluster factor further enhances the simulation based on volatility regimes.
Z-Score for Extreme Conditions:
Z-Score: Measures how extreme current price movements are compared to the historical average, providing context for identifying overbought and oversold conditions.
Dynamic Learning Rate:
The learning rate adjusts based on the volatility of the market, becoming more responsive in high-volatility periods and slower in low-volatility markets. This prevents the system from overreacting to noise but ensures responsiveness to significant shifts.
Recursive Learning and Feedback:
Error Calculation: The system calculates the difference between the true RSI and the predicted RSI, creating an error that is fed back into the system to adjust the RSI length and other parameters dynamically.
RSI Length Adjustment: Based on the error, the RSI length is adjusted, ensuring that the system evolves over time to better reflect market conditions.
Adaptive Smoothing:
In periods of high volatility, the indicator applies a Triple Exponential Moving Average (TEMA) for faster adaptation, while in quieter markets, it uses an Exponential Moving Average (EMA) for smoother adjustments.
Recursive Memory Feedback:
The system maintains a memory of past RSI values, which helps refine the output further. The memory factor influences how much weight is given to past performance versus the current adaptive signal.
Volatility-Based Reinforcement: Higher market volatility increases the impact of this memory feedback, making the model more reactive in volatile conditions.
Multi-Factor Dynamic Thresholds:
Dynamic Overbought/Oversold: Instead of fixed RSI levels (70/30), the thresholds adjust dynamically based on the Z-Score, making the system more sensitive to extreme market conditions.
Combined Multi-Factor Signal:
The final output signal is the result of combining the true RSI, adaptive RSI, and the probabilistic signal generated from the Monte Carlo simulations. This creates a robust, multi-factor signal that incorporates various market conditions and machine learning techniques.
Visual Representation:
The final combined signal is plotted in blue on the chart, along with reference lines at 55 (overbought), 10 (oversold), and 35 (neutral).
Alerts are set up to trigger when the combined signal crosses above the dynamic overbought level or below the dynamic oversold level.
Conclusion:
This "Ultimate Machine Learning RSI" script leverages multiple machine learning techniques—probabilistic modeling, adaptive learning, recursive feedback, and dynamic thresholds—to create an advanced, highly responsive RSI indicator. The result is an RSI that continuously learns from market conditions, adjusts itself in real-time, and provides a more nuanced and robust signal compared to traditional fixed-length RSI. This indicator pushes the boundaries of what's possible with Pine Script and introduces cutting-edge techniques for technical analysis.

ATR Adjusted RSIATR Adjusted RSI Indicator
By Nathan Farmer
The ATR Adjusted RSI Indicator is a versatile indicator designed primarily for trend-following strategies, while also offering configurations for overbought/oversold (OB/OS) signals, making it suitable for mean-reversion setups. This tool combines the classic Relative Strength Index (RSI) with a unique Average True Range (ATR)-based smoothing mechanism, allowing traders to adjust their RSI signals according to market volatility for more reliable entries and exits.
Key Features:
ATR Weighted RSI:
At the core of this indicator is the ATR-adjusted RSI line, where the RSI is smoothed based on volatility (measured by the ATR). When volatility increases, the smoothing effect intensifies, resulting in a more stable and reliable RSI reading. This makes the indicator more responsive to market conditions, which is especially useful in trend-following systems.
Multiple Signal Types:
This indicator offers a variety of signal-generation methods, adaptable to different market environments and trading preferences:
RSI MA Crossovers: Generates signals when the RSI crosses above or below its moving average, with the flexibility to choose between different moving average types (SMA, EMA, WMA, etc.).
Midline Crossovers: Provides trend confirmation when either the RSI or its moving average crosses the 50 midline, signaling potential trend reversals.
ATR-Inversely Weighted RSI Variations: Uses the smoothed, ATR-adjusted RSI for a more refined and responsive trend-following signal. There are variations both for the MA crossover and the midline crossover.
Overbought/Oversold Conditions: Ideal for mean reversion setups, where signals are triggered when the RSI or its moving average crosses over overbought or oversold levels.
Flexible Customization:
With a wide range of customizable options, you can tailor the indicator to fit your personal trading style. Choose from various moving average types for the RSI, modify the ATR smoothing length, and adjust overbought/oversold levels to optimize your signals.
Usage:
While this indicator is primarily designed for trend-following, its OB/OS configurations make it highly effective for mean-reverting setups as well. Depending on your selected signal type, the relevant indicator line will change color between green and red to visually signal long or short opportunities. This flexibility allows traders to switch between trending and sideways market strategies seamlessly.
A Versatile Tool:
The ATR Adjusted RSI Indicator is a valuable component of any trading system, offering enhanced signals that adapt to market volatility. However, it is not recommended to rely on this indicator alone, especially without thorough backtesting. Its performance varies across different assets and timeframes, so it’s essential to experiment with the parameters to ensure consistent results before applying it in live trading.
Recommendation:
Before incorporating this indicator into live trading, backtest it extensively. Given its flexibility and wide range of signal-generation methods, backtesting allows you to optimize the settings for your preferred assets and timeframes. Only consider using it on it's own if you are confident in its performance based on your own backtest results, and even then, it is not recommended.

Cubic Bezier Curve RSI [CBCR]Overview :
Introducing the Cubic Bézier Curve RSI – an innovative approach to smoothing the traditional RSI using cubic Bézier curves. This indicator provides traders with a smoother, adaptive version of the RSI that can help filter out noise and better highlight market trends.
Key Features:
Bézier Curve : the script uses cubic Bézier curves to create a smoothed version of the RSI, offering a more visually appealing and potentially more insightful representation of market momentum.
Customizable Settings: Users can adjust the Bézier Curve Length, Impact Factor, and color modes, allowing full customization of the smoothing effect and visualization.
Color-coded Trend Indicator: The smoothed RSI is displayed with colors that indicate potential bullish or bearish trends, helping traders quickly assess market conditions.
Overbought/Oversold Lines: Option to display overbought and oversold levels for better identification of market extremes.
Parameters:
RSI Length: Set the length for the traditional RSI calculation (default is 14).
Bézier Curve Length: Adjust the length of the Bézier curve used to smooth the RSI (default is 20).
Impact Factor: Control the influence of the Bézier smoothed values versus the original RSI values (default is 0.5, ranging from 0.0 to 1.0).
Overbought/Oversold Lines: Option to show overbought (default: 70) and oversold (default: 30) lines for easier identification of extreme conditions.
Color Mode: Choose between "Trend Following" and "Overbought/Oversold" modes for line color indication.
Display Settings: Color customization for bullish and bearish phases allows better visual differentiation.
How It Works:
The CBCR uses four control points derived from historical RSI values over a user-defined length. It then applies the cubic Bezier formula to generate a sequence of points representing a smoothed version of the RSI over this range.
The Bezier curve is recalculated each time a specific number of bars (as defined by the Bezier Curve Length) have passed, helping reduce noise while retaining key trend information.
The result is a smoothed RSI that combines the adaptability of cubic Bezier curves with the familiar oscillation of the RSI, making it potentially more robust for identifying shifts in market sentiment.
Visuals:
Smoothed RSI Line: Plotted on the indicator pane, the line changes color depending on the chosen color mode:
Trend Following Mode: Color changes based on whether the smoothed RSI is above or below the 50-level.
Overbought/Oversold Mode: Color changes based on whether the smoothed RSI is above the overbought level or below the oversold level.
Bullish Color: Configurable (default: cyan).
Bearish Color: Configurable (default: red).
Overbought/Oversold Lines: Horizontal lines at user-defined levels (default: 70 for overbought, 30 for oversold) for easy identification of market extremes.
Usage:
The CBCR can be used like a traditional RSI but with a smoother output that may help traders avoid false signals generated by sudden price spikes. For instance:
Look for crossovers around the 50 level as a signal for changing momentum.
Use the overbought and oversold levels to identify potential reversal zones.
Observe the color change of the line for an immediate visual cue on current sentiment.
Dynamic Volume RSI (DVRSI) [QuantAlgo]Introducing the Dynamic Volume RSI (DVRSI) by QuantAlgo 📈✨
Elevate your trading and investing strategies with the Dynamic Volume RSI (DVRSI) , a powerful tool designed to provide clear insights into market momentum and trend shifts. This indicator is ideal for traders and investors who want to stay ahead of the curve by using volume-responsive calculations and adaptive smoothing techniques to enhance signal clarity and reliability.
🌟 Key Features:
🛠 Customizable RSI Settings: Tailor the indicator to your strategy by adjusting the RSI length and price source. Whether you’re focused on short-term trades or long-term investments, DVRSI adapts to your needs.
🌊 Adaptive Smoothing: Enable adaptive smoothing to filter out market noise and ensure cleaner signals in volatile or choppy market conditions.
🎨 Dynamic Color-Coding: Easily identify bullish and bearish trends with color-coded candles and RSI plots, offering clear visual cues to track market direction.
⚖️ Volume-Responsive Adjustments: The DVRSI reacts to volume changes, giving greater significance to high-volume price moves and improving the accuracy of trend detection.
🔔 Custom Alerts: Stay informed with alerts for key RSI crossovers and trend changes, allowing you to act quickly on emerging opportunities.
📈 How to Use:
✅ Add the Indicator: Set up the DVRSI by adding it to your chart and customizing the RSI length, price source, and smoothing options to fit your specific strategy.
👀 Monitor Visual Cues: Watch for trend shifts through the color-coded plot and candles, signaling changes in momentum as the RSI crosses key levels.
🔔 Set Alerts: Configure alerts for critical RSI crossovers, such as the 50 line, ensuring you stay on top of potential market reversals and opportunities.
🔍 How It Works:
The Dynamic Volume RSI (DVRSI) is a unique indicator designed to provide more accurate and responsive signals by incorporating both price movement and volume sensitivity into the RSI framework. It begins by calculating the traditional RSI values based on a user-defined length and price source, but unlike standard RSI tools, the DVRSI applies volume-weighted adjustments to reflect the strength of market participation.
The indicator dynamically adjusts its sensitivity by factoring in volume to the RSI calculation, which means that price moves backed by higher volumes carry more weight, making the signal more reliable. This method helps identify stronger trends and reduces the risk of false signals in low-volume environments. To further enhance accuracy, the DVRSI offers an adaptive smoothing option that allows users to reduce noise during periods of market volatility. This adaptive smoothing function responds to market conditions, providing a cleaner signal by reducing erratic movements or price spikes that could lead to misleading signals.
Additionally, the DVRSI uses dynamic color-coding to visually represent the strength of bullish or bearish trends. The candles and RSI plots change color based on the RSI values crossing critical thresholds, such as the 50 level, offering an intuitive way to recognize trend shifts. Traders can also configure alerts for specific RSI crossovers (e.g., above 50 or below 40), ensuring that they stay informed of potential trend reversals and significant market shifts in real-time.
The combination of volume sensitivity, adaptive smoothing, and dynamic trend visualization makes the DVRSI a robust and versatile tool for traders and investors looking to fine-tune their market analysis. By incorporating both price and volume data, this indicator delivers more precise signals, helping users make informed decisions with greater confidence.
Disclaimer:
The Dynamic Volume RSI is designed to enhance your market analysis but should not be used as a sole decision-making tool. Always consider multiple factors before making any trading or investment decisions. Past performance is not indicative of future results.

RishiMoney RSIRishiMoney RSI
The "RishiMoney RSI" indicator is designed for traders who want to leverage the power of the Relative Strength Index (RSI) across multiple timeframes.
In addition to regular RSI, this script allows the users to select custom timeframes for two additional RSI calculations, making it easier to identify trends, reversals, and potential entry or exit points.
USAGE
While Returning the same information as a regular RSI the RishiMoney RSI provides two more RSI calculations One for Lagrgest Timeframe and one for middle Timeframe so that the users need not to check for higher timeframes separately Which is very Time consuming. This script solves the problem of time taking process of checking different timeframes RSI calculations.
This script is ideal for traders who want to confirm their analysis across multiple timeframes. By comparing the main RSI with larger and intermediate timeframes, traders can better understand the market's momentum and make more informed decisions.
The RishiMoney RSI crossing above the overbought level can be indicative of a strong uptrend which is highlighted as a green gradient area, while when RishiMoney RSI is crossing under the oversold level can be indicative of a strong downtrend which is highlighted as a red area.
Key Features:
Customizable RSI Period: Set your preferred RSI period for precise calculation and analysis.
Multi-Timeframe RSI:
Largest RSI Timeframe: Choose the largest timeframe for your analysis (Monthly, Weekly, Daily, Hourly, 15 minutes, or 5 minutes).
Middle RSI Timeframe: Select an intermediate timeframe for comparison with the main RSI.
Overbought and Oversold Levels: The indicator includes customizable overbought and oversold levels, which are clearly marked on the chart with dynamic bands.
Alerts: Set up alerts for when the RSI crosses into overbought or oversold territory, so you never miss a potential trading opportunity.
Visual Clarity: The script plots the RSI for your selected timeframes with distinct colors, helping you quickly identify trends across different timeframes.
This script is provided for educational purposes only and should not be considered financial advice. Always conduct your own research and consult with a financial advisor before making any trading decisions.

Multi-Length RSI **Multi-Length RSI Indicator**
This script creates a custom Relative Strength Index (RSI) indicator with the ability to plot three different RSI lengths on the same chart, allowing traders to analyze momentum across various timeframes simultaneously. The script also includes features to enhance visual clarity and usability.
**Key Features:**
1. **Customizable RSI Lengths:**
- The script allows you to input and customize three different RSI lengths (7, 14, and 28 by default) via user inputs. This flexibility enables you to track short-term, medium-term, and long-term momentum in the market.
2. **Dynamic Colour Coding:**
- The RSI lines are color-coded based on their current value:
- **Above 70 (Overbought)**: The line turns red.
- **Below 30 (Oversold)**: The line turns green.
- **Between 30 and 70**: The line retains its user-defined colour (blue, yellow, orange by default).
- This dynamic colouring helps to quickly identify overbought and oversold conditions.
3. **Adjustable Line Widths and Colours:**
- Users can customize the colour and thickness of each RSI line, allowing for a personalized visual experience that fits different trading strategies.
4. **Overbought, Oversold, and Midline Levels:**
- The script includes static horizontal lines at the 70 (Overbought) and 30 (Oversold) levels, with a red and green colour, respectively.
- A midline at the 50 level is also included in gray and dashed, helping to visualize the neutral zone.
5. **Dynamic RSI Value Labels:**
- The current values of each RSI line are displayed directly on the chart as labels at the most recent bar, with colours matching their corresponding lines. This feature provides an immediate reference to the exact RSI values without the need to hover or look at the data window.
6. **Alerts for Crosses:**
- The script includes built-in alert conditions for when any of the RSI values cross above the overbought level (70) or below the oversold level (30). These alerts can be configured to notify you in real-time when significant momentum shifts occur.
**How to Use:**
1. **Customization**:
- Input your preferred RSI lengths, colours, and line widths through the script’s settings menu.
2. **Visual Analysis**:
- The indicator plots all three RSI values on a separate pane below the price chart. Use the color-coded lines and levels to quickly identify overbought, oversold, and neutral conditions across multiple timeframes.
3. **Set Alerts**:
- You can configure alerts based on the built-in alert conditions to get notified when the RSI crosses critical levels.
**Ideal For:**
- **Traders looking to analyze momentum across multiple timeframes**: The ability to view short-term, medium-term, and long-term RSIs simultaneously offers a comprehensive view of market strength.
- **Those who prefer visual clarity**: The dynamic colouring, clear labels, and customizable settings make it easy to interpret RSI data at a glance.
- **Traders who rely on alerts**: The built-in alert system allows for proactive trading based on significant RSI level crossings.
---
This script is a powerful tool for any trader looking to leverage RSI analysis across multiple timeframes, offering both customization and clarity in a single indicator.
TechniTrend RSI (11TF)Multi-Timeframe RSI Indicator
Overview
The Multi-Timeframe RSI Indicator is a sophisticated tool designed to provide comprehensive insights into the Relative Strength Index (RSI) across 11 different timeframes simultaneously. This indicator is essential for traders who wish to monitor RSI trends and their moving averages (MA) to make informed trading decisions.
Features
Multiple Timeframes: Displays RSI and RSI MA values for 11 different timeframes, allowing traders to have a holistic view of the market conditions.
RSI vs. MA Comparison: Indicates whether the RSI value is above or below its moving average for each timeframe, helping traders to identify bullish or bearish momentum.
Overbought/Oversold Signals:
Marks "OS" (OverSell) when RSI falls below 25, indicating a potential oversold condition.
Marks "OB" (OverBuy) when RSI exceeds 75, signaling a potential overbought condition.
Real-Time Updates: Continuously updates in real-time to provide the most current market information.
Usage
This indicator is invaluable for traders who utilize RSI as part of their technical analysis strategy. By monitoring multiple timeframes, traders can:
Identify key overbought and oversold levels to make entry and exit decisions.
Observe the momentum shifts indicated by RSI crossing above or below its moving average.
Enhance their trading strategy by integrating multi-timeframe analysis for better accuracy and confirmation.
How to Interpret the Indicator
RSI Above MA: Indicates a potential bullish trend. Traders may consider looking for long positions.
RSI Below MA: Suggests a potential bearish trend. Traders may look for short positions.
OS (OverSell): When RSI < 25, the market may be oversold, presenting potential buying opportunities.
OB (OverBuy): When RSI > 75, the market may be overbought, indicating potential selling opportunities.

Korneev Reverse RSIRethinking the Legendary Relative Strength Index by John Welles Wilder
The essence of the new approach lies in the reverse use of the so-called "overbought" and "oversold" zones. In his 1978 book, "New Concepts in Technical Trading Systems," where the RSI mechanism was thoroughly described, Wilder writes that one way to use the oscillator is to open a long position when the RSI drops into oversold territory (below 30) and to open a short position when the RSI rises to overbought levels (above 70). However, backtesting this strategy with such inputs yields rather mediocre results.
Based on the calculation formula, the RSI calculates the rate of price change over a certain period. Therefore, overbought and oversold zones will have relative significance (relative to the set calculation period). It is no coincidence that the word "relative" was added to the name of the oscillator. It is worth accepting as an axiom the assertion that the price of an asset is fair at every moment in time.
Essentially, the RSI calculates the strength of a trend. If the oscillator value is above 70, it is highly likely that an upward movement is occurring in the market. Therefore, in the current strategy, a long position is opened precisely at the moment of greatest buyer strength (when RSI > 80), i.e., in the direction of the trend, since counter-trend trading with the RSI has proven to be ineffective. The position is closed after the buyers lose their advantage and the RSI drops to 40.
The strategy is recommended to be used only with long positions, as short positions show negative results. The strategy uses a moving average for the RSI with a period of 14 to smooth the oscillator data.
--------------------------------------------------------------------------------------------
Переосмысление легендарного осциллятора Relative strength index Джона Уэллса Уайлдера
Суть нового подхода заключается в реверсивном использовании так называемых зон "перекупленности" и "перепроданности". В своей книге от 1978 года "New concepts in tecnical trading systems", в которой был подробно описан механизм работы RSI, Уайлдер пишет, что один из способов использования осциллятора - открытие длинной позиции при снижении RSI в перепроданность (ниже 30) и открытие короткой позиции при повышении RSI до перекупленности (выше 70). Однако бэктест стратегии с такими вводными дает весьма посредственные результаты.
Исходя из формулы расчета, RSI рассчитывает скорость изменения цены за определенный период. Поэтому зоны перекупленности и перепроданности будут иметь относительное значение (относительно установленного периода расчета). Не зря ведь в названии осциллятора было добавлено слово "относительной". Стоит принять за аксиому утверждение, что цена актива справедлива в каждый момент времени.
По сути, RSI рассчитывает силу тренда. Если значение осциллятора выше 70, то на рынке с высокой долей вероятности происходит восходящее движение. Поэтому в текущей стратегии открытие лонга происходит именно в момент наибольшей силы покупателей (когда RSI > 80), то есть в сторону тренда, поскольку контртрендовая торговля по RSI показала свою несостоятельность. Закрытие позиции происходит после того, как покупатели теряют преимущество и RSI снижается до 40.
Стратегию рекомендуется использовать только с длинными позициями, поскольку короткие позиции показывают отрицательный результат. В стратегии используется скользящая средняя для RSI с периодом 14 для сглаживания данных осциллятора.

Market Cipher B by WeloTradesMarket Cipher B by WeloTrades: Detailed Script Description
//Overview//
"Market Cipher B by WeloTrades" is an advanced trading tool that combines multiple technical indicators to provide a comprehensive market analysis framework. By integrating WaveTrend, RSI, and MoneyFlow indicators, this script helps traders to better identify market trends, potential reversals, and trading opportunities. The script is designed to offer a holistic view of the market by combining the strengths of these individual indicators.
//Key Features and Originality//
WaveTrend Analysis:
WaveTrend Channel (WT1 and WT2): The core of this script is the WaveTrend indicator, which uses the smoothed average of typical price to identify overbought and oversold conditions. WT1 and WT2 are calculated to track market momentum and cyclical price movements.
Major Divergences (🐮/🐻): The script detects and highlights major bullish and bearish divergences automatically, providing traders with visual cues for potential reversals. This helps in making informed decisions based on divergence patterns.
Relative Strength Index (RSI):
RSI Levels: RSI is used to measure the speed and change of price movements, with specific levels indicating overbought and oversold conditions.
Customizable Levels: Users can configure the overbought and oversold thresholds, allowing for a tailored analysis based on individual trading strategies.
MoneyFlow Indicator:
Fast and Slow MoneyFlow: This indicator tracks the flow of capital into and out of the market, offering insights into the underlying market strength. It includes configurable periods and multipliers for both fast and slow MoneyFlow.
Vertical Positioning: The script allows users to adjust the vertical position of MoneyFlow plots to maintain a clear and uncluttered chart.
Stochastic RSI:
Stochastic RSI Levels: This combines the RSI and Stochastic indicators to provide a momentum oscillator that is sensitive to price changes. It is used to identify overbought and oversold conditions within a specified period.
Customizable Levels: Traders can set specific levels for more precise analysis.
//How It Works//
The script integrates these indicators through advanced algorithms, creating a synergistic effect that enhances market analysis. Here’s a detailed explanation of the underlying concepts and calculations:
WaveTrend Indicator:
Calculation: WaveTrend is based on the typical price (average of high, low, and close) smoothed over a specified channel length. WT1 and WT2 are derived from this typical price and further smoothed using the Average Channel Length. The difference between WT1 and WT2 indicates momentum, helping to identify cyclical market trends.
RSI (Relative Strength Index):
Calculation: RSI calculates the average gains and losses over a specified period to measure the speed and change of price movements. It oscillates between 0 and 100, with levels set to identify overbought (>70) and oversold (<30) conditions.
MoneyFlow Indicator:
Calculation: MoneyFlow is derived by multiplying price changes by volume and smoothing the results over specified periods. Fast MoneyFlow reacts quickly to price changes, while Slow MoneyFlow offers a broader view of capital movement trends.
Stochastic RSI:
Calculation: Stochastic RSI is computed by applying the Stochastic formula to RSI values, which highlights the RSI’s relative position within its range over a given period. This helps in identifying momentum shifts more precisely.
//How to Use the Script//
Display Settings:
Users can enable or disable various components like WaveTrend OB & OS levels, MoneyFlow plots, and divergence alerts through checkboxes.
Example: Turn on "Show Major Divergence" to see major bullish and bearish divergence signals directly on the chart.
Adjust Channel Settings:
Customize the data source, channel length, and smoothing periods in the "WaveTrend Channel SETTINGS" group.
Example: Set the "Channel Length" to 10 for a more responsive WaveTrend line or adjust the "Average Channel Length" to 21 for smoother trends.
Set Overbought & Oversold Levels:
Configure levels for WaveTrend, RSI, and Stochastic RSI in their respective settings groups.
Example: Set the WaveTrend Overbought Level to 60 and Oversold Level to -60 to define critical thresholds.
Money Flow Settings:
Adjust the periods and multipliers for Fast and Slow MoneyFlow indicators, and set their vertical positions for better visualization.
Example: Set the Fast Money Flow Period to 9 and Slow Money Flow Period to 12 to capture both short-term and long-term capital movements.
//Justification for Combining Indicators//
Enhanced Market Analysis:
Combining WaveTrend, RSI, and MoneyFlow provides a more comprehensive view of market conditions. Each indicator brings a unique perspective, making the analysis more robust.
WaveTrend identifies cyclical trends, RSI measures momentum, and MoneyFlow tracks capital movement. Together, they provide a multi-dimensional analysis of the market.
Improved Decision-Making:
By integrating these indicators, the script helps traders make more informed decisions. For example, a bullish divergence detected by WaveTrend might be validated by an RSI moving out of oversold territory and supported by increasing MoneyFlow.
Customization and Flexibility:
The script offers extensive customization options, allowing traders to tailor it to their specific needs and strategies. This flexibility makes it suitable for different trading styles and timeframes.
//Conclusion//
The indicator stands out due to its innovative combination of WaveTrend, RSI, and MoneyFlow indicators, offering a well-rounded tool for market analysis. By understanding how each component works and how they complement each other, traders can leverage this script to enhance their market analysis and trading strategies, making more informed and confident decisions.
Remember to always backtest the indicator first before implying it to your strategy.

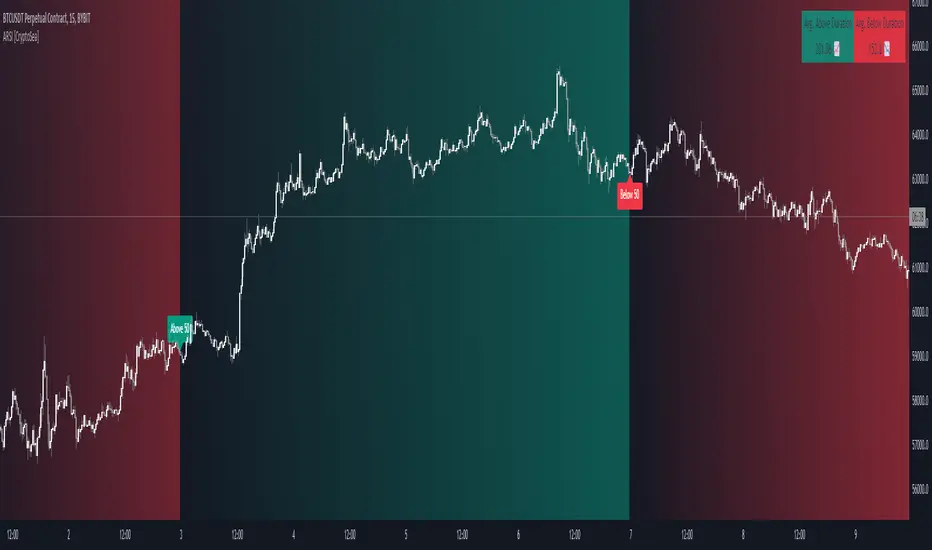
Advanced RSI [CryptoSea]The Advanced RSI Duration (ARSI) is a unique tool crafted to deepen your market insights by focusing on the duration the Relative Strength Index (RSI) spends above or below key thresholds. This innovative approach is designed to help traders anticipate potential market reversals by observing sustained overbought and oversold conditions.
Core Feature
Duration Monitoring ARSI's standout feature is its ability to track how long the RSI remains in overbought (>70) or oversold (<30) conditions. By quantifying these durations, traders can gauge the strength of current market trends and the likelihood of reversals.
Enhanced Functionality
Multi-Timeframe Flexibility : Analyze the RSI duration from any selected timeframe on your current chart, offering a layered view of market dynamics.
Customizable Alerts : Receive notifications when the RSI maintains its position above or below set levels for an extended period, signaling sustained market pressure.
Visual Customization : Adjust the visual elements, including colors for overbought and oversold durations, to match your analytical style and preferences.
Label Management : Control the frequency of labels marking RSI threshold crossings, ensuring clarity and focus on significant market events.
Settings Overview
RSI Timeframe & Length : Tailor the RSI calculation to fit your analysis, choosing from various timeframes and period lengths.
Threshold Levels : Define what you consider overbought and oversold conditions with customizable upper and lower RSI levels.
Duration Alert Threshold : Set a specific bar count for how long the RSI should remain beyond these thresholds to trigger an alert.
Visualization Options : Choose distinct colors for durations above and below thresholds, and adjust label visibility to suit your charting approach.
Application & Strategy
Use ARSI to identify potential turning points in the market
Trend Exhaustion : Extended periods in overbought or oversold territories may indicate a strong trend but also warn of possible exhaustion and impending reversals.
Comparative Analysis : By evaluating the current duration against historical averages, traders can assess the relative strength of ongoing market conditions.
Strategic Entries/Exits : Utilize duration insights to refine entry and exit points, capitalizing on the predictive nature of prolonged RSI levels.
Alert Conditions
The Advanced RSI (ARSI) offers critical alert mechanisms to aid traders in identifying prolonged market conditions that could lead to actionable trading opportunities. These conditions are designed to alert traders when the RSI remains at extremes longer than typical durations, signaling sustained market behaviors.
Above Upper Level Alert: This alert is triggered when the RSI sustains above the upper threshold (usually 70) for more than the configured duration, indicating strong bullish momentum or potential overbought conditions.
Below Lower Level Alert: Similarly, this alert is activated when the RSI stays below the lower threshold (commonly 30) for an extended period, suggesting significant bearish momentum or potential oversold conditions.
These alerts enable traders to respond swiftly to extend market conditions, enhancing their strategy by providing timely insights into potential trend reversals or continuations.
The Advanced RSI Duration Analysis empowers traders with a nuanced understanding of market states, beyond mere RSI values. It highlights the significance of how long markets remain in extreme conditions, offering a predictive edge in anticipating reversals. Whether you're strategizing entries or preparing for shifts in market momentum, ARSI is your companion for informed trading decisions.
Dual RSI Differential - Strategy [presentTrading]█ Introduction and How it is Different
The Dual RSI Differential Strategy introduces a nuanced approach to market analysis and trading decisions by utilizing two Relative Strength Index (RSI) indicators calculated over different time periods. Unlike traditional strategies that employ a single RSI and may signal premature or delayed entries, this method leverages the differential between a shorter and a longer RSI. This approach pinpoints more precise entry and exit points, providing a refined tool for traders to exploit market conditions effectively, particularly in overbought and oversold scenarios.
Most important: it is a good eductional code for swing trading.
For beginners, this Pine Script provides a complete function that includes crucial elements such as holding days and the option to configure take profit/stop loss settings:
- Hold Days: This feature ensures that trades are not exited too hastily, helping traders to ride out short-term market volatility. It's particularly valuable for swing trading where maintaining positions slightly longer can lead to capturing significant trends.
- TPSL Condition (None by default): This setting allows traders to focus solely on the strategy's robust entry and exit signals without being constrained by preset profit or loss limits. This flexibility is crucial for learning to adjust strategy settings based on personal risk tolerance and market observations.
BTCUSD 6h LS Performance
█ Strategy, How It Works: Detailed Explanation
🔶 RSI Calculation:
The RSI is a momentum oscillator that measures the speed and change of price movements. It is calculated using the formula:
RSI = 100 - (100 / (1 + RS))
Where RS (Relative Strength) = Average Gain of up periods / Average Loss of down periods.
🔶 Dual RSI Setup:
This strategy involves two RSI indicators:
RSI_Short (RSI_21): Calculated over a short period (21 days).
RSI_Long (RSI_42): Calculated over a longer period (42 days).
Differential Calculation:
The strategy focuses on the differential between these two RSIs:
RSI Differential = RSI_Long - RSI_Short
This differential helps to identify when the shorter-term sentiment diverges from longer-term trends, signaling potential trading opportunities.
BTCUSD Local picuture
🔶 Signal Triggers:
Entry Signal: A buy (long) signal is triggered when the RSI Differential exceeds -5, suggesting strengthening short-term momentum. Conversely, a sell (short) signal occurs when the RSI Differential falls below +5, indicating weakening short-term momentum.
Exit Signal: Trades are generally exited when the RSI Differential reverses past these thresholds, indicating a potential momentum shift.
█ Trade Direction
This strategy accommodates various trading preferences by allowing selections among long, short, or both directions, thus enabling traders to capitalize on diverse market movements and volatility.
█ Usage
The Dual RSI Differential Strategy is particularly suited for:
Traders who prefer a systematic approach to capture market trends.
Those who seek to minimize risks associated with rapid and unexpected market movements.
Traders who value strategies that can be finely tuned to different market conditions.
█ Default Settings
- Trading Direction: Both — allows capturing of upward and downward market movements.
- Short RSI Period: 21 days — balances sensitivity to market movements.
- Long RSI Period: 42 days — smoothens out longer-term fluctuations to provide a clearer market trend.
- RSI Difference Level: 5 — minimizes false signals by setting a moderate threshold for action.
Use Hold Days: True — introduces a temporal element to trading strategy, holding positions to potentially enhance outcomes.
- Hold Days: 5 — ensures that trades are not exited too hastily, helping to ride out short-term volatility.
- TPSL Condition: None — enables traders to focus solely on the strategy's entry and exit signals without preset profit or loss limits.
- Take Profit Percentage: 15% — aims for significant market moves to lock in profits.
- Stop Loss Percentage: 10% — safeguards against large losses, essential for long-term capital preservation.
