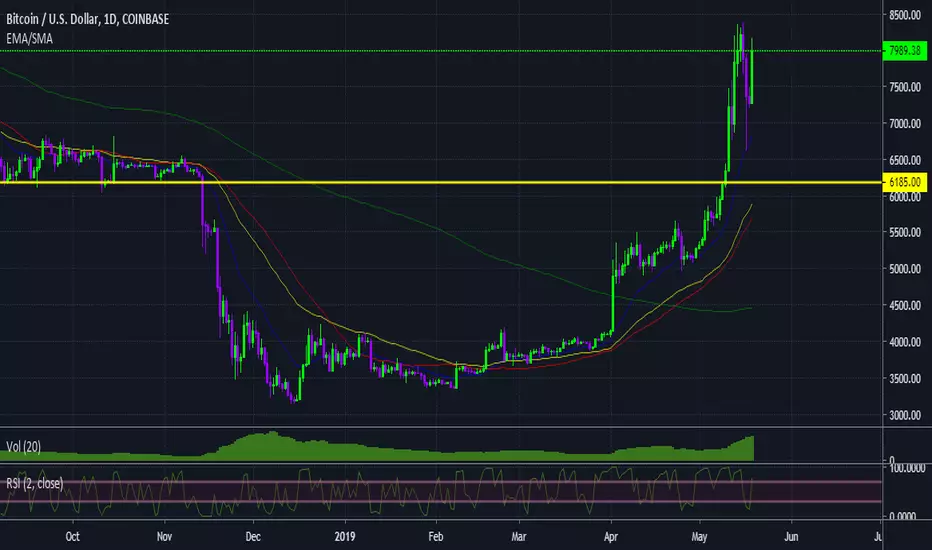
boot2thrill - EMA 20/50 & SMA 50/200//Notes:
//Version by boot2thrill on 05-20-2019.
//Version includes combined Exponential Moving Averages (EMA) for 20/50 periods and Simple Moving Averages (SMA) for 50/200 periods.
//***Recommended use on BTCUSD 1h/4h/1d chart.***
Cerca negli script per "富时中国50期指"
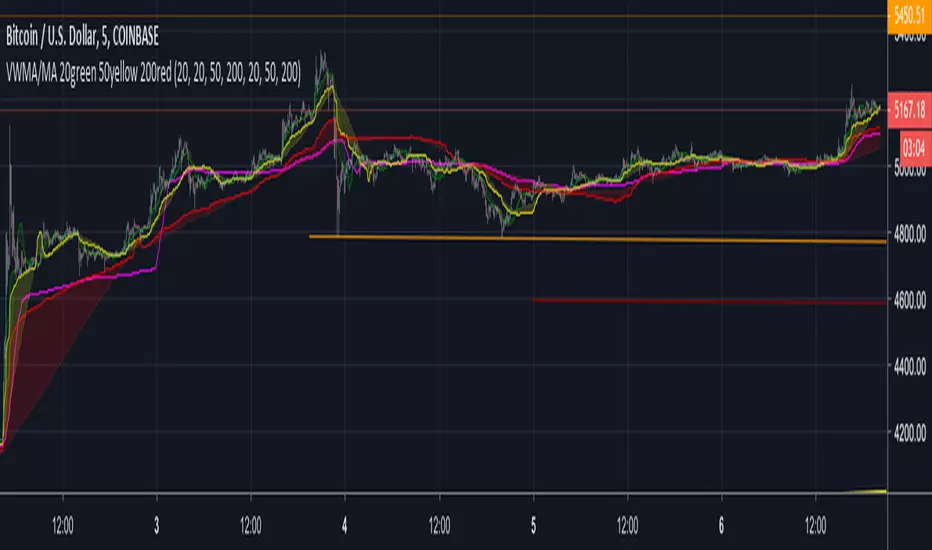
VWMA : 20 50 200Plots 20, 50 and 200 tick Volume Weighted MA and Simple MA.
The Volume Weighted MA tends to move before the SMA. I am seeing significant price movements on crypto charts near 50 VWMA crosses. As well, the 20-50 VWMA crosses. When the thicker lines ( VWMA ) are above or below the same color SMA, this divergence can also signal changes in trends.
This is my first script and likely be updated. Feedback is welcome.
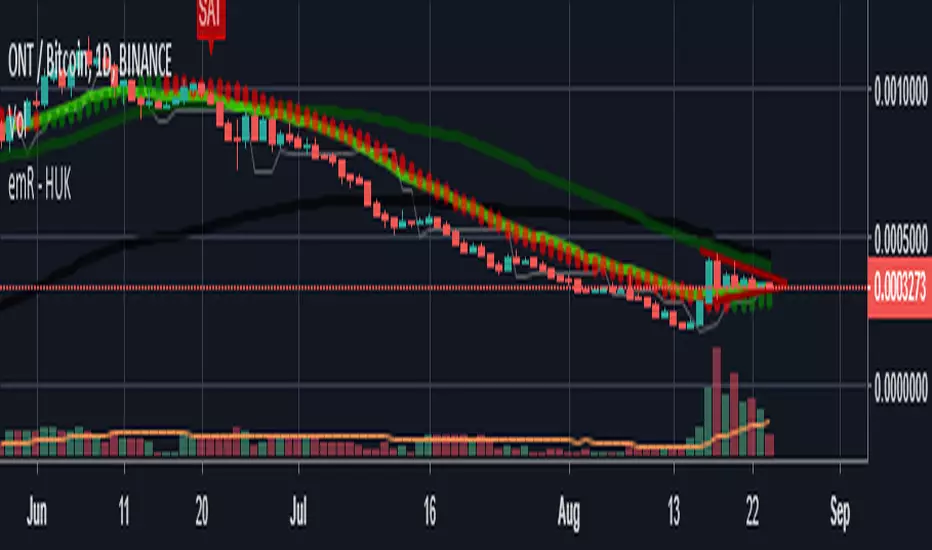
HUK ElasticVolume/50 MOVING AVERAGE e 50/200/20 Coral TrendElastic Volume Default Settings : 50 lenght!
Moving Average Default Settings:50 / 200
EMA Default Settings :20
Coral Trend Default Settings :21/0,4
Thank you ! emR Huk ..
EMA 50/200 Strategy Signals - Axis.BhpEMA 50/200 Strategy
Plots EMA 50 and EMA 200
Displays arrows when a crossover occurs (signals)
Creates alerts for TradingView
Works for crypto, forex, and stocks

Price vs 200 EMA / 50 EMA / VWAP TablePrice vs 200 EMA / 50 EMA / VWAP Table
This indicator displays a compact real-time table showing where current price is trading relative to three major dynamic levels: 200 EMA, 50 EMA, and VWAP.
It provides an instant read on trend strength, bias, and distance from key moving levels — all in one glance.
Color-coded signals:
Lime → Price above
Red → Price below
Gray → Price at / near
Features
Adjustable table position (4 corners)
Adjustable text size
Toggle % distance and points distance
Clean, lightweight, and non-intrusive
Works on all timeframes and assets

20/50/200 EMA with RVOL Filter Hariss 369Understanding to trade with this indicator is very simple. 20 EMA acts as dynamic support and resistance. 50 EMA is best for intraday/short term trend filter and 200 EMA is best for long term trend filter. One should always trade with the trend. Combination of all threes entails safe trading with trend. Undoubtedly, volume plays vital role to move the price up or down. The volume indicator used here is Relative Volume (RVOL) rather simple volume. 1.5 RVOL is considered as strong trend to trade considering other factors intact. You can tick/untick RVOL and you can also change the level of RVOL from input section.
You can also change the color of EMAs and pattern of buy and sell signal. Place this indicator over the chart. You can choose any type of asset and any time frame.
Though buy and sell signals are there. The concept of trading is buy when price closes above 20 ema and 20 ema >50ema>200 ema. Place stop loss below the low of last candle or just below 20 ema. Target 1.5/2 times of stop loss. You can also trail it with 20 ema or 50 ema depending upon your trading style and risk appetite. You can also take positional trade, in that case 200 ema to be considered as stop loss. Sell when price closes below 20 ema, 20 ema<50ema<200 ema. For intraday trading, 20 ema is best to enter and exit. Taking RVOL into consideration is best way in order to trade with high liquidity-safer way to entry and exit.

RSI to 50 (decimal version) - TemujinTradingSimple indicator that shows the price levels required for the RSI to get to the value of 50.
What I observe is 50 rsi often acts as support or resistance and is a fair indication of bullish/bearish sentiment and price action and bounce/rejection levels.
It provides a table showing current time frame, 4 hr, daily, weekly describing the current rsi value and the price needed for that rsi to get to 50. This table is colored red when bearish at the time frame and green when bullish (as per <50 rsi or >50rsi).
Plots historical lines of each previous candle in the series showing how price interacts.
Updated script to allow manual input of price decimals to enable more assets price to be viewable in the table format.

RSI to 50 - TemujinTradingSimple indicator that shows the price levels required for the RSI to get to the value of 50.
What I observe is 50 rsi often acts as support or resistance and is a fair indication of bullish/bearish sentiment and price action and bounce/rejection levels.
It provides a table showing current time frame, 4 hr, daily, weekly describing the current rsi value and the price needed for that rsi to get to 50. This table is colored red when bearish at the time frame and green when bullish (as per <50 rsi or >50rsi).
Plots historical lines of each previous candle in the series showing how price interacts.

EMA Trend Alignment (10/20/50) with MTF & SignalsBullish Crossovers 10>20>50 and Bearish Crossover 10<20<50

EMA 50/200 Pullback + RSI (BTC/USDT 15m - 2 Bar Logic)I recognize that combining indicators requires clear justification on how the components interact Therefore the new scripts description will explicitly detail the strategys operational logic
Objective The strategy is a Trend Following Pullback System designed for high frequency time frames 15m
Synergy The EMA50 EMA200 defines the primary Trend Direction Trend Filter It then utilizes a 2 Bar Pullback Logic to find an entry point where the price has momentarily reversed against the trendline and the RSI 14 serves as a Momentum Filter RSI greater than 50 for Long RSI less than 50 for Short to minimize false signals

EMA 200 - 50 - 20 | Davide BuncugaThis script displays three key Exponential Moving Averages (EMAs) on the chart: EMA 200, EMA 50, and EMA 20.
These moving averages are commonly used by traders to identify the overall market trend, medium-term structure, and short-term momentum.
EMA 200 – Represents the long-term trend and acts as a dynamic support/resistance.
EMA 50 – Used to identify the medium-term direction of the market.
EMA 20 – Highlights short-term momentum and pullback areas within the trend.
This indicator is designed to help traders quickly analyze market structure and align their trading decisions with the dominant trend.

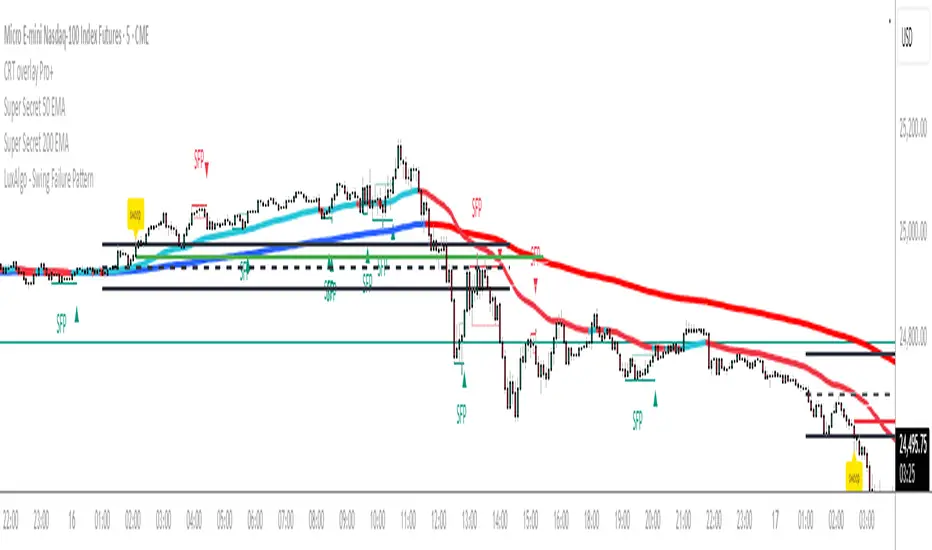
Super Secret 50 EMADynamic 50 EMA
The 50 EMA changes color during uptrend and another color during downtrend. User chooses colors.
Session Pivots + EMA20/50 + Bollinger BandsMulti-tool indicator combining session pivots, EMA trend filters, Bollinger Bands, and alerts for intraday trading.
📌 Description
One of the biggest advantages of this indicator is that it supports TradingView’s ALERT system, so traders can be notified the moment price crosses the daily/session pivot level. This allows faster decision-making without constant chart watching.
This script combines three powerful tools into a single indicator:
Session Pivot Levels (with Support/Resistance): Automatically calculates pivot, R1–R3 and S1–S3 levels based on the previous trading session (London, New York, Asia, or custom). Levels are plotted with clean labels and connector lines so you always see the exact price values ahead of time.
EMA Trend Filters (20 & 50): Tracks short- and medium-term market direction with two popular exponential moving averages, helping confirm entries and exits.
Bollinger Bands (fully customizable): Adds volatility bands with choice of SMA, EMA, SMMA, WMA, or VWMA for the middle line, plus adjustable standard deviation and offset.
✅ Key Features
Auto-detects London, New York, and Asian sessions or set your own custom session.
Displays up to 3 levels of support and resistance from the previous session.
Clean label display with customizable theme options (Dark, Light, Custom).
Alerts included: Get notified instantly when price crosses above or below the Pivot.
EMA20/50 trend confirmation built-in.
Bollinger Bands with multiple moving average types and volatility settings.
Works for Forex, Crypto, Indices, Commodities — optimized for intraday & scalping.
This makes it a complete intraday toolkit, reducing the need to load multiple separate indicators.
📄 Full documentation available here: [ link ]

Triple EMA with Alert | 21, 50, 200 EMA Strategy + Crossover🚀 Boost your trading edge with the Triple EMA with Alert — a professional-grade indicator designed for traders who want precise, real-time trend confirmation across short, medium, and long-term market movements.
🔹 What Makes This Indicator Powerful?
Three Adjustable EMAs — Default: 21, 50, 200 periods (fully customizable 1–200).
Toggle Visibility — Show only the EMAs you need for your strategy.
Real-Time Alerts — Get notified instantly when:
EMA 1 crosses EMA 2 → short-term trend change.
EMA 2 crosses EMA 3 → medium-term trend alignment.
Works on All Markets & Timeframes — Forex, crypto, stocks, indices, and commodities.
🔹 Why Traders Love It
📊 Multi-Timeframe Trend Confirmation — Filter out noise and trade with market momentum.
🎯 Accurate Crossover Signals — Identify bullish and bearish momentum shifts.
🔔 Hands-Free Monitoring — Alerts keep you informed even when you’re away from the chart.
💡 Versatile for Any Strategy — Perfect for scalping, swing trading, or long-term investing.
🔹 How to Use It
Bullish Signal — EMA 1 crossing above EMA 2 or EMA 2 crossing above EMA 3.
Bearish Signal — EMA 1 crossing below EMA 2 or EMA 2 crossing below EMA 3.
Combine with support/resistance zones, RSI, or volume for higher probability trades.
📌 Pro Tip:
Use EMA 21 & EMA 50 for momentum confirmation.
Use EMA 200 to spot the overall market direction.
If you’re serious about trend trading with precision, the Triple EMA with Alert will keep you one step ahead of market moves — no more missed entries or exits.

EMA 8/21/50 + VWAP Crossover Alert IndicatorOverview of the Indicator
This is a custom Pine Script v5 indicator for TradingView titled "EMA 8/21/50 + VWAP Crossover Alert Indicator" (short title: "EMA+VWAP Cross Alert"). It's designed as an overlay indicator, meaning it plots directly on your price chart rather than in a separate pane. The primary purpose is to detect and alert on crossovers between the 8-period Exponential Moving Average (EMA) and the 21-period EMA, which can signal potential bullish or bearish momentum shifts. These are classic short-term trend reversal or continuation signals often used in trading strategies like momentum or swing trading.
To enhance analysis, it also includes:
A 50-period EMA for medium-term trend context (e.g., to confirm if the overall trend aligns with the crossover).
A Volume Weighted Average Price (VWAP) line, which provides a benchmark for the average price weighted by volume, useful for identifying intraday value areas or fair price levels.
The indicator works across all timeframes (e.g., Daily, 4H, 1H, 15M, 5M, 3M) because the calculations are based on the chart's current bars and adapt to volatility and data resolution. It's not a trading strategy (no entry/exit logic or backtesting), but an alert tool—signals are visual and can trigger notifications in TradingView. Always combine it with risk management, as crossovers can produce false signals in ranging or choppy markets.

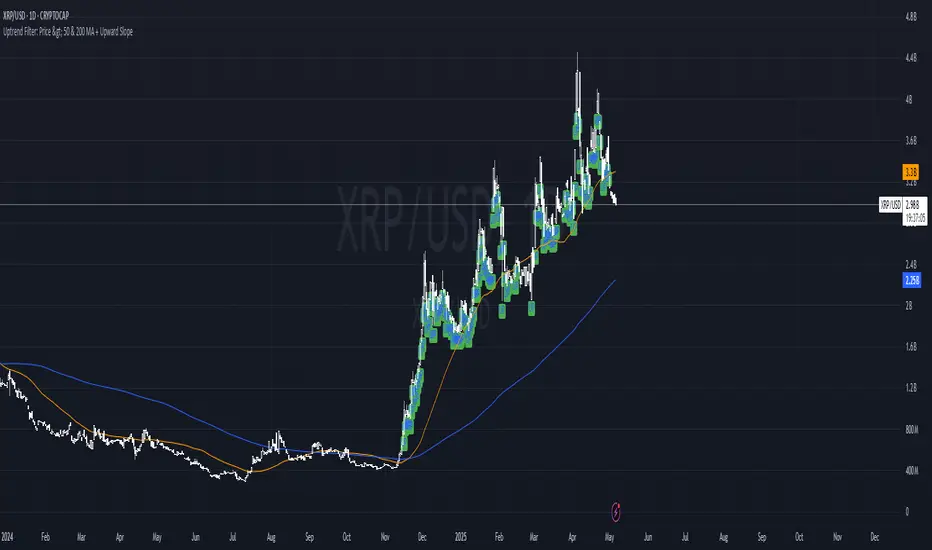
Uptrend Filter: Price > 50 & 200 MA + Upward SlopeThis indicator is designed to help traders instantly identify strong uptrend conditions based on two simple yet powerful criteria:
Price is above both the 50-day and 200-day moving averages
Both moving averages are sloping upward (positive momentum)
When both conditions are met, the indicator plots a green “UP” label below the candle, signaling a valid uptrend setup. This filter is ideal for asset selection in strategy-building, portfolio rotation, or trend-following systems.
🧠 Why it works:
The 50-day MA reflects medium-term momentum.
The 200-day MA represents the long-term trend.
When both are aligned and sloping upward, it confirms strong market structure and trend health.
🧰 Best used for:
Token screening (e.g., filtering altcoins)
Momentum-based entries
Trend confirmation
Risk filtering in strategy backtesting
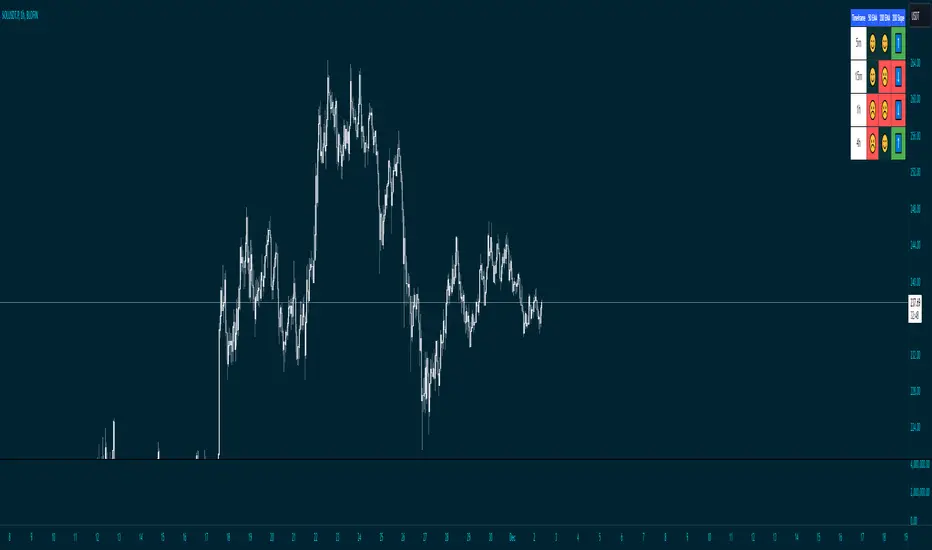
Price Above 50 and 200 EMA with Smiley faces and 200 ema slope
Overview
This advanced indicator provides a comprehensive multi-timeframe analysis of price positioning relative to 50 and 200 Exponential Moving Averages (EMAs), offering traders a quick and intuitive view of market trends across different timeframes.
Key Features
Multi-Timeframe Analysis: Simultaneously evaluates price behavior across 5m, 15m, and other selected timeframes
EMA Trend Visualization: Instantly shows whether price is above or below 50 and 200 EMAs
Slope Direction Indicator: Tracks the directional momentum of the 200 EMA
Customizable Distance Metrics: Option to display distances as absolute values or percentages
Emoji-Based Indicators: Quick visual representation of price positioning
Functionality
The indicator uses color-coded and emoji-based signals to represent:
😊 (Blue): Price is above the EMA
☹️ (Red): Price is below the EMA
⬆️ (Blue): EMA slope is positive
⬇️ (Red): EMA slope is negative
Customization Options
Adjustable EMA periods
Togglable distance display
Distance representation (percentage or absolute value)
Best Used For
Trend identification
Multi-timeframe analysis
Quick market sentiment assessment
Supplementing other technical analysis tools
Recommended Timeframes
Intraday trading
Swing trading
Trend following strategies
Risk Disclaimer
This indicator is a tool for analysis and should not be used in isolation for trading decisions. Always combine with other technical and fundamental analysis, and proper risk management.
Hull Moving Averages 10, 20, 50, 100, 200This script generates multiple Hull Moving Averages (HMAs) on a trading chart, allowing for comprehensive trend analysis across different timeframes. Five HMAs with lengths of 10, 20, 50, 100, and 200 periods are plotted on the chart, providing insights into short, medium, and long-term market trends.
Each HMA can be customized with individual colors to easily distinguish between the different timeframes, helping traders visually track momentum changes and trend strength across these intervals. The Hull Moving Average is known for reducing lag compared to other moving averages, which makes it particularly useful for identifying turning points more accurately.
With this script:
You can adjust the colors of each HMA line individually, ensuring optimal visual differentiation.
You can analyze short-term trends with HMA 10 and HMA 20, medium-term trends with HMA 50, and long-term trends with HMA 100 and HMA 200.
The chart provides an at-a-glance view of multi-timeframe trends, making it useful for trading strategies that rely on crossovers or divergence patterns.
This tool is ideal for traders who want to identify trend direction, strength, and possible reversal points with minimal lag.
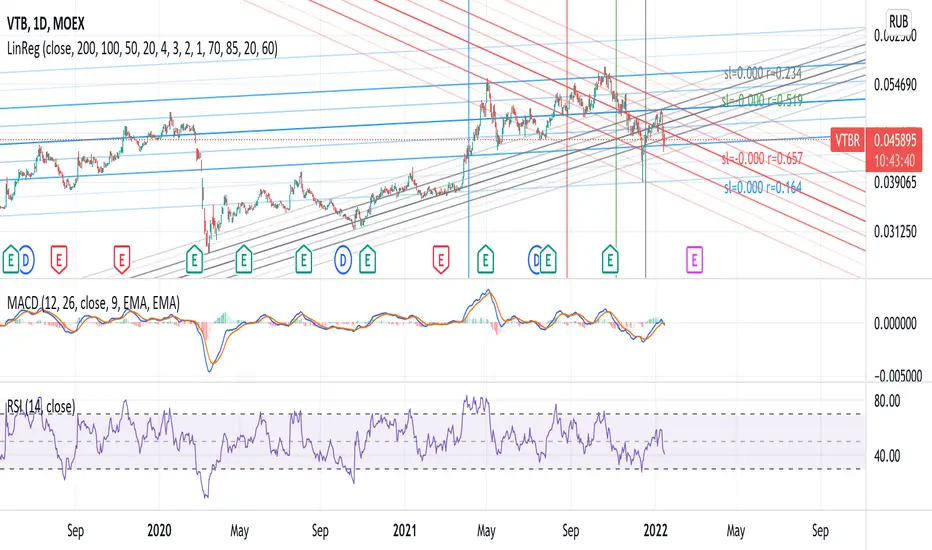
Linear Regression 200/100/50/20Four time frames in one indicator in different colors, showing current price trend in different scopes.
If the slope of the smaller time frame is in a (0,75;1,25) interval of some of the bigger ones the smaller one is omitted (different signs near zero are not coalesced in that way though).
Every time frame has four deltas of range in trend lines of different grade of transparency (2-1-4-3), as well as a vertical line denoting regression date range start, also bearing the same color (blue-red-green-gray for 200/100/50/20).
On the right of the latest bar are Pearson coefficients and slopes of the regressions, 200/100/50/20 bottom-up, also appropriately colored.
McClellan Oscillator for nifty 50This is a indicator which indicates breath of the market.
If found relevant do let me know!!
Only handpicked relevant 20 stocks (20 +ve indicator+ 20 -ve indicator) from different sector .
As there is the limit of 40 script allowed only.
Further modifications might be there if the limit is increased to 100 (50 +50 indicator) .

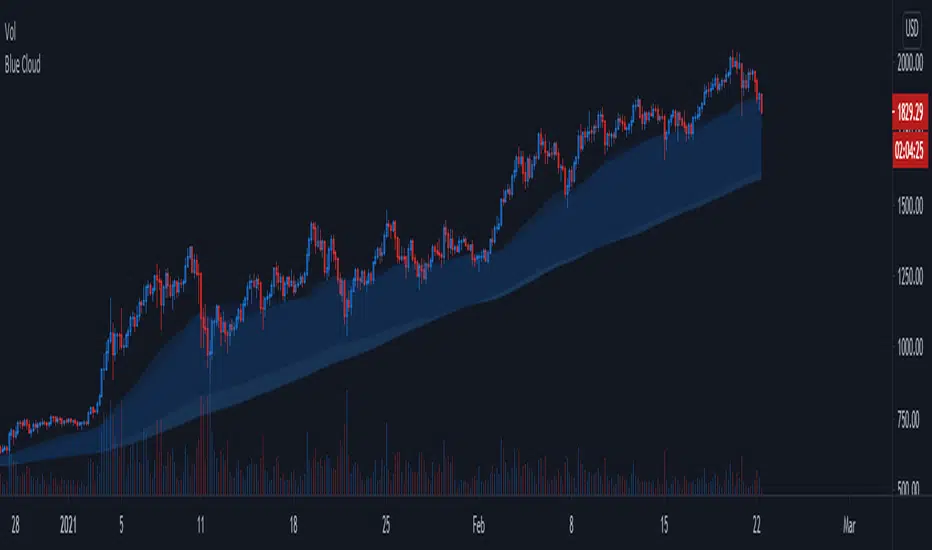
Blue CloudTrend Indicator
- Based on 4h 50/200 ma/ema
- Static, same accross all timeframes
- Works best with trending assets (espacially altcoins)
- 4h 50/200 ma/ema 's are transparent by default but can be enabled to improve visibility
Blue Cloud = Bullish, cloud often acts as support
Red Cloud = Bearish, cloud often acts as resistance
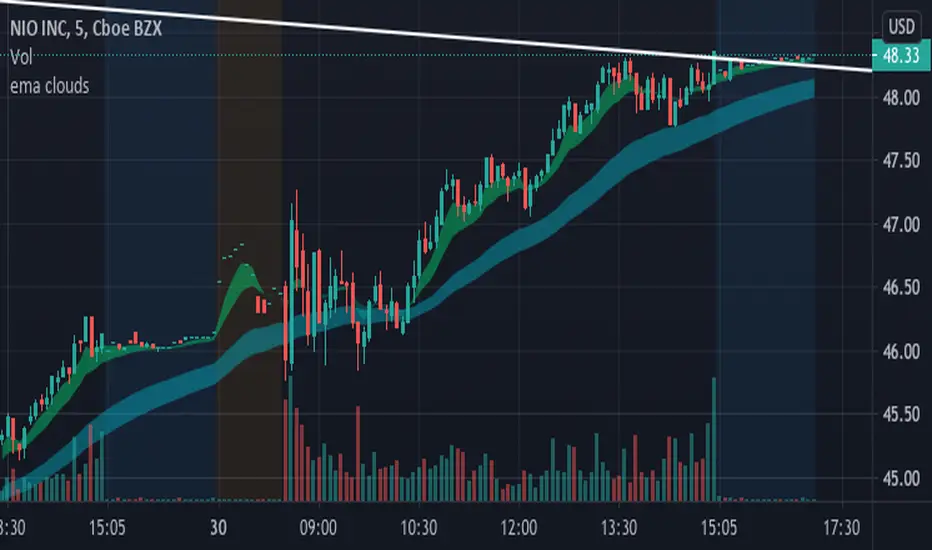
EMA clouds (5/12 and 34/50)This is a custom ema cloud script with a 5/12 cloud and a 34/50 cloud.
Personally, I used to trade with the 20 ema and 50 ema, but wanted something with a little more robust. These clouds are especially great for the first hour of market open since strong bullish stocks that have gapped up overnight tend to follow these trends.
For example, Tesla opened above the clouds and used them as support before running all day.
NIO happened to do a similar move.
SIMPLE MOVING AVG 10,20,50,100,200 with RESOLUTIONThis indicator is the best than all other sma indicators.Because in just one click you can change all the resolution /time frames for all the sma .
Multitime frame analysis can be done in just one click. just change the resolution to
15 min/30 min/1hr- if you intraday trader
1D- LONG TERM INVESTORS.
Multi-timeframe analysis (MTF) is a process in which traders can view the same ticker/indicator using a higher time frame than the chart’s, for example, displaying a daily moving average on a one-hour chart in just two clicks.
How to Use this to Buy Stocks ?
The technical indicator known as the Death cross occurs when the 50-day SMA crosses below the 200-day SMA => Bearish Signal.
An opposite indicator, known as the Golden cross, occurs when the 50-day SMA crosses above the 200-day SMA => Bullish Signal.
Crossovers are one of the main moving average strategies.
1st Strategy is the first type is a price crossover, which is when the price crosses above the sma => Buy signal
when the price crosses below the sma => Sell signal
2nd Strategy is to apply two moving averages to a chart: one longer and one shorter.
When the shorter-term MA (100) crosses above the longer-term MA (200), it's a buy signal, indicates trend is shifting up.
This is known as a "Golden cross."
Meanwhile, when the shorter-term MA (100) crosses below the longer-term MA (200), it's a sell signal, indicates trend is shifting down.
This is known as a "Dead/death cross."
The time frame or length you choose for a moving average, also called the "look back period," can play a big role in how effective it is.
An MA with a short time frame will react much quicker to price changes than an MA with a long look back period. In the figure below, the 20-day moving average more closely tracks the actual price than the 100-day moving average does.
A 20-day MA = more beneficial to a shorter-term trader, since it follows the price more closely.
A 100-day MA = more beneficial to a longer-term trader.
Moving averages work quite well in strong trending conditions but poorly in choppy or ranging conditions.
use this indicator along with Price action theory and not alone.
Moving average crossovers are a popular strategy for both entries and exits. MAs can also highlight areas of potential support or resistance
Happy Trading
