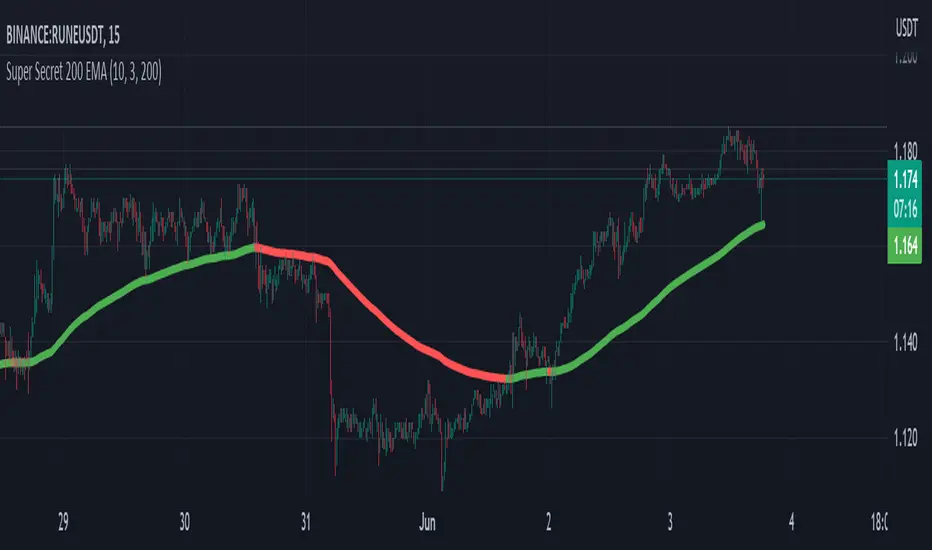
Super Secret 200 EMAThe indicator is called "Super Secret 200 EMA." It combines two technical indicators, the Supertrend and the 200 Exponential Moving Average (EMA), to generate buy and sell opportunities in a trading chart.
Here's how the indicator works and how you can use it:
Supertrend Calculation:
The Supertrend indicator helps identify the current trend in the market. It uses two parameters: Length and Multiplier.
Length: This parameter determines the number of periods used for the calculation.
Multiplier: It controls the width of the Supertrend line, indicating the level of volatility considered in the calculation.
The Supertrend is calculated by looping through the historical data from length to 1.
For each period, it checks whether the closing price has increased or decreased compared to the previous period.
If the closing price has increased, it updates the highestHigh value with the maximum of the current highest high and the high of the current period.
If the closing price has decreased, it updates the lowestLow value with the minimum of the current lowest low and the low of the current period.
Finally, it calculates the Supertrend value using the following formula:
If the change in the closing price is positive: Supertrend = lowestLow + (multiplier * Average True Range (ATR))
If the change in the closing price is negative: Supertrend = highestHigh - (multiplier * ATR)
The Supertrend line will be green if it is above the 200 EMA line and red if it is below.
200 EMA Calculation:
The 200 EMA is a widely used moving average indicator that gives more weight to recent prices.
The EMA period is set to 200 in this case.
The 200 EMA is calculated using the EMA formula, taking into account the closing prices over the specified period.
Plotting:
The Supertrend and 200 EMA lines are plotted on the chart using the plot function.
The Supertrend line is colored green if it is above the 200 EMA line and red if it is below.
The 200 EMA line is colored green if the closing price is above it and red if it is below.
Buy and Sell Conditions:
The indicator determines the buy and sell conditions based on the crossover and crossunder of the closing price with the 200 EMA line and the Supertrend line.
Buy Condition: A buy signal is generated when the closing price crosses above the 200 EMA line and is also above the Supertrend line.
Sell Condition: A sell signal is generated when the closing price crosses below the 200 EMA line and is also below the Supertrend line.
Plotting Buy and Sell Signals:
You can use this indicator to identify potential buy and sell opportunities in your trading strategy. However, please note that this is a simplified explanation, and it's essential to thoroughly understand the indicator's principles and backtest it with historical data before relying on it for actual trading decisions.
Use this with other confluences for best results and never rely on a single indicator
Cerca negli script per "情绪指数板块+约200只股票+选股规则"
200 EMA w/ Ticker Memory200 EMA w/ Ticker Memory — Multi-Symbol & Multi-Timeframe EMA Tracker with Alerts
Overview
The 200 EMA w/ Ticker Memory indicator allows you to monitor the 200-period Exponential Moving Average (EMA) across multiple symbols and timeframes. Designed for traders managing multiple tickers, it provides customizable timeframe inputs per symbol and instant alerts on price touches of the 200 EMA.
Key Features
Multi-symbol support: Configure up to 20 different symbols, each with its own timeframe setting.
Flexible timeframe input: Assign specific timeframes per symbol or use a default timeframe fallback.
Accurate 200 EMA calculation: Uses request.security to fetch 200 EMA from the symbol-specific timeframe.
Visual EMA plots: Displays both the EMA on the selected timeframe and the EMA on the current chart timeframe for comparison.
Touch alerts: Configurable alerts when price “touches” the 200 EMA within a user-defined sensitivity percentage.
Ticker memory: Remembers your configured symbols and displays them in an on-chart table.
Compact info table: Displays current symbol status, alert settings, and timeframe in a clean, transparent table overlay.
How to Use
Configure Symbols and Timeframes:
Input your desired symbols (up to 20) and their respective timeframes under the “Symbol Settings” groups in the indicator’s settings pane.
Set Default Timeframe:
Choose a default timeframe to be used when no specific timeframe is assigned for a symbol.
Adjust Alert Settings:
Enable or disable alerts and set the touch sensitivity (% distance from EMA to trigger alerts).
Alerts
Alerts trigger once per bar when the price touches the 200 EMA within the defined sensitivity threshold.
Alert messages include:
Symbol / Current price / EMA value / EMA timeframe used / Chart timeframe / Timestamp
Customization
200 EMA Color: Change the line color for better visibility.
Touch Sensitivity: Fine-tune how close price must be to the EMA to count as a touch (default 0.1%).
Enable Touch Alerts: Turn on/off alert notifications easily.
For:
- Swing traders monitoring multiple stocks or assets.
- Day traders watching key EMA levels on different timeframes.
- Analysts requiring a quick visual and alert system for 200 EMA touches.
- Portfolio managers tracking key technical levels across various securities.
Limitations
Supports up to 20 configured symbols (can be extended manually if needed).
Works best on charts with reasonable bar frequency due to request.security usage.
Alert frequency is limited to once per bar for clarity.
Disclaimer
This indicator is provided “as-is” for educational and informational purposes only. It does not guarantee trading success or financial gain.

200 EMA Breakout & Retest Strategy200 EMA Breakout & Retest Strategy
This script is designed for traders who rely on the 200 EMA as a key indicator for trend direction and trade setups. The strategy identifies potential buy and sell opportunities based on breakouts and subsequent retests of the 200 EMA.
How It Works
EMA Breakout Detection:
The script monitors when the price crosses and closes above or below the 200 EMA.
No signal is generated immediately upon the breakout.
Retest Confirmation:
After the breakout, the price must retrace to touch the 200 EMA.
A valid signal occurs only when the price touches the EMA and the candle closes above (for buy) or below (for sell).
Trade Signal Generation:
Once the retest is confirmed:
A Buy Signal is generated if the price closes above the 200 EMA after the retest.
A Sell Signal is generated if the price closes below the 200 EMA after the retest.
The script calculates:
Stop Loss: Placed at the low of the candle for a buy signal and at the high of the candle for a sell signal.
Take Profit: Based on a customizable Risk-Reward Ratio (default is 1:2).
Visual Indicators:
The 200 EMA is plotted on the chart for reference.
Buy/Sell signals are displayed as labels on the chart.
Stop loss and take profit levels are drawn using dotted lines.
Customization Options
EMA Length: Adjustable (default is 200).
Risk-Reward Ratio: Customizable to suit different trading styles.
Who Is This For?
This strategy is ideal for traders who:
Prefer trading with the trend using EMA-based strategies.
Look for precise entry points with confirmation from retests.
Require automated calculation of risk-reward levels.

Daily 50‑ & 200‑SMA Ceiling Radar — EnhancedDescription:
This custom TradingView indicator, developed by Trader Malik and licensed under Trades Per Minute, is a powerful visual tool for identifying how price behaves relative to major daily moving averages — the 50-SMA and 200-SMA. It helps traders quickly understand key technical dynamics such as trend alignment, MA proximity, and short-term momentum sentiment — all displayed on a clean, minimal overlay with visual alerts and an adjustable data table.
FEATURES
1. Daily 50 & 200 Simple Moving Averages (SMA):**
- Displayed directly on the chart using distinct blue and orange lines.
- These serve as primary trend filters and support/resistance zones.
2. Price Highlighting:
- A red background flashes momentarily when the price crosses either the 50-SMA or 200-SMA.
- A green background fills the chart when price is above both MAs (bullish zone).
- A red background persists if price is below both MAs (bearish zone).
3. MA Gap Analysis Table:
- 50-SMA Row**: Shows % gap between 50-SMA and 200-SMA.
- 200-SMA Row**: Shows % gap between 200-SMA and 50-SMA.
- Sentiment Row**: Displays short-term trend bias based on the slope of the past 7 daily closes — Bullish, Neutral, or Bearish.
USER SETTINGS
Table Location: Choose between **Top Right** or **Bottom Right** of the chart.
Table Size: Select **Small**, **Medium**, or **Large** to suit screen preferences and layout aesthetics.
This script is **intellectual property of Trades Per Minute** and distributed by **Trader Malik** for use under licensing terms. Redistribution or repurposing without authorization is strictly prohibited.

Dynamic 200 EMA with Trend-Based ColoringDescription:
This script plots the 200-period Exponential Moving Average (EMA) and dynamically changes its color based on the trend direction. The script helps traders quickly identify whether the price is above or below the 200 EMA, which is widely used as a long-term trend indicator.
How It Works:
The script calculates the 200 EMA based on the closing price.
If the price is above the EMA, it suggests a bullish trend, and the EMA line turns green.
If the price is below the EMA, it suggests a bearish trend, and the EMA line turns red.
An optional background color is added to enhance visual clarity, highlighting the current trend direction.
Use Cases:
Trend Confirmation: Helps traders determine if the overall trend is bullish or bearish.
Support and Resistance: The 200 EMA is often used as dynamic support/resistance.
Entry & Exit Signals: Traders can use crossovers with the 200 EMA as potential trade signals.
This script is designed for traders looking for a simple yet effective way to incorporate trend visualization into their charts. It is fully open-source and can be customized to fit individual trading strategies.

200-Week EMA % Difference200-Week EMA Percentage Difference Indicator – Understanding Market Stretch & Reversion
What This Indicator Does
Even if an individual stock is delivering strong earnings and solid fundamentals, it is still influenced by overall market sentiment. When the broader market begins reverting to its long-term mean, stocks—no matter how strong—are often pulled down along with it. Unrealized gains can erode if one ignores these macro movements.
The 200-Week EMA Percentage Difference indicator measures how far the price of an asset or index has moved away from its 200-week Exponential Moving Average (EMA) in percentage terms. This provides a reliable gauge of whether the market is overstretched (overbought) or pulling back to support (oversold) relative to a long-term trend.
How It Helps Investors
Identifying Market Extremes:
When the indicator moves into the 50-80% range, historical trends show that broad-based indices like BSE Smallcap, Nifty 500, Nifty Microcap, and Nifty Smallcap 250 have often experienced corrections.
This suggests that the market may be overextended, and investors should exercise caution.
Spotting Support Zones:
Past data indicates that when the percentage difference falls back to around 30%, the market often finds a new support level, leading to fresh buying opportunities.
This can help long-term investors identify favorable entry points.
Mean Reversion & Market Cycles:
The indicator essentially measures how far these indices have stretched from their long-term mean (200-week EMA).
Extreme deviations from the EMA often result in mean reversion, where prices eventually return to more sustainable levels.
How to Use It in Broad-Based Indices
Above 50-80% → Caution Zone: Historically associated with market tops or overheated conditions.
Around 30% → Support Zone: A potential level where corrections stabilize and new market uptrends begin.
By applying this indicator to indices like BSE Smallcap, Nifty 500, Nifty Microcap, and Nifty Smallcap 250, investors can gauge market strength, anticipate corrections, and position themselves strategically for long-term opportunities.

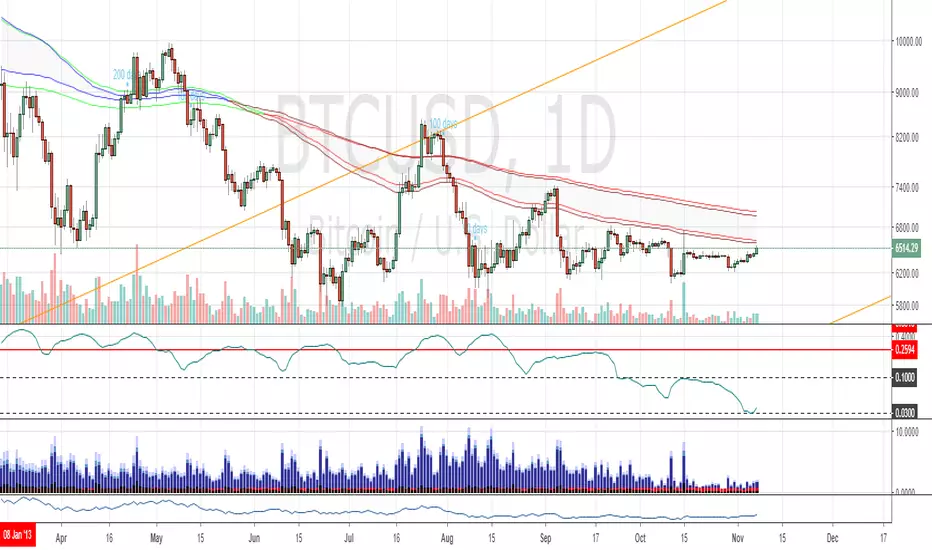
200 Week Moving Average Heatmap200 Week Moving Average Heatmap
In each of its major market cycles, Bitcoin's price historically bottoms out around the 200 week moving average.
This indicator uses a colour heatmap based on the delta % changes of 200 week sma compare to 4 week ago 200 week sma.
It is a long term investment tool. It helps investors to monitor a changes in price. And see where is a bottom or top based on heatmap
How to read heatMap:
Below a rainbow box which is a representation of heat map strength you can see current value score of price from -1 to 1
Also you can send those values with alert
Delta (you can plot it in settings):
Top:
Bottom:
Originaly it was Created By Plan B - @100trillionUSD, I just recreated it in Trading View without knowing a code, just have a formula, so it can have some inaccuracy compare to the original, but still it will work how it was designed.

Bitstamp BTC Horizontal 200 Week SMAsmall change to my horizontal 200 week SMA script.
Plots the latest 200 week SMA value from Bitstamp BTCUSD on the chart. I use it for the Bitmex chart, as Bitmex doesn't have enough history for a 200 week moving average.

Horizontal 200 Week SMAfor horizontal level traders that don't want to disregard the 200 week SMA.
Plots a horizontal line for the latest 200 week SMA value in lieu of a wavy line.
Open the indicator's settings and check the "Price Line" box for max visibility

50-100-200 Day SMAA simple indicator that display the 50, 100, and 200 Daily SMA. It will always display the DAILY 50,100, 200, regardless of the time frame you are looking at. Makes it easy to quickly display these key averages while also looking at smaller timeframes like 1H candles.

Triple EMA (20, 50, 200) w/ LabelsI've combined the 20, 50, and 200 day exponential moving averages and added labels.
I created this due to finding EMA scripts that are either nothing but ugly to look at or have extra "features" that serve no purpose.
This gets rid of the clutter and gives a simple triple EMA with labels.
Labels are optional, you can turn them off in the settings.


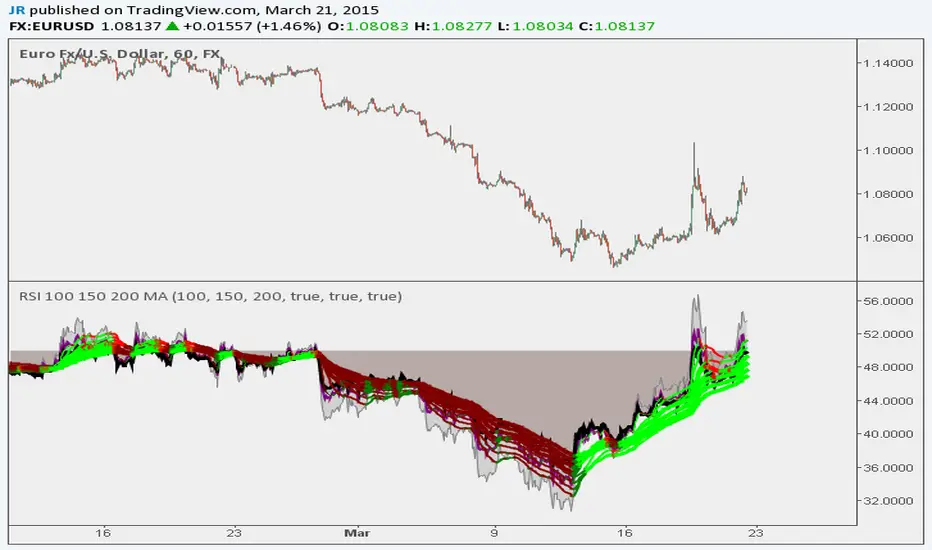
RSI 100 150 200 MA Ribbon
Following Trends and Finding Divergences
Here is a script example that uses a long length (100, 150, 200) RSI MA Ribbon to detect trend reversals using lower time frames. You can also use traditional RSI to find divergences.
Built Best for 1H to 10 Min Charting
BTCUSD

200-EMA Moving Average RibbonThis indicator plots a series of moving averages (EMA)
to create a "ribbon" that offers a great visual structure
to price action.

200 EMA AlertHow It Works:
The 200 EMA calculates the average price over the last 200 periods, giving more weight to recent price movements for a smoother and more responsive trend line.
It helps traders determine whether the market is in a bullish (above 200 EMA) or bearish (below 200 EMA) phase.
Why Traders Use the 200 EMA:
✅ Trend Confirmation – If the price is above the 200 EMA, the trend is bullish; if below, the trend is bearish.
✅ Dynamic Support & Resistance – Price often reacts around the 200 EMA, making it a key level for entries and exits.
✅ Works on All Timeframes – Whether on the 1-minute chart or the daily timeframe, the 200 EMA is effective for scalping, swing trading, and long-term investing.
✅ Easy to Combine with Other Indicators – Traders pair it with RSI, MACD, or price action for stronger confirmation.
How to Use It in Trading:
📌 Trend Trading – Buy when price pulls back to the 200 EMA in an uptrend; sell when price retests it in a downtrend.
📌 Breakout Strategy – A strong candle breaking above/below the 200 EMA signals a possible trend reversal.
📌 Filtering Trades – Many traders only take long trades above and short trades below the 200 EMA to align with the overall market trend.
Conclusion:
The 200 EMA is an essential indicator for traders of all levels, offering clear trend direction, strong support/resistance zones, and trade filtering for better decision-making. Whether you're trading forex, stocks, or crypto, mastering the 200 EMA can give you a significant edge in the markets. 🚀📈

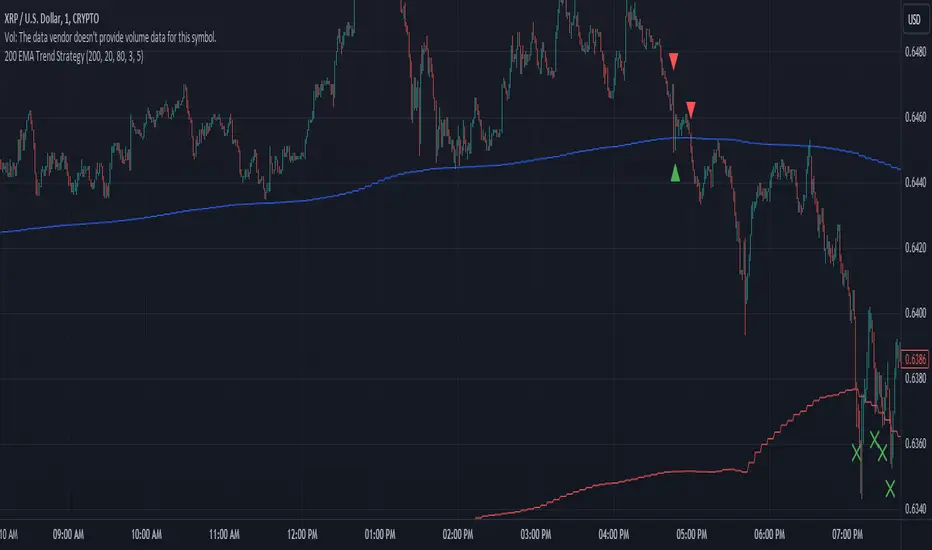
200 EMA Trend Strategy Anti meanDescription:
The "200 EMA Trend Strategy" is a versatile technical analysis tool designed for day trading and long-term investing. It aims to identify potential trend reversal points in the market based on the interaction between the price and the 200-period Exponential Moving Average (EMA). This strategy utilizes the 200 EMA, standard deviation bands, and basic trend analysis to generate buy and sell signals.
Key Features:
200-period Exponential Moving Average (EMA): The indicator plots the 200-period Exponential Moving Average, a reliable trend-following indicator that smooths out price data to identify the underlying trend direction.
Standard Deviation Bands: Upper and lower bands around the 200 EMA are calculated based on a specified standard deviation multiplier. These bands help identify potential overbought and oversold levels in the market.
Trend Signals: Buy signals are generated when the price crosses above the 200 EMA, indicating a potential bullish trend, while sell signals are generated when the price crosses below the 200 EMA, indicating a potential bearish trend.
Exit Signals: Exit signals are triggered when the price moves beyond the standard deviation bands in the opposite direction of the current trend. Most trades will be exited with minimal losses, aiming to grow the trading account over time. Multiple exit signals may be displayed, but only the first signal will be considered, ignoring subsequent signals to minimize drawdown.
Usage:
Day Trading: For intraday trading, traders can use a one-minute chart and fix the indicator's timeframe to five minutes. This allows for quick decision-making and minimizes drawdown by focusing on short-term price movements.
Long-Term Investing: For long-term investing, traders can utilize a four-hour or two-hour chart and fix the indicator's timeframe to daily or one-day timeframe. This provides a broader perspective of the market trends and allows for strategic positioning over longer time horizons.
Risk Management: Employ proper risk management techniques and position sizing strategies to mitigate losses and maximize profits. Use the indicator's exit signals to exit trades with minimal losses and allow profitable trades to grow the trading account over time.
Risk Disclosure: Trading involves risks, and this indicator should be used as part of a comprehensive trading strategy. It is essential to consider risk management principles and employ proper position sizing techniques when trading based on the signals generated by this indicator.
200 MAPD - Relative Price with candlesticks and divergenceThis is a MAPD (moving average percent difference) indicator that plots the results in candlestick format and with an option to show divergencies of a specific look back period. It's built with 200 moving average, which cannot be adjusted. A divergence is when the actual asset price moves in the opposite direction than the MAPD.
MAPD measures the percent difference of the asset price from the moving average, in this case, 200 moving average.
MAPD is my favorite indicator because it's an leading indicator, capable of predicting upcoming directions pretty accurately if you learn how to use it and how it works on your specific asset. With candlesticks instead of line you can also apply your own price action techniques.
I created this to be somewhat of a substitute for the actual price of the asset, meaning that price action analysis should be applied on this indicator and asset price is used as a secondary to spot divergencies.
The chart showing on this description is my own discretionary plotting of technical aspects. Divergencies will be enabled per default, but my preference is to have them off and plot my own analysis. And turn them on to get an overview from time to time. You can also change the look back period for the divergencies as you like.
I would say it works best from 1 hour to 1 day, maybe 1 week if you're bottom fishing in a big bear trend.
If you try it out and like it i would love to hear how you find it useful in the comments, will be helpful for me and others :)

200/100 vs 190/80 EMA [jarederaj]Track the 200/100 EMA cross Vs the 180/90 EMA cross. Also, see the dates when these periods start on the chart.
Percent of Time Above 200 EMA (3 Years)This script calculates how much time (in percentage)
a stock has spent trading ABOVE its 200-day EMA
over the last 3 years (approx. 756 trading days).
🔎 How it works:
1. Calculates 200 EMA.
2. Looks back ~252 trading days × 3 years = 756 bars.
3. Counts how many days closed above the 200 EMA.
4. Divides by total bars → percentage.
5. Shows result as a label on the latest candle.
✅ Example:
If the result shows 65%, it means in the last 3 years
the stock closed ABOVE the 200 EMA on 65% of trading days.
⚠️ Notes:
- Uses daily chart data (switch to 1D timeframe).
- If the stock has <3 years of history,
it uses available data.
- You can change "lookbackYears" input to 1, 2, 5, etc.
