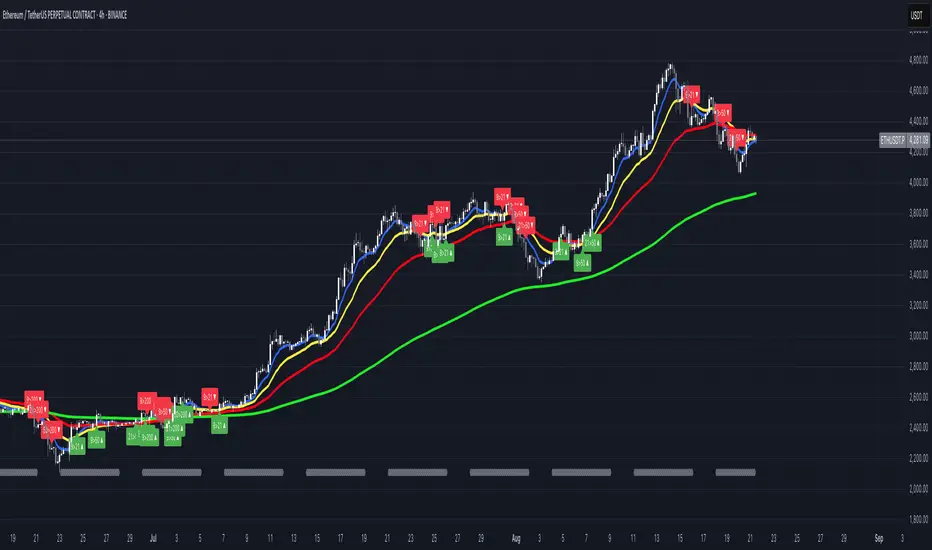
Bollinger Bands + EMA 200 + EMA 50This indicator combines three technical analysis tools: the Bollinger Bands (BB), and two Exponential Moving Averages (EMA) with periods of 200 and 50.
Bollinger Bands (BB): This indicator consists of three lines—the middle line being a simple moving average (SMA), and the upper and lower bands representing two standard deviations above and below the SMA. The width of the bands indicates market volatility, with wider bands signifying higher volatility and narrower bands indicating lower volatility.
Exponential Moving Averages (EMA 200 and EMA 50): The EMA is a type of moving average that gives more weight to recent prices, making it more responsive to price changes than the simple moving average. The EMA 200 is considered a long-term trend indicator, often used to identify the overall direction of the market. The EMA 50 is a medium-term trend indicator, helping to spot more immediate market trends. Crossovers between these two EMAs (such as when EMA 50 crosses above EMA 200) are commonly used as buy or sell signals, with the idea that a short-term trend shift is occurring.
By combining these three indicators, this custom Pine Script aims to give a comprehensive view of the market conditions, helping traders to understand both the volatility (via BB), the long-term market trend (via EMA 200), and the medium-term trend (via EMA 50). The interaction between the price and these indicators, along with crossovers, can be used to identify potential entry and exit points.
Cerca negli script per "情绪指数板块+约200只股票+选股规则"

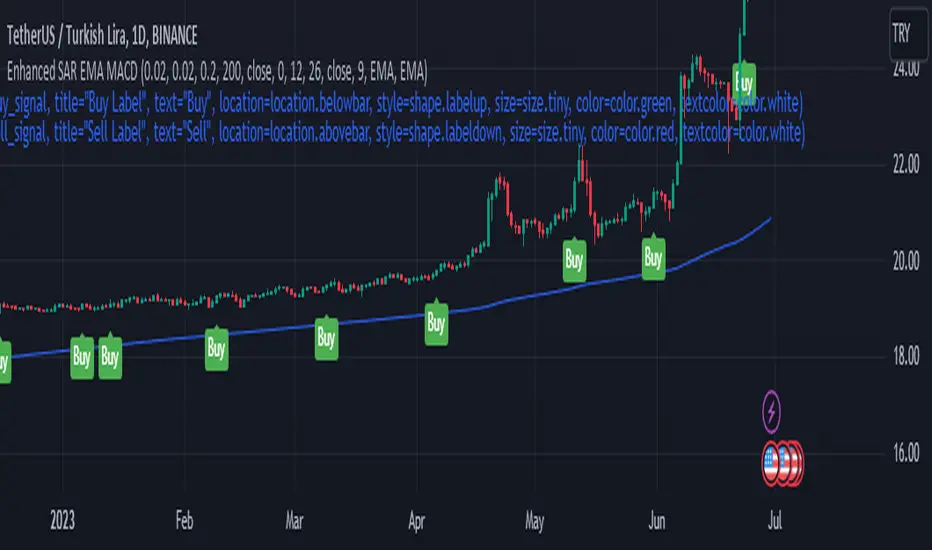
Enhanced Parabolic SAR + EMA 200 + MACD SignalsParabolic SAR + EMA 200 + MACD Signals Indicator is a popular technical analysis tool used by traders to identify potential entry and exit points in the market. It combines three widely used indicators: Parabolic SAR, EMA 200, and MACD.
The Parabolic SAR indicator helps determine potential price reversals. It places dots above or below the price chart to indicate the direction of the trend. When the dots are below the price, it suggests an upward trend, and when they are above the price, it indicates a downward trend.
The EMA 200 (Exponential Moving Average 200) is a moving average that gives more weight to recent price data. It is often used as a significant support or resistance level. Traders consider the price to be in an uptrend if it is above the EMA 200 and in a downtrend if it is below the EMA 200.
The MACD (Moving Average Convergence Divergence) is a trend-following momentum indicator that calculates the difference between two exponential moving averages. It consists of a MACD line and a signal line. When the MACD line crosses above the signal line, it generates a bullish signal, indicating a potential buying opportunity. Conversely, when the MACD line crosses below the signal line, it generates a bearish signal, suggesting a potential selling opportunity.
To use the MACD-Parabolic SAR-EMA200 Indicator for trading, you can follow these guidelines:
Buy conditions:
1. The price should be above the EMA 200.
2. The Parabolic SAR should indicate an upward trend (dots below the price).
3. The MACD delta (the difference between the MACD line and the signal line) should be positive.
Sell conditions:
1. The price should be below the EMA 200.
2. The Parabolic SAR should indicate a downward trend (dots above the price).
3. The MACD delta should be negative.
By combining these three indicators, traders can gain additional confirmation of the overall trend direction and make more informed trading decisions. However, it's important to note that no indicator guarantees successful trades, and it's always advisable to use additional analysis and risk management techniques in conjunction with technical indicators.
WMA 200 WMA 150 MA 200 by EstebanWMA 200 WMA 150 MA 200 by Esteban
Media móvil ponderada de 200 sesiones y 150 sesiones.
Media móvil simple de 200 sesiones.

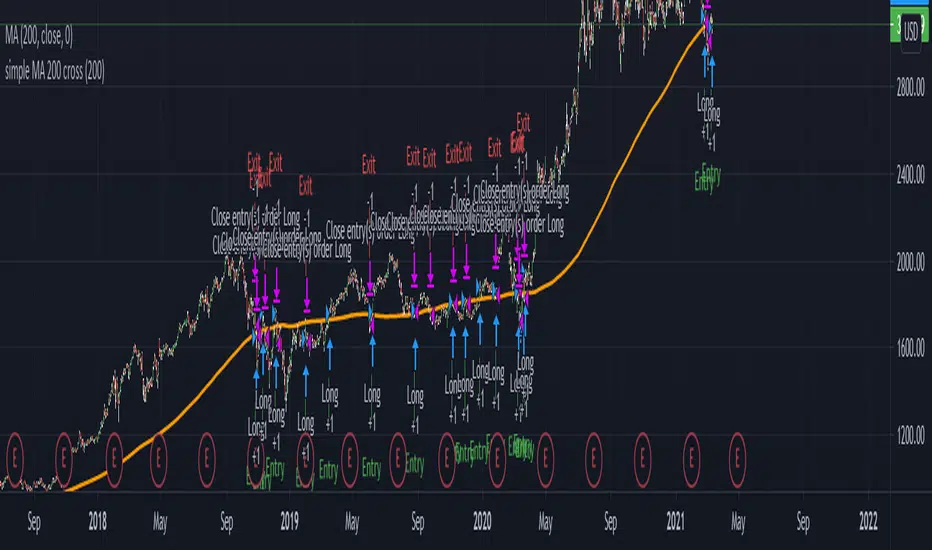
Basic SMA 200 StrategyThe SMA 200 basic strategy will be more than familiar to most traders.
This strategy is to stay with the programming language so to say the "Hello World" of trading.
The SMA 200 basic strategy is also one of the simplest strategies in trading. All that is required is the price and a 200 period moving average. Usually the strategy is used in the daily chart.
The rules are as follows:
Entry: A position is opened when the price crosses the moving average 200 from the bottom to the top.
Exit: The position is closed when the price crosses the moving average from top to bottom.
This is a trend following system and was originally used for trading stocks.
In my opinion, trading with the strategy is recommended to every beginner. There are strategies with better performance, but they are much more complicated to implement. And that's where the big advantage of the strategy can be seen.
Beginners are more than overwhelmed at the beginning of their trading career. Often beginners trade in the 5 min chart with 6 different indicators some signals that they have seen in a Youtube video.
Comparable to a beginner driver who immediately gets into a Porsche as his first car.
Beginners should follow simple rules and avoid intraday charts. Above all, you should do the actual work of a trader.A trader does not just press the mouse twenty times a day and then has easily earned 2000 $. A trader tests systems down to the smallest detail, optimizes and tests again, until he has found an almost " waterproof " trading system. The 200 SMA basic strategy is excellent for gaining experience, learning to follow the rules of a system and not to burn your money right away.
With this script you can test how successful the "simplest strategy in the world" would have been in the past.
Small tip: Do not trade Forex with it it will never work. The strategy is made for long trends and you can find them for example in the stock market.
Have fun with it! About a positive feedback I would be very happy of course.
[teachershim] draw sma 9/25/50/100/200/400📌 Description — draw sma 9/25/50/100/200/400
This indicator displays Simple Moving Averages (SMA) for periods 9, 25, 50, 100, 200, and 400 on the chart.
It also marks the last confirmed bar’s SMA values with circular dots positioned to the right by a user-defined offset,
and labels each dot with the SMA period number for quick visual reference.
🔹 Features
SMA Lines
Plots SMA lines for periods 9 / 25 / 50 / 100 / 200 / 400 in distinct colors and thickness.
Last Value Markers
Adds circular markers (dots) at the SMA value of the last confirmed bar, shifted right by the specified offset.
SMA Period Labels
Displays the SMA period number (e.g., "9", "25", "50") just above each dot.
Customizable Parameters
Right offset for marker placement.
Vertical gap between marker and label (in percentage of chart range).
🔹 Parameters
Right Offset: Number of bars to place the marker/label to the right of the last bar.
Text Vertical Gap (%): Percentage offset to position the label above the dot.
🔹 Colors & Line Thickness
SMA 9 → Teal, thickness 1
SMA 25 → Orange, thickness 2
SMA 50 → Blue, thickness 2
SMA 100 → Purple, thickness 1
SMA 200 → Red, thickness 2
SMA 400 → Gray, thickness 1
🔹 Use Cases
Quickly identify key support/resistance levels across multiple SMA periods.
Instantly see the current SMA values without hovering over the chart.
Monitor SMA alignment and spacing for trend analysis or trading setups.
💡 Notes
If the right offset is too large, ensure your chart’s right margin is wide enough to display the markers.
max_labels_count in Pine Script limits how many labels can be displayed at once.
If you want, I can also make you a shorter, more concise “marketplace style” version for TradingView’s public library so it’s punchier and attracts more clicks.
Do you want me to prepare that?

Fibo_Ma with Toggleable 200 EMA Filter Fibo_MA with Toggleable 200 EMA Filter
Description:
This multi-functional indicator blends Fibonacci-based moving averages with customizable filters and visual enhancements to support various trading strategies. It offers traders the flexibility to analyze trend dynamics and potential reversal zones using multiple tools in one script.
Key Features:
🔹 Fibonacci MA Framework
Leverage a range of Fibonacci numbers (from 1 to 233) to visualize trend-based EMA lines with optional smoothing. Users can choose the moving average method (SMA, EMA, RMA, WMA, VWMA, etc.) and adjust the smoothing length for fine-tuned analysis.
🔹 VWAP and Dynamic EMA Tools
Includes VWAP and a color-coded 200 EMA that updates based on trend slope. These help visualize key dynamic support and resistance levels.
🔹 Multi-Timeframe Support
Option to switch the data source to a higher timeframe for broader trend confirmation.
🔹 Signal Highlights
Bullish and bearish signal markers based on crossovers with optional filters.
Background highlights show whether the current price is above or below a smoothed EMA line.
🔹 Customizable Filters
Enable or disable filters like:
200 EMA Position Filter (only signal when price is above or below the 200 EMA)
ATR Filter (filter out low-volatility candles)
Volume Filter (signal only on sufficient volume)
🔹 Cross Alerts & Labels
Built-in alert conditions for crossovers and customizable signal display options—labels, shapes, and background highlights.
🔹 Advanced Options
Toggle forecast line visibility and offset
Fine-tune alerts using price action relative to the smooth trend line
Optional tail and cross label display for deeper chart customization
How to Use:
This tool can support trend-following, breakout, and pullback strategies. Customize the MA types, filters, and timeframe settings to match your trading style. The script is designed for visual clarity while offering rich configurability for discretionary and system-based traders.

Green/Red Candle Probability (EMA 7, SMA 20, SMA 200)### Strategy Explanation for Candle Probability Indicator
This script is designed to calculate the **probability of bullish (green) and bearish (red) candles** over a given analysis period. It leverages three key moving averages to identify market trends and display these probabilities directly on the chart, making it easier for traders to make informed decisions.
#### **How the Script Works:**
1. **Trend Detection Using Moving Averages:**
- The script calculates three moving averages:
- **EMA (Exponential Moving Average) over 7 periods**
- **SMA (Simple Moving Average) over 20 periods**
- **SMA over 200 periods**
The trend is classified as:
- **Bullish:** When EMA 7 > SMA 20 > SMA 200
- **Bearish:** When EMA 7 < SMA 20 < SMA 200
2. **Candle Analysis:**
The script analyzes the last "n" candles (based on the user-defined lookback period) to count the number of bullish and bearish candles:
- **Bullish (green) candle:** The closing price is higher than the opening price.
- **Bearish (red) candle:** The closing price is lower than the opening price.
3. **Probability Calculation:**
The probabilities are calculated as a percentage of bullish and bearish candles in the lookback period:
- **Green Probability (%) = (Number of Green Candles / Lookback Period) × 100**
- **Red Probability (%) = (Number of Red Candles / Lookback Period) × 100**
4. **Displaying Results in a Table:**
The results are displayed in a table on the chart, including:
- **Green Probability (%)**
- **Red Probability (%)**
- **Current Trend (Bullish, Bearish, or Neutral)**
#### **Strategy Overview:**
This indicator provides traders with a quick overview of the candle probabilities and the current market trend based on moving averages. It helps traders:
- Gauge the likelihood of bullish or bearish candles appearing in the near future.
- Identify the prevailing trend (bullish, bearish, or neutral).
- Adjust their trading strategies based on statistical probabilities rather than assumptions.
### **Important Notes:**
- The lookback period can be customized between **10 and 200 periods**.
- The indicator does not provide buy/sell signals but gives insights into market behavior.
By understanding the candle probabilities and the trend, traders can better assess market conditions and improve their decision-making process.

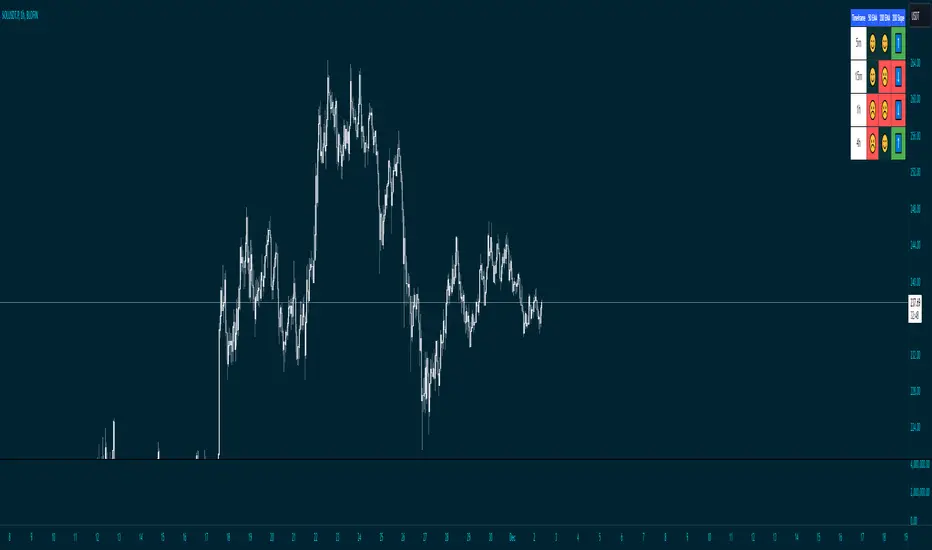
Price Above 50 and 200 EMA with Smiley faces and 200 ema slope
Overview
This advanced indicator provides a comprehensive multi-timeframe analysis of price positioning relative to 50 and 200 Exponential Moving Averages (EMAs), offering traders a quick and intuitive view of market trends across different timeframes.
Key Features
Multi-Timeframe Analysis: Simultaneously evaluates price behavior across 5m, 15m, and other selected timeframes
EMA Trend Visualization: Instantly shows whether price is above or below 50 and 200 EMAs
Slope Direction Indicator: Tracks the directional momentum of the 200 EMA
Customizable Distance Metrics: Option to display distances as absolute values or percentages
Emoji-Based Indicators: Quick visual representation of price positioning
Functionality
The indicator uses color-coded and emoji-based signals to represent:
😊 (Blue): Price is above the EMA
☹️ (Red): Price is below the EMA
⬆️ (Blue): EMA slope is positive
⬇️ (Red): EMA slope is negative
Customization Options
Adjustable EMA periods
Togglable distance display
Distance representation (percentage or absolute value)
Best Used For
Trend identification
Multi-timeframe analysis
Quick market sentiment assessment
Supplementing other technical analysis tools
Recommended Timeframes
Intraday trading
Swing trading
Trend following strategies
Risk Disclaimer
This indicator is a tool for analysis and should not be used in isolation for trading decisions. Always combine with other technical and fundamental analysis, and proper risk management.
Williams %R Cross Strategy with 200 MA Filter
1. The script is a trading strategy based on the Williams %R indicator and a 200-period moving average (MA) filter.
2. The user can input the length of the Williams %R indicator (`wrLength`), the threshold for %R crossing (`crossPips`), the take profit level in pips (`takeProfitPips`), and the stop loss level in pips (`stopLossPips`).
3. The script calculates the Williams %R using the `ta.highest` and `ta.lowest` functions to find the highest high and lowest low over the specified length (`wrLength`).
4. It also calculates a 200-period simple moving average (`ma200`) using the `ta.sma` function.
5. The entry conditions are defined as follows:
- For a long entry, it checks if the Williams %R crosses above the -50 line by a threshold of `crossPips` and if the close price is above the 200-period MA.
- For a short entry, it checks if the Williams %R crosses below the -50 line by a threshold of `crossPips` and if the close price is below the 200-period MA.
6. The exit conditions are defined as follows:
- For a long position, it checks if the close price reaches the take profit level (defined as the average entry price plus `takeProfitPips` in pips) or the stop loss level (defined as the average entry price minus `stopLossPips` in pips).
- For a short position, it checks if the close price reaches the take profit level (defined as the average entry price minus `takeProfitPips` in pips) or the stop loss level (defined as the average entry price plus `stopLossPips` in pips).
7. The script uses the `strategy.entry` function to place long and short orders when the respective entry conditions are met.
8. It uses the `strategy.close` function to close the long and short positions when the respective exit conditions are met.
The script allows you to customize the parameters such as the length of Williams %R, the crossing threshold, take profit and stop loss levels, and the moving average period to suit your trading preferences.

Parabolic SAR + EMA 200 + MACD SignalsParabolic SAR + EMA 200 + MACD Signals Indicator, a powerful tool designed to help traders identify optimal entry points in the market.
This indicator combines three popular technical indicators: Parabolic SAR (Stop and Reverse), EMA200 (Exponential Moving Average 200) and MACD (Moving Average Convergence Divergence) - to provide clear and concise buy and sell signals based on market trends.
The MACD component of this indicator calculates the difference between two exponentially smoothed moving averages, providing insight into the trend strength of the market. The Parabolic SAR component helps identify potential price reversals, while the EMA200 acts as a key level of support and resistance, providing additional confirmation of the overall trend direction.
Whether you're a seasoned trader or just starting out, the MACD-Parabolic SAR-EMA200 Indicator is a must-have tool for anyone looking to improve their trading strategy and maximize profits in today's dynamic markets.
Buy conditions
The price should be above the EMA 200
Parabolic SAR should show an upward trend
MACD Delta should be positive
ُSell conditions
The price should be below the EMA 200
Parabolic SAR should show an downward trend
MACD Delta should be negative

SIMPLE MOVING AVG 10,20,50,100,200 with RESOLUTIONThis indicator is the best than all other sma indicators.Because in just one click you can change all the resolution /time frames for all the sma .
Multitime frame analysis can be done in just one click. just change the resolution to
15 min/30 min/1hr- if you intraday trader
1D- LONG TERM INVESTORS.
Multi-timeframe analysis (MTF) is a process in which traders can view the same ticker/indicator using a higher time frame than the chart’s, for example, displaying a daily moving average on a one-hour chart in just two clicks.
How to Use this to Buy Stocks ?
The technical indicator known as the Death cross occurs when the 50-day SMA crosses below the 200-day SMA => Bearish Signal.
An opposite indicator, known as the Golden cross, occurs when the 50-day SMA crosses above the 200-day SMA => Bullish Signal.
Crossovers are one of the main moving average strategies.
1st Strategy is the first type is a price crossover, which is when the price crosses above the sma => Buy signal
when the price crosses below the sma => Sell signal
2nd Strategy is to apply two moving averages to a chart: one longer and one shorter.
When the shorter-term MA (100) crosses above the longer-term MA (200), it's a buy signal, indicates trend is shifting up.
This is known as a "Golden cross."
Meanwhile, when the shorter-term MA (100) crosses below the longer-term MA (200), it's a sell signal, indicates trend is shifting down.
This is known as a "Dead/death cross."
The time frame or length you choose for a moving average, also called the "look back period," can play a big role in how effective it is.
An MA with a short time frame will react much quicker to price changes than an MA with a long look back period. In the figure below, the 20-day moving average more closely tracks the actual price than the 100-day moving average does.
A 20-day MA = more beneficial to a shorter-term trader, since it follows the price more closely.
A 100-day MA = more beneficial to a longer-term trader.
Moving averages work quite well in strong trending conditions but poorly in choppy or ranging conditions.
use this indicator along with Price action theory and not alone.
Moving average crossovers are a popular strategy for both entries and exits. MAs can also highlight areas of potential support or resistance
Happy Trading

20 and 200 SMA indicators with unnecessary additionsAs many of you know, world famous Oliver Velez uses the simple 20 and 200 simple moving averages on 2 min time frame with price actions above or below these key SMAs for day/scalp trading involving narrow state versus wide state trend or anti-trend methods. The 20 SMA line uses different colors to indicate whether it is going up or down.
Against Oliver's advice, I also unnecessarily added boll bands on the 200 SMA, two +/- percent lines off 200 SMA to measure how far away prices are from the 200 SMA. I also added 10 ema cross 20 SMA cross signal, MACD line up /down, RSI crossover RSI SMA for those are want to make things complicated or might find they helpful. You can turn off all these ideally to Keep It Simple.
Again trading success is 80% psychology and 20% a good trading system plus risk management. Good luck.

فلتر EMA 20/50/200 - صعودي فقط//@version=5
indicator("فلتر EMA 20/50/200 - صعودي فقط", overlay=true)
// مدخلات
lenFast = input.int(20, "EMA Fast")
lenSlow = input.int(50, "EMA Slow")
lenTrend = input.int(200,"EMA 200")
// حساب المتوسطات
emaFast = ta.ema(close, lenFast)
emaSlow = ta.ema(close, lenSlow)
emaTrend = ta.ema(close, lenTrend)
// ميل EMA200
slopeBars = input.int(5, "عدد الشموع لميل EMA200")
emaTrendSlope = emaTrend - emaTrend
// شروط الفلتر
trendUp = close > emaTrend and emaFast > emaSlow and emaSlow > emaTrend and emaTrendSlope > 0
bullCross = ta.crossover(emaFast, emaSlow)
// إشارة الفلتر
longFilter = trendUp and bullCross
// عرض على الشارت
plot(emaFast, color=color.orange, title="EMA20")
plot(emaSlow, color=color.blue, title="EMA50")
plot(emaTrend, color=color.green, title="EMA200")
plotshape(longFilter, title="فلتر شراء", style=shape.labelup,
text="✅ فلتر صعودي", color=color.green, location=location.belowbar, size=size.tiny)
// إخراج بوول (للإكسيل أو فرز الرموز في Screener)
filterOutput = longFilter ? 1 : 0
plotchar(filterOutput, char="●", color=longFilter ? color.green : na, title="فلتر فعّال")

FUMO MA Cross Matrix 9/21/50/100/200 FUMO MA Cross Matrix is a flexible and advanced indicator designed for traders who rely on moving average crossovers as part of their strategy.
🔹 Key Features:
Supports 5 types of Moving Averages: EMA, SMA, SMMA (RMA), WMA, HMA.
Includes 5 standard MAs: 9, 21, 50, 100, 200 (toggle on/off individually).
Choose which MA crosses to monitor (9×21, 21×50, 50×100, 100×200, and 6 extended combinations).
On-chart signals (labels) when crosses occur.
Alerts system for every selected cross and also summary alerts (“Any Cross Up/Down”).
Option to trigger signals only on confirmed bars (no repaint).
Fully adjustable label visibility and signal style.
🔹 Use Cases:
Detect trend shifts (short-term vs long-term).
Build scalping, swing, or position trading strategies.
Combine with price action or volume analysis for stronger setups.
Quickly react to Golden Cross and Death Cross events.
🔹 How to Use:
Select your preferred MA type (EMA, SMA, etc.).
Enable the MAs (9, 21, 50, 100, 200) you want to plot.
Choose which crossovers to track in the settings.
Enable/disable on-chart labels for better visualization.
Set up alerts:
“CROSS UP/DOWN X>Y” for specific pairs.
“ANY CROSS UP/DOWN” for aggregated signals.
📌 Example Alerts
MA Cross UP 9>21 on BTCUSDT 15m @ 65432
Any selected MA cross DOWN on AAPL 1D @ 195.2
Triple EMA with Alert | 21, 50, 200 EMA Strategy + Crossover🚀 Boost your trading edge with the Triple EMA with Alert — a professional-grade indicator designed for traders who want precise, real-time trend confirmation across short, medium, and long-term market movements.
🔹 What Makes This Indicator Powerful?
Three Adjustable EMAs — Default: 21, 50, 200 periods (fully customizable 1–200).
Toggle Visibility — Show only the EMAs you need for your strategy.
Real-Time Alerts — Get notified instantly when:
EMA 1 crosses EMA 2 → short-term trend change.
EMA 2 crosses EMA 3 → medium-term trend alignment.
Works on All Markets & Timeframes — Forex, crypto, stocks, indices, and commodities.
🔹 Why Traders Love It
📊 Multi-Timeframe Trend Confirmation — Filter out noise and trade with market momentum.
🎯 Accurate Crossover Signals — Identify bullish and bearish momentum shifts.
🔔 Hands-Free Monitoring — Alerts keep you informed even when you’re away from the chart.
💡 Versatile for Any Strategy — Perfect for scalping, swing trading, or long-term investing.
🔹 How to Use It
Bullish Signal — EMA 1 crossing above EMA 2 or EMA 2 crossing above EMA 3.
Bearish Signal — EMA 1 crossing below EMA 2 or EMA 2 crossing below EMA 3.
Combine with support/resistance zones, RSI, or volume for higher probability trades.
📌 Pro Tip:
Use EMA 21 & EMA 50 for momentum confirmation.
Use EMA 200 to spot the overall market direction.
If you’re serious about trend trading with precision, the Triple EMA with Alert will keep you one step ahead of market moves — no more missed entries or exits.

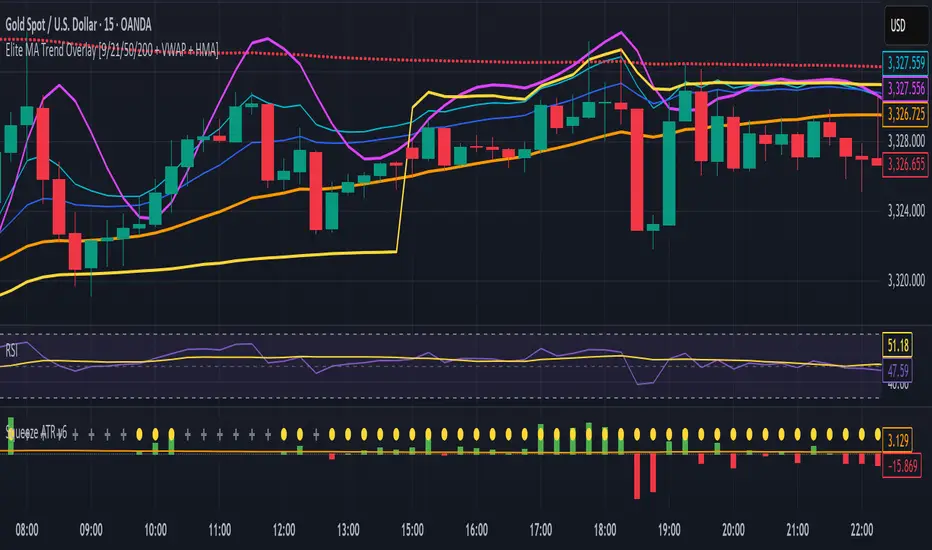
Elite MA Trend Overlay [9/21/50/200 + VWAP + HMA]🔍 What It Is:
The Elite MA Trend Overlay is a professional-grade moving average system built for day traders, scalpers, and swing traders who need clear, visual trend confirmation and precise entry zones across all timeframes.
This overlay combines 5 industry-proven tools into one compact indicator for sniper-level decision making:
EMA 9 – Entry momentum
EMA 21 – Microstructure guide
EMA 50 – Trend bias filter
EMA 200 – Institutional macro direction
VWAP – Intraday fair value (used by pros)
Hull MA (HMA) – Early shift detector
It also features auto-detected trend zones using color-coded background shading to help you instantly know if the market is in a bullish or bearish regime.
🧠 How It Works:
The script dynamically plots the short-term to long-term moving averages to reflect real-time market structure. When all EMAs are aligned in one direction, a colored background highlights the dominant trend:
✅ Green background = Bullish trend (9 > 21 > 50 > 200)
🔻 Red background = Bearish trend (9 < 21 < 50 < 200)
The VWAP line acts as a magnet and decision zone—traders use it for intraday entries or exits. The Hull Moving Average adapts quickly to price shifts, making it perfect for spotting early reversals before the EMAs cross.
🎯 Why It Helps Traders Succeed:
This indicator:
Removes guesswork: Know instantly if you’re in a strong trend or chop zone.
Filters bad trades: Avoid entering against structure or into volatility traps.
Improves timing: Use pullbacks to EMAs or Hull MA flips for sniper entries.
Works across timeframes: From scalping 1-minute to swing trading daily charts.
Whether you're trading gold, forex, stocks, or crypto — this overlay gives you clean, professional structure that keeps you disciplined and sharp.
⚙️ Features:
On/off toggles for VWAP & Hull MA
Minimalist, clutter-free plotting
Auto background color zones
Supports Pine Script v6 (latest version)
👑 Recommended Use:
Confirm trend with background + EMA alignment
Enter on pullbacks to EMA 21 or 50
Use Hull MA or RSI for early reversal detection
Exit at VWAP reversion or trend exhaustion
💬 “Structure is everything. Trade with the flow, not against it.”
EMA 200 Price Deviation Alerts (1H Only)This script monitors the price deviation from the 200-period Exponential Moving Average (EMA) exclusively on the 1-hour chart. It generates alerts when the absolute difference between the current price and the EMA 200 exceeds a user-defined threshold (default: 65).
Features:
Works only on 1-hour (60-minute) charts to avoid false signals on other timeframes.
Customizable deviation threshold via script input.
Visual display of the 200 EMA on the chart.
Alert system to notify when price deviates significantly above or below the EMA.
Buy/Sell arrows shown when conditions are met:
Sell arrow appears when price is above the EMA and deviation exceeds threshold.
Buy arrow appears when price is below the EMA and deviation exceeds threshold.
Use this tool to identify potential overextended price moves relative to long-term trend support or resistance on the 1H timeframe.
Triple EMA Bundle (50, 100, 200) - Osbrah CRG📈 Advanced EMA Indicator – 50/100/200
This custom-built indicator displays the 50, 100, and 200 Exponential Moving Averages (EMAs), giving traders a powerful visual tool to identify key trend directions, dynamic support/resistance levels, and potential market reversals.
Designed for both beginners and advanced users, this tool offers extensive customization options:
* Select which EMAs to display (50, 100, 200)
* Adjust colors, line styles, and thickness
* Choose between different price sources (close, open, hl2, etc.)
* Set custom EMA lengths to fit your strategy
Use Cases:
* Spot trend direction and strength at a glance
* Identify key zones of support and resistance
* Confirm entries/exits based on EMA crossovers or rejections
* Align your trades with higher timeframe trends
Whether you're a swing trader or a scalper, this indicator helps you stay in sync with the market by bringing clarity to long-term momentum zones.
HMA 200 + EMA 20 Crossover StrategyThis strategy combines a long-term trend filter using the Hull Moving Average (HMA 200) with a short-term entry trigger using the Exponential Moving Average (EMA 20).
📈 Entry Logic:
Buy Entry: When price is above the HMA 200 and crosses above the EMA 20.
Sell Entry: When price is below the HMA 200 and crosses below the EMA 20.
The strategy closes the current position and reverses on the opposite signal.
⚙️ Strategy Settings (Backtest Configuration):
Position size: 10% of equity per trade
Commission: 0.1% per trade (to simulate broker fees)
Slippage: 2 ticks (to reflect realistic fill conditions)
✅ Purpose:
This script is designed to identify high-probability trades in the direction of the overall trend, avoiding whipsaw conditions. It is useful for traders looking for a dynamic crossover-based system that filters trades based on longer-term momentum.
🔎 Make sure to test across multiple assets and timeframes. For best results, apply this strategy to liquid trending markets like major FX pairs, indices, or high-cap stocks.

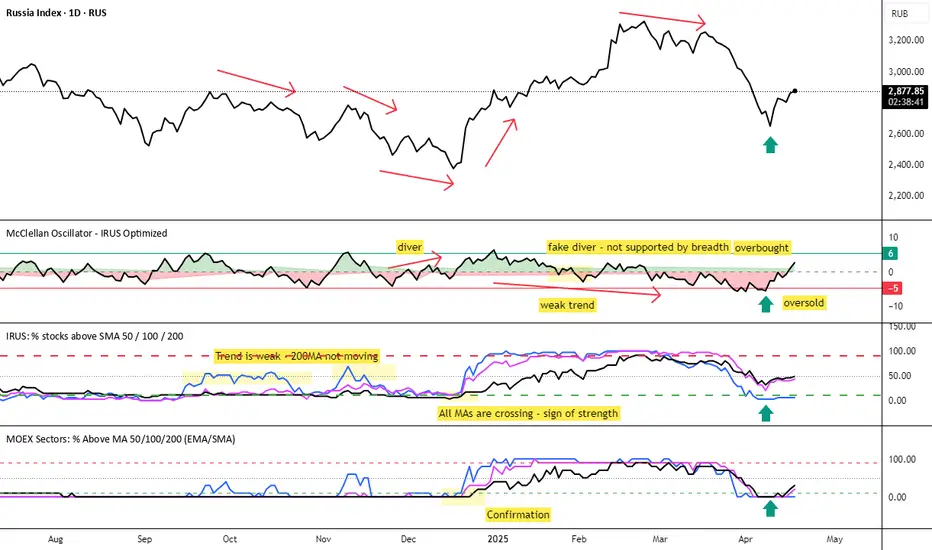
MOEX Sectors: % Above MA 50/100/200 (EMA/SMA)🧠 Name:
MOEX Sectors: % Above MA 50/100/200 (EMA/SMA)
📋 Description (for TradingView “Description” tab):
This indicator shows the percentage of Moscow Exchange sectoral indices trading above the selected moving average (SMA or EMA) with periods of 50, 100, or 200.
It uses 10 official MOEX sector indices:
MOEXOG (Oil & Gas)
MOEXCH (Chemicals)
MOEXMM (Metals & Mining)
MOEXTN (Transport)
MOEXCN (Consumer)
MOEXFN (Financials)
MOEXTL (Telecom)
MOEXEU (Utilities)
MOEXIT (IT)
MOEXRE (Real Estate)
The indicator plots up to 3 lines representing the % of sectors trading above MA 50, 100, and/or 200. The MA type is user-selectable: EMA (default) or SMA.
Horizontal reference levels (90, 50, 10) help interpret market conditions:
🔼 >90% — Overbought zone, potential market exhaustion
⚖️ ~50% — Neutral state
🔽 <10% — Oversold zone, possible rebound
📈 How to Use in Strategy:
✅ 1. Trend Filter
If >50% of sectors are above MA 200 → market in long-term uptrend
If <50% → avoid long bias, bearish regime likely
✅ 2. Bottom Detection
When <10% of sectors are above MA 200, the market is heavily oversold — often a bottoming signal
✅ 3. Trend Confirmation
If the main index is rising and % of sectors above MA is growing, the trend is supported by breadth
If the index rises while breadth declines → bearish divergence
✅ 4. Contrarian Setups
>90% of sectors above MA 50 → market may be overheated, watch for pullback
<20% above MA 50 → potential local bottom
⚙️ Tips:
Overlay this indicator on the IMOEX index chart to detect narrow leadership
Combine with other breadth metrics or RSI on the index
Use the EMA/SMA toggle to fine-tune sensitivity
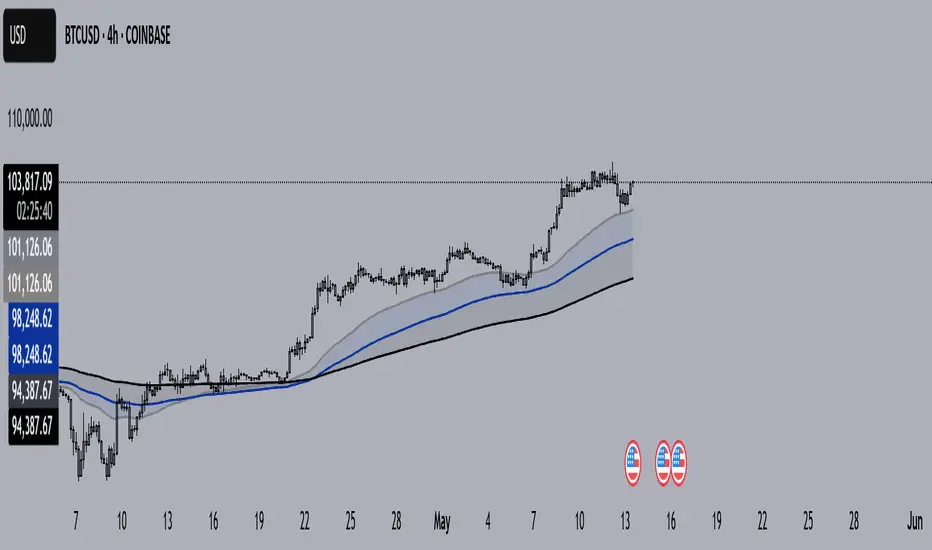
MBAND 200 4H BTC/USDT - By MGS-TradingMBAND 200 4H BTC/USDT with RSI and Volume by MGS-Trading: A Neural Network-Inspired Indicator
Introduction:
The MBAND 200 4H BTC/USDT with RSI and Volume represents a groundbreaking achievement in the integration of artificial intelligence (AI) into cryptocurrency market analysis. Developed by MGS-Trading, this indicator is the culmination of extensive research and development efforts aimed at leveraging AI's power to enhance trading strategies. By synthesizing neural network concepts with traditional technical analysis, the MBAND indicator offers a dynamic, multi-dimensional view of the market, providing traders with unparalleled insights and actionable signals.
Innovative Approach:
Our journey to create the MBAND indicator began with a simple question: How can we mimic the decision-making prowess of a neural network in a trading indicator? The answer lay in the weighted aggregation of Exponential Moving Averages (EMAs) from multiple timeframes, each serving as a unique input akin to a neuron in a neural network. These weights are not arbitrary; they were painstakingly optimized through backtesting across various market conditions to ensure they reflect the significance of each timeframe’s contribution to overall market dynamics.
Core Features:
Neural Network-Inspired Weights: The heart of the MBAND indicator lies in its AI-inspired weighting system, which treats each timeframe’s EMA as an input node in a neural network. This allows the indicator to process complex market data in a nuanced and sophisticated manner, leading to more refined and informed trading signals.
Multi-Timeframe EMA Analysis: By analyzing EMAs from 15 minutes to 3 days, the MBAND indicator captures a comprehensive snapshot of market trends, enabling traders to make informed decisions based on a broad spectrum of data.
RSI and Volume Integration: The inclusion of the Relative Strength Index (RSI) and volume data adds layers of confirmation to the signals generated by the EMA bands. This multi-indicator approach helps in identifying high-probability setups, reinforcing the neural network’s concept of leveraging multiple data points for decision-making.
Usage Guidelines:
Signal Interpretation: The MBAND bands provide a visual representation of the market’s momentum and direction. A price moving above the upper band signals strength and potential continuation of an uptrend, while a move below the lower band suggests weakness and a possible downtrend.
Overbought/Oversold Conditions: The RSI component identifies when the asset is potentially overbought (>70) or oversold (<30). Traders should watch for these conditions near the MBAND levels for potential reversal opportunities.
Volume Confirmation: An increase in volume accompanying a price move towards or beyond an MBAND level serves as confirmation of the strength behind the move. This can indicate whether a breakout is likely to sustain or if a reversal has substantial backing.
Strategic Entry and Exit Points: Combine the MBAND readings with RSI and volume indicators to pinpoint strategic entry and exit points. For example, consider entering a long position when the price is near the lower MBAND, RSI indicates oversold conditions, and there is a notable volume increase.
About MGS-Trading:
At MGS-Trading, we are passionate about harnessing the transformative power of AI to revolutionize cryptocurrency trading. Our indicators and tools are designed to provide traders with advanced analytics and insights, drawing on the latest AI techniques and methodologies. The MBAND 200 4H BTC/USDT with RSI and Volume indicator is a prime example of our commitment to innovation, offering traders a sophisticated, AI-enhanced tool for navigating the complexities of the cryptocurrency markets.
Disclaimer:
The MBAND indicator is provided for informational purposes only and does not constitute investment advice. Trading cryptocurrencies involves significant risk and can result in the loss of your investment. We recommend conducting your own research and consulting with a qualified financial advisor before making any trading decisions.

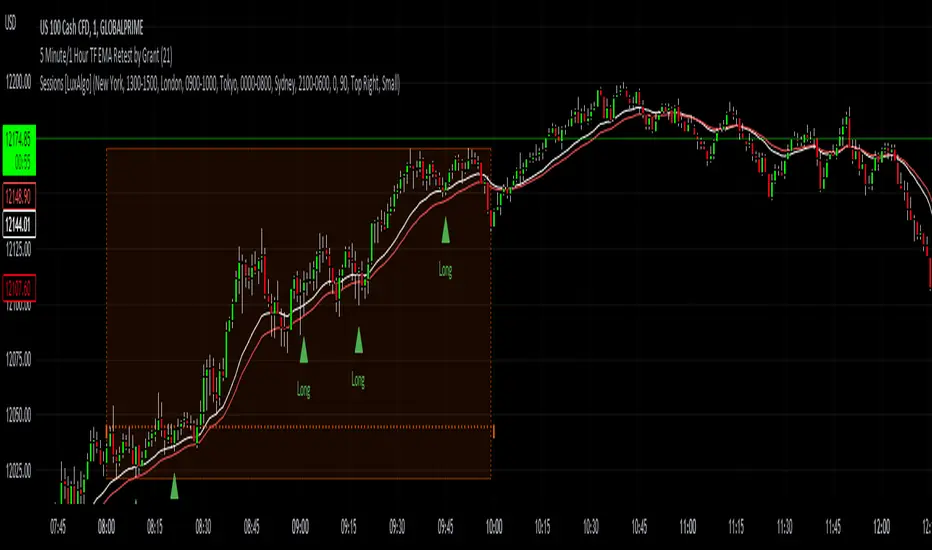
5 Minute TF 200 EMA Retest by Grantwww.tradingview.com
This indicator is a simple script meant to find retests on the 200 period moving average. It's current state is optimized for the 5 minute timeframe.
This works in all markets and all timeframes as long as you adjust certain rules for higher timeframes.
It's strengths and weaknesses
- Good at trend continuation in strong markets
- Bad in ranging markets (not surprising)
How does it work?
- It first identifies an overall trend by using the 200 ema.
- For long positions, it waits for price to close below the 200 ema, and then shortly closing back above the ema. For short positions its the opposite.
- For lower timeframes there are some other factors that help filter out bad signals that include:
- Makes sure that volume is increasing.
- Makes sure that volume is higher than average volume.
- For higher timeframes, the more specific factors aren't required.
How to use this indicator:
- Green triangles mean long positions
- Red triangles mean short positions
- Always trade with stoplosses and never risk too much of your account, please practice proper risk managment.
DISCLAIMER: Trading is inherently dangerous and carries lot's of risk. What you decide to do with my script has nothing to do with me. I am not responsible for any financial gains or losses made using this script. It is important to recognize other factors in the market to make better decisions.
% FROM 200-DAY MOVING AVERAGEOne of the stock market's paradoxes is that what seems too high goes higher and what seems too low goes lower. But there's a limit. Nothing goes up forever — even the best growth stocks.
Every experienced stock investor knows that at some point, what seems too high in price is in fact too high. So how do you objectively measure how high is too high?
One way is to calculate the distance from the 200-day moving average to the stock's current price on a daily chart. If the price is more than 70% to 100% above that level, maybe it's time to think about selling.
IBD founder and longtime former chair William O'Neil lists that as a sell signal in his book, "How to Make Money in Stocks," but admits he rarely uses it.
Use this script in your risk evaluation when starting a new position or thinking about selling a current position.
The percent from the 200-day moving average will be calculated and displayed in the top right of your chart. The flag symbols (⚑) will appear when a stock is >70% from its 200-day moving average line.
