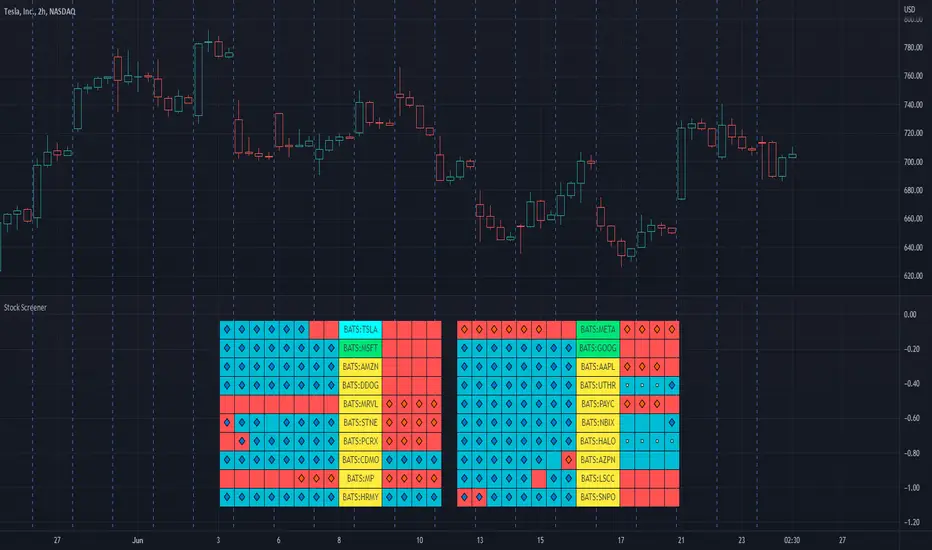
Stock ScreenerThis indicator helps monitoring QQE Mod and RMO of 20 tickers simultaneously.
This indicator shows last 4/8 indicator results of particular ticker.
Left side: 8 last colors of both indicator on current timeframe. Most left is older.
Right side: 4 last colors of both indicator on selected higher timeframe. Most right is newer.
Icon color is QQE Mod.
Background color is RMO color.
This indicator is suitable for daily or swing trade.
Recommended timeframe is 2 Hours, and recommended higher timeframe is Daily.
Cerca negli script per "文华财经tick价格"
intraday_bondsStatistics for assisting with intraday bond trading, using five minute periods and one hour ranges. There are two tables, a volatility table and a correlation table. The correlation table shows the correlation of five minute returns (absolute) between the four different bond contracts that trade on the CME. The volatility table shows for each contract:
- The current realized volatility, based on the previous one hour of realized volatility. This figure is annualized for easy comparison with options contracts.
- The current realized volatility's z-score, based on all available data.
- The tick range of an "N" standard deviation move over one hour. Choose "N" using the stdevs input.
- The previous hour's true range (high - low).
The ranges are expressed in ticks.

Intrabar OBV/PVTI got this idea from @fikira's script Intrabar-Price-Volume-Change-experimental
The indicator calculates OBV and PVT based on ticks. Since, the indicator relies on live ticks, it only starts execution after it is put on the charts. The script can be useful in analysing intraday buy and sell pressure. Details are color coded based on the values.
Data is presented in simple tabular format.
Formula for OBV and PVT can be found here:
www.investopedia.com
www.investopedia.com

Super Multi Trend [Salty]This script uses the 5, 8, 13, 21, 34 low, 34 close, 34 high, and 55 EMAs in comparison to each other to gauge momentum and trend strength for the current ticker. Additionally, it provides the ability to compare to 3 additional tickers at the same time (Uncheck boxes in settings to hide if desired). For the Super Trend Row darker colors are more bearish than lighter colors, and consequently lighter colors are more bullish than darker colors. Yellow indicates a neutral or choppy market. Fully stacked EMAs are shown with a Light Green (Lime) color for the bullish condition, and Dark Red for the bearish condition.

SQV CrossThis strategy is used to find tickers that do well when SPY and QQQ are up and VIX is down. This uses EMA's on the user defined resolution to define direction of each ticker. Trades are entered upon crossover. EMAs are user defined as well.

Volume Prism RibbonNASDAQ:SPWR
The purpose of this script is to give insight into the volume action. The relative volume is calculated (based on 400 ticks) with the volume of down days (close-close <0) being given a negative value. This function is then summed over 100 ticks. WMA's are used to generate a rainbow ribbon who's color order is easily recognized buy all of us. Watch and Warning points are added using crossover points. I find it to be a good supplement to my favorite Buy/Sell indicator. In addition to the wrapping of the ribbon, pay attention to where the zero line is as well.

Technical Analysis Consulting Table (TACT)Inspired by Tradingview's own "Technical Analysis Summary", I present to you a table with analogous logic.
You can track any ticker you want, no matter your chart. You can even have multiple tables to track multiple tickers. By default it tracks the Total Crypto Cap.
You can change the resolution you want to track. By default it is the same as the chart.
You can position the table to whichever corner of the chart you want. By default it draws in the bottom right corner.
Background colors and text size can be adjusted.
Indicators Used:
Oscillators
RSI(14)
STOCH(14, 3, 3)
CCI(20)
ADX(14)
AO
Momentum(10)
MACD(12, 26)
STOCH RSI(3, 3, 14, 14)
%R(14)
Bull Bear Power
UO(7,14,28)
Moving Averages
EMA(5)
SMA(5)
EMA(10)
SMA(10)
EMA(20)
SMA(20)
EMA(30)
SMA(30)
EMA(50)
SMA(50)
EMA(100)
SMA(100)
EMA(200)
SMA(200)
Ichimoku Cloud(9, 26, 52, 26)
VMWA(20)
HMA(9)
Pivots
Traditional
Fibonacci
Camarilla
Woodie
WARNING: I have observed up to a couple of seconds of signal jitter/delay, so use it with caution in very small resolutions (1s to 1m).
I hope you enjoy this and good luck with your trading. Suggestions and feedback are most welcome.

Relative Strength RatioAbout this indicator:
This indicator goes under many different names such as Relative Strength Ratio, Comparative Strength, Relative Strength Comparison (RSC) etc.
It compares the strength of the current asset to another asset of your choice and displays the relative strength of the current asset. (Not RSI)
There are several comparative indicators published already here on TV but I have added some unique features that I think is really useful.
When to use it:
This is useful when you want to compare for example a stock with its sector to find out if the stock is a leadership stock in that sector or main index.
You could also use it to compare the sector to its index etc.
If you want to compare for example a stock to both its index and its sector at the same time I suggest you add 2 instances of this indicator.
In many trading systems you are supposed find the strongest tickers by identifying "layers of strength" like 1. The strongest asset class that money is flowing into (like stocks, commodities, bonds, etc.) 2. Find the strongest sectors. 3. Find the stocks outperforming those sectors. 4. Find some kind of entry signal there.
How it works:
The indicator calculates an "RS line" (Relative Strength) by dividing the current ticker with a ticker of your choice. This creates a ratio or pair similar to how currencies are related to each others like USDGBP (dollar against pound). The RS line is black by default so you might want to change its color if you use a dark theme.
If the RS line is moving up it means your current asset is stronger than the asset you are comparing it with and vice versa.
Use the simple moving average to quickly see long term strength trends.
Features
RS line
Shows the relative strength of the current asset.
SMA
This Simple Moving Average has directional coloring; green when it is angled up and red when it is angled down. You can customise the period in the settings. If you don't want the color change just make both up/down color the same.
Relative market label
This displays the market you are currently comparing with as a label next to the last data point.
Because I tried stocks in 2 different countries I want to know which index I am comparing with and this label saves me from going into the settings to check. I find it to be a life saver!
Please let me know if you find any problems or if you have any ideas for improvement
Difference over barsDescription:
One of my followers asked about an indicator that shows the difference between the open and a previous close and didn't find one so I wrote this one. This is similar to a momentum indicator except it offers more flexibility. While the standard momentum indicator calculates a difference between current close and a previous close (sometimes customizable to work on open, high or lows instead of close), this allows to mix and match between open, high, low and close. It also offers multiple kinds of moving averages.
Settings:
Current point of reference
Previous point of reference
Difference over how many bars?
How it works:
The indicator calculates the difference between the current point of reference and a previous (n-bars back) point of reference (where n is given by the "Difference over how many bars?").
How to use it:
find historical support lines like the 0.68 line in the cart above where in the past the indicator tends to bounce back; similarly find resistance lines like the -0.75 line in the chart (which servers as a resistance line both for the main indicator line and its moving average )
look for convergence between the price and the indicator; for example, if the price is going up and the indicator is going down a change in the price direction may be coming soon
look for the indicator crossing its moving average: moving up will signify an up trend and vice-versa
since the difference between the open and previous close (which is what the blue line in the chart shows) since to go up to 0.68 (the upper horizontal line) and down to -0.75 (the lower horizontal line) most of the time, one strategy, using options, is to to buy, right before the close of a trading day, a "long iron butterfly": buy-to-open (BTO) both a call and a put at the strike price and sell-to-open (STO) a call at a strike of around $0.68 more and sell to open a put at a strike of around $0.75 less. The STO legs should be for the next expiration and the BTO legs for the next expiration after that. This way the STO will decrease their time value faster than the BTO legs if the price stays flat (which plays to your advantage) and the BTO legs may make profit if the next day it opens away from the price at which the ticker closed the previous day (when the position was opened). The most profit is when it moves right up to one of the STO legs. This position would normally be closed next day at opening. The percentage of profit it makes is low compared to other strategies but also the percentage of the total cost at risk is also low which could potentially allow a trader to increase the lot and thus, in the end, the total profit amount may be comparable to other strategies.
Notes:
The indicator in the chart above comes with the standard options. For a more standard momentum indicator set both the current and previous reference point to the same OHLC value (such as "close").
The 0.68 and -0.75 levels are for open/close (current/previous point of reference) for ticker INTC. Obviously, other tickers will likely have other levels and you will have to find those yourself. If you use INTC but use other combination of current and previous reference points, they will have different levels as well.

Bitcoin CME Gaps [NeoButane]Simple script that checks for gaps in price from CME. tickerid(x, y, sess) doesn't seem to be applying correctly for the ticker specified at the moment so there are a couple of 'gaps' peppered on lower timeframes.
Gaps are legitimate price levels to look as a support or resistance. The theory is that volume needs to be gap filled, but I currently believe it's an easy entry/exit trade for those who can move the market. I don't think there is sound analysis behind the why, but it is real.

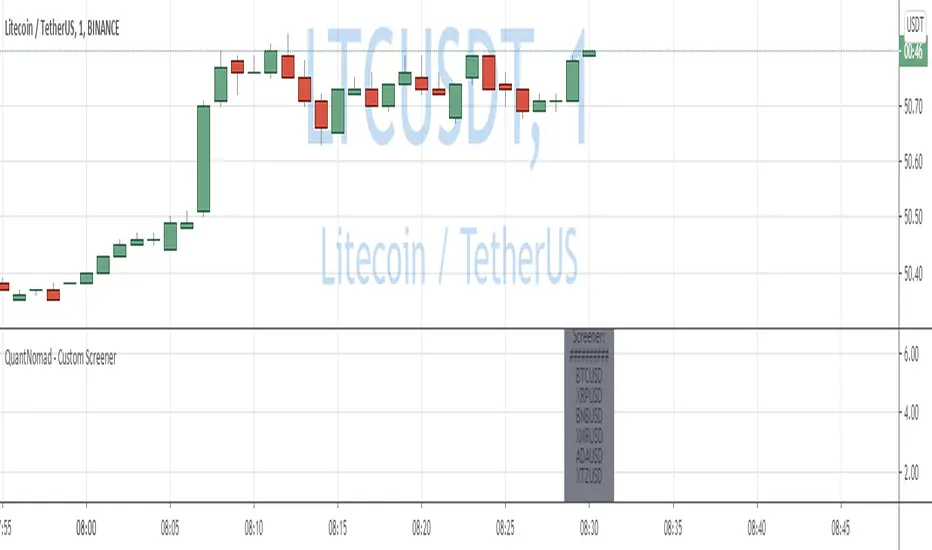
QuantNomad - Simple Custom Screener in PineScriptQuite often I need to run screeners with the custom condition, but unfortunately, in TradingView it's impossible.
I created an example script to show how you can create a simple custom screener in Pine Script on your own.
It's not very good, it requires some manual adjustments, it can be improved in some ways, but I think it might work for some tasks.
What do you think? Do you have a better way to implement custom screeners in TradingView?
To run your own conditions you need to implement them in:
customFunc() function and for every ticker you want to include in your search add 2 lines like these with newly defined variable:
s1 = security('BTCUSD', '1', customFunc())
and
scr_label := s1 ? scr_label + 'BTCUSD\n' : scr_label
I'm not sure that it will work well for more than a few dozen tickers.
But I hope it will be helpful for you.
And remember:
Past performance does not guarantee future results.
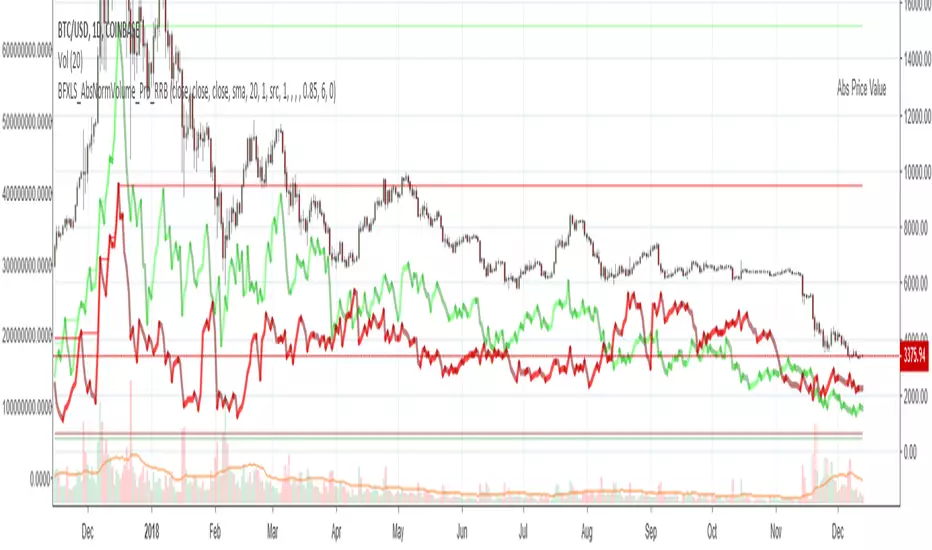
Chiki-Poki BFXLS Longs Shorts Abs Normalized Volume Pro by RRBChiki-Poki BFXLS Longs vs Shorts Absolute Normalized Volume Value Pro by RagingRocketBull 2018
Version 1.0
This indicator displays Longs vs Shorts in a side by side graph, shows volume's absolute price value and normalized volume of Longs/Shorts for the current asset. This allows for more accurate L/S comparisons (like a log scale for volume) since volume on spot exchanges (Bitstamp, Bitfinex, Coinbase etc) is measured in coins traded, not USD traded. Similarly, L/S is usually the amount of coins in open L/S positions, not their total USD value. On Bitmex and other futures exchanges volume is measured in USD traded, so you don't need to apply the Volume Absolute Price Value checkbox to compare L/S. You should always check first whether your source is measured in coins or USD.
Chiki-Poki BFXLS primarily uses *SHORTS/LONGS feeds from Bitfinex for the current crypto asset, but you can specify custom L/S source tickers instead.
This 2-in-1 works both in the Main Chart and in the indicator pane below. You can switch between Main/Sub Window panes using RMB on the indicator's name and selecting Move To/Pane Above/Below.
This indicator doesn't use volume of the current asset. It uses L/S ticker's OHLC as a source for SHORTS/LONGS volumes instead. Essentially L/S => L/S Volume == L/S
Features:
- Display Longs vs Shorts side by side graph for the current crypto asset, i.e. for BTCUSD - BTCUSDLONGS/BTCUSDSHORTS, for ETHUSD - ETHUSDLONGS/ETHUSDSHORTS etc.
- Use custom OHLC ticker sources for Longs/Shorts from different exchanges/crypto assets with/without exchange prefix.
- Plot Longs/Shorts as lines or candles
- Show/Hide L/S, Diff, MAs, ATH/ATL
- Use Longs/Shorts Volume Absolute Price Value (Price * L/S Volume) instead of Coins Traded in open L/S positions to compare total L/S value/capitalization
- Normalize L/S Volume using Price / Price MA / L/S Volume MA
- Supports any existing type of MA: SMA, EMA, WMA, HMA etc
- Volume Absolute Price Value / Normalize also works on candles
- Oscillator mode with negative axis (works in both Main Chart/Subwindow panes).
- Highlight L/S Volume spikes above L/S MAs in both lines/oscillator.
- Change L/S MA color based on a number of last rising/falling L/S bars, colorize candles
- Display L/S volume as 1000s, mlns, or blns using alpha multiplier
1. based on BFXLS Longs vs Shorts and Compare Style, uses plot*, security and custom hma functions
2. swma has a fixed length = 4, alma and linreg have additional offset and smoothing params
Notes:
- Make sure that Left Price Scale shows up with Auto Fit Data enabled. You can reattach indicator to a different scale in Style.
- It is not recommended to switch modes multiple times due to TradingView's scale reattachment bugs. You should switch between Main Chart and Sub Window only once.
- When the USD price of an asset is lower you can trade more coins but capitalization value won't be as significant as when there are less coins for a higher price. Same goes for Shorts/Longs.
Current ATH in shorts doesn't trigger a squeeze because its total value is now far less than before and we are in a bear market where it's normal to have a higher number of shorts.
- You should always subtract Hedged L/S from L/S because hedged positions are temporary - used to preserve the value of the main position in the opposite direction and should be disregarded as such.
- Low margin rates increase the probability of a move in an underlying direction because it is cheaper. High margin rates => the market is anticipating a move in this direction, thus a more expensive rate. Sudden 5-10x rate raises imply a possible reversal soon. high - 0.1%, avg - 0.01-0.02%, low - 0.001-0.005%
You can also check out:
- BFXLS Longs/Shorts on BFXData
- Bitfinex L/S margin rates and Hedged L/S on datamish
- Bitmex L/S on Coinfarm.online
ec tEST cODE FOR pERCENT DIFERENCE ////////////////////////////////////////////////////////////
// Copyright by HPotter v1.0 04/04/2015
// Percent difference between price and MA
////////////////////////////////////////////////////////////
study(title="Percent difference between price and MA")
source = close
useCurrentRes = input(true, title="Use Current Chart Resolution?")
resCustom = input(title="Use Different Timeframe? Uncheck Box Above", type=resolution, defval="60")
smd = input(true, title="Show MacD & Signal Line? Also Turn Off Dots Below")
sd = input(true, title="Show Dots When MacD Crosses Signal Line?")
sh = input(true, title="Show Histogram?")
macd_colorChange = input(true,title="Change MacD Line Color-Signal Line Cross?")
hist_colorChange = input(true,title="MacD Histogram 4 Colors?")
res = useCurrentRes ? period : resCustom
fastLength = input(12, minval=1), slowLength=input(26,minval=1)
signalLength=input(9,minval=1)
fastMA = ema(source, fastLength)
slowMA = ema(source, slowLength)
Length = input(9, minval=1)
Length2= input(36,minval=1)
Length3= input(81,minval=1)
AveragePrice= input(9,minval=1)
Length5= input(3,minval=1)
xSMA = (sma(close, Length)+sma(close, Length2)+sma(close, Length3))/3
pSAM=sma(close, AveragePrice)
nRes = (pSAM - xSMA) * 100 / close
signalnRes = sma(nRes, signalLength)
macd = nRes
signal = sma(macd, signalLength)
hist = macd - signal
outMacD = security(tickerid, res, macd)
outSignal = security(tickerid, res, signal)
outHist = security(tickerid, res, hist)
histA_IsUp = outHist > outHist and outHist > 0
histA_IsDown = outHist < outHist and outHist > 0
histB_IsDown = outHist < outHist and outHist <= 0
histB_IsUp = outHist > outHist and outHist <= 0
//MacD Color Definitions
macd_IsAbove = outMacD >= outSignal
macd_IsBelow = outMacD < outSignal
plot_color = hist_colorChange ? histA_IsUp ? aqua : histA_IsDown ? blue : histB_IsDown ? red : histB_IsUp ? maroon :yellow :gray
macd_color = macd_colorChange ? macd_IsAbove ? lime : red : red
signal_color = macd_colorChange ? macd_IsAbove ? yellow : yellow : lime
circleYPosition = outSignal
// MA COLOR DEFINITION
maColor = change(nRes)>0 ? green : change(nRes)<0 ? red : na
mA_IsAbove = nRes> 0
mA_IsBelow = nRes< 0
plot( nRes, color=maColor, style=line, title="MMA", linewidth=2)
//plot(smd and signalnRes ? signalnRes : na, title="Signal Line", color=signal_color, style=line ,linewidth=2)
//plot(smd and outMacD ? outMacD : na, title="MACD", color=macd_color, linewidth=4)
//plot(smd and outSignal ? outSignal : na, title="Signal Line", color=signal_color, style=line ,linewidth=2)
//plot(sh and outHist ? outHist : na, title="Histogram", color=plot_color, style=histogram, linewidth=4)
plot(sd and cross(outMacD, outSignal) ? circleYPosition : na, title="Cross", style=circles, linewidth=4, color=macd_color)
hline(0, '0 Line', linestyle=solid, linewidth=2, color=white)
//////ALERT cONDITION////
src = input(close)
ma_1 = sma(src, 20)
ma_2 = sma(src, 10)
c = cross(ma_1, ma_2)
alertcondition(c, title='Red crosses blue', message='Red and blue have crossed!')
d = cross(outMacD, outSignal)
alertcondition(d, title='GOING DOWN', message='SELL!')
//
//e = cross(outSignal, outMacD)
//alertcondition(E, title='GOING UP', message='BUY!')

BTC World Price: Multi-Exchange VWAPBTC World Price: Multi-Exchange VWAP
__________________________
WHAT IT DOES
What you see above are not Bitmex candles, but this indicator's.
Bitcoin is listed on multiple exchanges. Many people have called for a single global index that would quote BTC price and volume across all exchanges: this script is such a virtual aggregate (formerly: Multi-Listed , Volume-Weighted Average Price ).
It will, independently for each tick, for any time-frame:
- Quote the price (O, H, L, C) and volume from Bitfinex (USD), Binance (USDT), bitFlyer (Yen), Bithumb (S. Korean Won), Coinbase (USD), Kraken (EUR) and even Bitmex (USD Contracts).
- Weight each price with the corresponding volume of the exchange.
- Quote the FOREX conversion rate in USD for each currency (USDJPY etc.)
- Finally return global average price (candles) in USD.
- Additionally provide (H+L)/2 etc. values.
No more "on Coinbase this" or "on Bitstamp that", you've now got a global overview!
See CoinMarketCap: Markets for reference. I've included alternative exchanges in the comments at the top of the script.
__________________________
HOW TO USE IT
Basically just add it to your chart and use the indicator's candles instead of the chart's main ticker.
By default, BTC World Price will display candles only, but you can also display OHLC & averages (in whichever style you want).
You may indeed want to hide the main symbol (top-left corner, click the 'eye' button next to its name), or switch it to something else than candles/bars (e.g. line).
Make sure "Scale Price Chart Only" is disabled if you want to use the auto-zoom feature. (if other indicators are messing your zoom, you can try to select "Line with Breaks" or "Area with Breaks" to allow these to overflow from the main window)
By clicking the triangle next to the indicator's name, you can select "Visual Order" (e.g "Bring to Front").
You can select regular Candles or Heikin-Ashi in Options.
In the Format > Inputs tab, you can select which exchanges to quote. By default, all of them are enabled.
The script also exposes the following typical values to the backend, which you can use as Price Source for other indicators: (e.g. MA, RSI, in their "Format > Input" tab)
Open Price (grey)
High Price (green)
Low Price (red)
Close Price (white)
(H + L)/2 (light blue)
(H + L + C)/3 (blue)
(O + H + L + C)/4 (purple)
They are all hidden by default (by means of maximum transparency).
In the Format > Style tab, you can change their color, transparency and style (line, area, etc), as well as uncheck Candles and Wicks to hide these.
If you are using "Indicator Last Value" and want to clear the clutter from all these values, simply uncheck them in Style. They will still be available as Price Source for other indicators.
You can also choose to scale it to the left, right (default) or "screen" (no scaling).
Once you're satisfied with your Style, you may click "Default"> "Save as default" in the botton-left. Everytime you load the indicator, it will look the same. ("Reset Settings" will reset to the script's defaults)
__________________________
Please leave feedback below in comments or pm me directly for bugs and suggestions.

SMART4TRADER-Margin ZONEIndicator based on marginal zones (according to Mityukov Sergey). In open source.
Formula for calculating the margin:
Margin size / cost tick * minimum price change
Example:
EURUSD = 2100 $ / 6.25 $ * 0.00005 points = 0.01680 points
....
For currency pairs where USD is in the first place it is necessary to write so that the indicator is taken away from zero
Iff (ticker == "USDCAD", (0- (950/5 * 0.00005)),
//////////////////////////////////////////////////////////////////////////////////////////////////
Индикатор на основе маржинальных зон (по Митюкову Сергею). В открытом исходном коде.
Формула рассчета маржи:
размер маржи / стоимость тика * минимальное ценовое изменение
Пример:
EURUSD = 2100 $ / 6.25 $ * 0.00005 points = 0.01680 points
....
Для валютных пар где USD стоит на первом месте нужно писать так, чтобы показатель отнимался от нуля
iff (ticker=="USDCAD", (0-(950/5*0.00005)),
//////////////////////////////////////////////////////////////////////////////////////////////////

Convert Yuan value symbols to USDIGNORE PREVIOUS SCRIPT/POST (titled: "yuan normiz")
If you like to look add symbols that are valued in China's Yuan and want to convert them to USD accurately then this is the perfect script for you.
"I'm not sure if this script is for me. Does my setup apply here?"
If either of these resemble your chart setup then this is for you:
Example 1: You have COINBASE:BTCUSD on your main chart often add to compare Bitstamp:btcusd and Okcoin:btccny.
Example 2: You have SPY or SPX (or DJIA etc) as your main chart but like to add other composites to compare like SSE(Shanghai Stock Exchange index) to your main chart.
This takes the symbol of your choice (default is BTCCHINA:BTCCNY) that is expressed in Yuan and divides it by the corresponding value of IDC's USDCNH ticker. Not the last value of USDCNH, but the respective tick mark----BTCCNY's close 3 months ago is divided by USDCNH's close 3 months ago.

VWAP + Volume Spikes See Where Smart Money ExhaustsVolume tells the truth. VWAP tells the bias. This script shows both — live.
If you trade intraday momentum, reversals, or liquidity sweeps, this indicator is built for you.
It shows where volume spikes hit extreme levels, anchored around VWAP and its dynamic bands, so you can instantly spot capitulation or hidden absorption.
🎯 What This Indicator Does
✅ Plots VWAP — session-anchored, updates automatically
✅ Adds dynamic VWAP bands — standard deviation envelopes showing volatility context
✅ Highlights volume spikes — colored candles + background for abnormal prints
✅ Includes alerts — “Volume Spike”, “VWAP Cross”, or a combined alert with direction
✅ Clean visual design — instantly readable in fast markets
It’s your visual orderflow radar — whether you’re trading gold, indices, or small caps.
🔍 Why It Works
Institutions build and unwind positions around VWAP.
Retail often chases volume… this script shows you when that volume becomes too extreme.
A spike above VWAP near resistance? → Likely distribution.
A spike below VWAP near support? → Likely capitulation.
Combine volume exhaustion + VWAP context, and you’ll see market turning points form before most indicators react.
⚙️ Inputs You Can Tune
Bands lookback: adjusts how reactive the VWAP bands are
Band width (σ): set how tight or wide your deviation envelope is
Volume baseline length: controls how “abnormal” a spike must be
Spike threshold: multiplier vs. average volume
Toggle color-coding, bands, and labels
Default settings work well across 1m–15m intraday charts and 1h–4h swing frames.
💡 How Traders Use It
1️⃣ Fade Parabolics:
When a green spike candle pierces upper VWAP band on high volume → smart money unloading.
Look for rejection and short into VWAP.
2️⃣ Catch Capitulations:
When a red spike candle dumps below lower VWAP band → panic selling.
Watch for stabilization and long back to VWAP.
3️⃣ VWAP Rotation Plays:
Alerts for price crossing VWAP help you spot shift in intraday control.
Above VWAP = buyers in charge.
Below VWAP = sellers in charge.
🧠 Best Practices
Pair it with Volume Profile or Delta/Flow tools to confirm exhaustion.
Don’t chase — wait for spike confirmation + reversal candle.
Use it on liquid tickers (NASDAQ, SPY, GOLD, BTC, etc.).
Great for Dux-style small-cap shorts or index pullbacks.
🔔 Alerts Ready
Choose from:
Volume Spike (single-bar explosion)
VWAP Cross Up/Down (trend shift confirmation)
One Combined Alert (any signal, includes ticker, price, and volume)
Set once — get real-time push notifications, Telegram, or webhook signals.
📊 My Favorite Setups
US100 / NASDAQ: fade rallies above VWAP + spike
Gold / Silver: trade reversals from VWAP bands
Small caps: short back-side after volume climax
ES, DAX, Oil: scalp VWAP rotation with confluence
❤️ Support This Work
I release free and premium scripts weekly — combining smart money concepts, VWAP tools, and volume analytics.
👉 Follow me on TradingView for more indicators and setups.
👉 Comment “🔥” if you want me to post the multi-timeframe VWAP + Volume Pressure version next.
👉 Share this with your team — it helps the community grow.

BB SPY Mean Reversion Investment StrategySummary
Mean reversion first, continuation second. This strategy targets equities and ETFs on daily timeframes. It waits for price to revert from a Bollinger location with candle and EMA agreement, then manages risk with ATR based exits. Uniqueness comes from two elements working together. One, an adaptive band multiplier driven by volatility of volatility that expands or contracts the envelope as conditions change. Two, a bias memory that re arms the same direction after any stop, target, or time exit until a true opposite signal appears. Add it to a clean chart, use the markers and levels, and select on bar close for conservative alerts. Shapes can move while the bar is open and settle on close.
Scope and intent
• Markets. Currently adapted for SPY, needs to be optimized for other assets
• Timeframes. Daily primary. Other frames are possible but not the default
• Default demo. SPY on daily
• Purpose. Trade mean reversion entries that can chain into a longer swing by splitting holds into ATR or time segments
Originality and usefulness
• Novelty. Adaptive band width from volatility of volatility plus a persistent bias array that keeps the original direction alive across sequential entries until an opposite setup is confirmed
• Failure modes mitigated. False starts in chop are reduced by candle color and EMA location. Missed continuation after a take profit or stop is addressed by the re arm engine. Oversized envelopes during quiet regimes are avoided by the adaptive multiplier
• Testability. Every module has Inputs and visible levels so users can see why a suggestion appears
• Portable yardstick. All risk and targets are expressed in ATR units
Method overview in plain language
The engine measures where price sits relative to Bollinger bands, confirms with candle color and EMA location, requires ADX for shorts(in our case long close since we use it currently as long only), and optionally requires a trend or mean reversion regime using band width percent rank and basis slope. Risk uses ATR for stop, target, and optional breakeven. A small array stores the last confirmed direction. While flat, the engine keeps a pending order in that direction. The array flips only when a true opposite setup appears.
Base measures
• Range basis. True Range smoothed over a user defined ATR Length
• Return basis. Not required
Components
• Bollinger envelope. SMA length and standard deviation multiplier. Entry is based on cross of close through the band with location bias
• Candle and EMA filter. Close relative to open and close relative to EMA align direction
• ADX gate for shorts. Requires minimum trend strength for short trades
• Adaptive multiplier. Band width scales using volatility of volatility so envelopes breathe with conditions
• Regime gate optional. Band width percent rank and basis slope identify trend or mean reversion regimes
• Risk manager. ATR stop, ATR target, optional breakeven, optional time exit
• Bias memory. Array stores last confirmed direction and re arms entries while flat
Fusion rule
Minimum satisfied gates count style. All required gates must be true. Optional gates are controlled in Inputs. Bias memory never overrides an opposite confirmed setup.
Signal rule
• Long setup when close crosses up through the lower band, the bar closes green, and close is above the long EMA
• Short setup when close crosses down through the upper band, the bar closes red, close is below the short EMA, and ADX is above the minimum
• While flat the model keeps a pending order in the stored direction until a true opposite setup appears
• IN LONG or IN SHORT describes states between entry and exit
What you will see on the chart
• Markers for Long and Short setups
• Exit markers from ATR or time rules
• Reference levels for entry, stop, and target
• Bollinger bands and optional adaptive bands
Inputs with guidance
Setup
• Signal timeframe. Uses the chart timeframe
• Invert direction optional. Flips long and short
Logic
• BB Length. Typical 10 to 50. Higher smooths more
• BB Mult. Typical 1.0 to 2.5. Higher widens entries
• EMA Length long. Typical 10 to 50
• EMA Length short. Typical 5 to 30
• ADX Minimum for short. Typical 15 to 35
Filters
• Regime Type. none or trend or mean reversion
• Rank Lookback. Typical 100 to 300
• Basis Slope Length and Threshold. Larger values reduce false trends
Risk
• ATR Length. Typical 10 to 21
• ATR Stop Mult. Typical 1.0 to 3.0
• ATR Take Profit Mult. Typical 2.0 to 5.0
• Breakeven Trigger R. Move stop to entry after the chosen multiple
• Time Exit. Minimum bars and extension when profit exceeds a fraction of ATR
Bias and rearm
• Bias flips kept. Array depth
• Keep rearm when flat. Maintain a pending order while flat
UI
• Show markers and levels. Clean defaults
Usage recipes
Alerts update in real time and can change while the bar forms. Select on bar close for conservative workflows.
Properties visible in this publication
• Initial capital 25000
• Base currency USD
• If any higher timeframe calls are enabled, request.security uses lookahead off
• Commission 0.03 percent
• Slippage 3 ticks
• Default order size method Percent of equity with value 5
• Pyramiding 0
• Process orders on close On
• Bar magnifier Off
• Recalculate after order is filled Off
• Calc on every tick Off
Realism and responsible publication
No performance claims. Costs and fills vary by venue. Shapes can move intrabar and settle on close. Strategies use standard candles only.
Honest limitations and failure modes
High impact releases and thin liquidity can break assumptions. Gap heavy symbols may require larger ATR. Very quiet regimes can reduce contrast in the mean reversion signal. If stop and target can both be touched inside one bar, outcome follows the TradingView order model for that bar path.
Regimes with extreme one sided trend and very low volatility can reduce mean reversion edges. Results vary by symbol and venue. Past results never guarantee future outcomes.
Open source reuse and credits
None.
Backtest realism
Costs are realistic for liquid equities. Sizing does not exceed five percent per trade by default. Any departure should be justified by the user.
If you got any questions please le me know

cd_correlation_analys_Cxcd_correlation_analys_Cx
General:
This indicator is designed for correlation analysis by classifying stocks (487 in total) and indices (14 in total) traded on Borsa İstanbul (BIST) on a sectoral basis.
Tradingview's sector classifications (20) have been strictly adhered to for sector grouping.
Depending on user preference, the analysis can be performed within sectors, between sectors, or manually (single asset).
Let me express my gratitude to the code author, @fikira, beforehand; you will find the reason for my thanks in the context.
Details:
First, let's briefly mention how this indicator could have been prepared using the classic method before going into details.
Classically, assets could be divided into groups of forty (40), and the analysis could be performed using the built-in function:
ta.correlation(source1, source2, length) → series float.
I chose sectoral classification because I believe there would be a higher probability of assets moving together, rather than using fixed-number classes.
In this case, 21 arrays were formed with the following number of elements:
(3, 11, 21, 60, 29, 20, 12, 3, 31, 5, 10, 11, 6, 48, 73, 62, 16, 19, 13, 34 and indices (14)).
However, you might have noticed that some arrays have more than 40 elements. This is exactly where @Fikira's indicator came to the rescue. When I examined their excellent indicator, I saw that it could process 120 assets in a single operation. (I believe this was the first limit overrun; thanks again.)
It was amazing to see that data for 3 pairs could be called in a single request using a special method.
You can find the details here:
When I adapted it for BIST, I found it sufficient to call data for 2 pairs instead of 3 in a single go. Since asset prices are regular and have 2 decimal places, I used a fixed multiplier of $10^8$ and a fixed decimal count of 2 in Fikira's formulas.
With this method, the (high, low, open, close) values became accessible for each asset.
The summary up to this point is that instead of the ready-made formula + groups of 40, I used variable-sized groups and the method I will detail now.
Correlation/harmony/co-movement between assets provides advantages to market participants. Coherent assets are expected to rise or fall simultaneously.
Therefore, to convert co-movement into a mathematical value, I defined the possible movements of the current candle relative to the previous candle bar over a certain period (user-defined). These are:
Up := high > high and low > low
Down := high < high and low < low
Inside := high <= high and low >= low
Outside := high >= high and low <= low and NOT Inside.
Ignore := high = low = open = close
If both assets performed the same movement, 1 was added to the tracking counter.
If (Up-Up), (Down-Down), (Inside-Inside), or (Outside-Outside), then counter := counter + 1.
If the period length is 100 and the counter is 75, it means there is 75% co-movement.
Corr = counter / period ($75/100$)
Average = ta.sma(Corr, 100) is obtained.
The highest coefficients recorded in the array are presented to the user in a table.
From the user menu options, the user can choose to compare:
• With assets in its own sector
• With assets in the selected sector
• By activating the confirmation box and manually entering a single asset for comparison.
Table display options can be adjusted from the Settings tab.
In the attached examples:
Results for AKBNK stock from the Finance sector compared with GARAN stock from the same sector:
Timeframe: Daily, Period: 50 => Harmony 76% (They performed the same movement in 38 out of 50 bars)
Comment: Opposite movements at swing high and low levels may indicate a change in the direction of the price flow (SMT).
Looking at ASELS from the Electronic Technology sector over the last 30 daily candles, they performed the same movements by 40% with XU100, 73.3% (22/30) with XUTEK (Technology Index), and 86.9% according to the averages.
Comment: It is more appropriate to follow ASELS stock with XUTEK (Technology index) instead of the general index (XU100). Opposite movements at swing high and low levels may indicate a change in the direction of the price flow (SMT).
Again, when ASELS stock is taken on H1 instead of daily, and the length is 100 instead of 30, the harmony rate is seen to be 87%.
Please share your thoughts and criticisms regarding the indicator, which I prepared with a bit of an educational purpose specifically for BIST.
Happy trading.

TriAnchor Elastic Reversion US Market SPY and QQQ adaptedSummary in one paragraph
Mean-reversion strategy for liquid ETFs, index futures, large-cap equities, and major crypto on intraday to daily timeframes. It waits for three anchored VWAP stretches to become statistically extreme, aligns with bar-shape and breadth, and fades the move. Originality comes from fusing daily, weekly, and monthly AVWAP distances into a single ATR-normalized energy percentile, then gating with a robust Z-score and a session-safe gap filter.
Scope and intent
• Markets: SPY QQQ IWM NDX large caps liquid futures liquid crypto
• Timeframes: 5 min to 1 day
• Default demo: SPY on 60 min
• Purpose: fade stretched moves only when multi-anchor context and breadth agree
• Limits: strategy uses standard candles for signals and orders only
Originality and usefulness
• Unique fusion: tri-anchor AVWAP energy percentile plus robust Z of close plus shape-in-range gate plus breadth Z of SPY QQQ IWM
• Failure mode addressed: chasing extended moves and fading during index-wide thrusts
• Testability: each component is an input and visible in orders list via L and S tags
• Portable yardstick: distances are ATR-normalized so thresholds transfer across symbols
• Open source: method and implementation are disclosed for community review
Method overview in plain language
Base measures
• Range basis: ATR(length = atr_len) as the normalization unit
• Return basis: not used directly; we use rank statistics for stability
Components
• Tri-Anchor Energy: squared distances of price from daily, weekly, monthly AVWAPs, each divided by ATR, then summed and ranked to a percentile over base_len
• Robust Z of Close: median and MAD based Z to avoid outliers
• Shape Gate: position of close inside bar range to require capitulation for longs and exhaustion for shorts
• Breadth Gate: average robust Z of SPY QQQ IWM to avoid fading when the tape is one-sided
• Gap Shock: skip signals after large session gaps
Fusion rule
• All required gates must be true: Energy ≥ energy_trig_prc, |Robust Z| ≥ z_trig, Shape satisfied, Breadth confirmed, Gap filter clear
Signal rule
• Long: energy extreme, Z negative beyond threshold, close near bar low, breadth Z ≤ −breadth_z_ok
• Short: energy extreme, Z positive beyond threshold, close near bar high, breadth Z ≥ +breadth_z_ok
What you will see on the chart
• Standard strategy arrows for entries and exits
• Optional short-side brackets: ATR stop and ATR take profit if enabled
Inputs with guidance
Setup
• Base length: window for percentile ranks and medians. Typical 40 to 80. Longer smooths, shorter reacts.
• ATR length: normalization unit. Typical 10 to 20. Higher reduces noise.
• VWAP band stdev: volatility bands for anchors. Typical 2.0 to 4.0.
• Robust Z window: 40 to 100. Larger for stability.
• Robust Z entry magnitude: 1.2 to 2.2. Higher means stronger extremes only.
• Energy percentile trigger: 90 to 99.5. Higher limits signals to rare stretches.
• Bar close in range gate long: 0.05 to 0.25. Larger requires deeper capitulation for longs.
Regime and Breadth
• Use breadth gate: on when trading indices or broad ETFs.
• Breadth Z confirm magnitude: 0.8 to 1.8. Higher avoids fighting thrusts.
• Gap shock percent: 1.0 to 5.0. Larger allows more gaps to trade.
Risk — Short only
• Enable short SL TP: on to bracket shorts.
• Short ATR stop mult: 1.0 to 3.0.
• Short ATR take profit mult: 1.0 to 6.0.
Properties visible in this publication
• Initial capital: 25000USD
• Default order size: Percent of total equity 3%
• Pyramiding: 0
• Commission: 0.03 percent
• Slippage: 5 ticks
• Process orders on close: OFF
• Bar magnifier: OFF
• Recalculate after order is filled: OFF
• Calc on every tick: OFF
• request.security lookahead off where used
Realism and responsible publication
• No performance claims. Past results never guarantee future outcomes
• Fills and slippage vary by venue
• Shapes can move during bar formation and settle on close
• Standard candles only for strategies
Honest limitations and failure modes
• Economic releases or very thin liquidity can overwhelm mean-reversion logic
• Heavy gap regimes may require larger gap filter or TR-based tuning
• Very quiet regimes reduce signal contrast; extend windows or raise thresholds
Open source reuse and credits
• None
Strategy notice
Orders are simulated by TradingView on standard candles. request.security uses lookahead off where applicable. Non-standard charts are not supported for execution.
Entries and exits
• Entry logic: as in Signal rule above
• Exit logic: short side optional ATR stop and ATR take profit via brackets; long side closes on opposite setup
• Risk model: ATR-based brackets on shorts when enabled
• Tie handling: stop first when both could be touched inside one bar
Dataset and sample size
• Test across your visible history. For robust inference prefer 100 plus trades.

Aurum DCX AVE Gold and Silver StrategySummary in one paragraph
Aurum DCX AVE is a volatility break strategy for gold and silver on intraday and swing timeframes. It aligns a new Directional Convexity Index with an Adaptive Volatility Envelope and an optional USD/DXY bias so trades appear only when direction quality and expansion agree. It is original because it fuses three pieces rarely combined in one model for metals: a convexity aware trend strength score, a percentile based envelope that widens with regime heat, and an intermarket DXY filter.
Scope and intent
• Markets. Gold and silver futures or spot, other liquid commodities, major indices
• Timeframes. Five minutes to one day. Defaults to 30min for swing pace
• Default demo used in this publication. TVC:GOLD on 30m
• Purpose. Enter confirmed volatility breaks while muting chop using regime heat and USD bias
• Limits. This is a strategy. Orders are simulated on standard candles only
Originality and usefulness
• Unique fusion. DCX combines DI strength with path efficiency and curvature. AVE blends ATR with a high TR percentile and widens with DCX heat. DXY adds an intermarket bias
• Failure mode addressed. False starts inside compression and unconfirmed breakouts during USD swings
• Testability. Each component has a named input. Entry names L and S are visible in the list of trades
• Portable yardstick. Weekly ATR for stops and R multiples for targets
• Open source. Method and implementation are disclosed for community review
Method overview in plain language
You score direction quality with DCX, size an adaptive envelope with a blend of ATR and a high TR percentile, and only allow breaks that clear the band while DCX is above a heat threshold in the same direction. An optional DXY filter favors long when USD weakens and short when USD strengthens. Orders are bracketed with a Weekly ATR stop and an R multiple target, with optional trailing to the envelope.
Base measures
• Range basis. True Range and ATR over user windows. A high TR percentile captures expansion tails used by AVE
• Return basis. Not required
Components
• Directional Convexity Index DCX. Measures directional strength with DX, multiplies by path efficiency, blends a curvature term from acceleration, scales to 0 to 100, and uses a rise window
• Adaptive Volatility Envelope AVE. Midline ALMA or HMA or EMA plus bands sized by a blend of ATR and a high TR percentile. The blend weight follows volatility of volatility. Band width widens with DCX heat
• DXY Bias optional. Daily EMA trend of DXY. Long bias when USD weakens. Short bias when USD strengthens
• Risk block. Initial stop equals Weekly ATR times a multiplier. Target equals an R multiple of the initial risk. Optional trailing to AVE band
Fusion rule
• All gates must pass. DCX above threshold and rising. Directional lead agrees. Price breaks the AVE band in the same direction. DXY bias agrees when enabled
Signal rule
• Long. Close above AVE upper and DCX above threshold and DCX rising and plus DI leads and DXY bias is bearish
• Short. Close below AVE lower and DCX above threshold and DCX falling and minus DI leads and DXY bias is bullish
• Exit and flip. Bracket exit at stop or target. Optional trailing to AVE band
Inputs with guidance
Setup
• Symbol. Default TVC:GOLD (Correlation Asset for internal logic)
• Signal timeframe. Blank follows the chart
• Confirm timeframe. Default 1 day used by the bias block
Directional Convexity Index
• DCX window. Typical 10 to 21. Higher filters more. Lower reacts earlier
• DCX rise bars. Typical 3 to 6. Higher demands continuation
• DCX entry threshold. Typical 15 to 35. Higher avoids soft moves
• Efficiency floor. Typical 0.02 to 0.06. Stability in quiet tape
• Convexity weight 0..1. Typical 0.25 to 0.50. Higher gives curvature more influence
Adaptive Volatility Envelope
• AVE window. Typical 24 to 48. Higher smooths more
• Midline type. ALMA or HMA or EMA per preference
• TR percentile 0..100. Typical 75 to 90. Higher favors only strong expansions
• Vol of vol reference. Typical 0.05 to 0.30. Controls how much the percentile term weighs against ATR
• Base envelope mult. Typical 1.4 to 2.2. Width of bands
• Regime adapt 0..1. Typical 0.6 to 0.95. How much DCX heat widens or narrows the bands
Intermarket Bias
• Use DXY bias. Default ON
• DXY timeframe. Default 1 day
• DXY trend window. Typical 10 to 50
Risk
• Risk percent per trade. Reporting field. Keep live risk near one to two percent
• Weekly ATR. Default 14. Basis for stops
• Stop ATR weekly mult. Typical 1.5 to 3.0
• Take profit R multiple. Typical 1.5 to 3.0
• Trail with AVE band. Optional. OFF by default
Properties visible in this publication
• Initial capital. 20000
• Base currency. USD
• request.security lookahead off everywhere
• Commission. 0.03 percent
• Slippage. 5 ticks
• Default order size method percent of equity with value 3% of the total capital available
• Pyramiding 0
• Process orders on close ON
• Bar magnifier ON
• Recalculate after order is filled OFF
• Calc on every tick OFF
Realism and responsible publication
• No performance claims. Past results never guarantee future outcomes
• Shapes can move while a bar forms and settle on close
• Strategies use standard candles for signals and orders only
Honest limitations and failure modes
• Economic releases and thin liquidity can break assumptions behind the expansion logic
• Gap heavy symbols may prefer a longer ATR window
• Very quiet regimes can reduce signal contrast. Consider higher DCX thresholds or wider bands
• Session time follows the exchange of the chart and can change symbol to symbol
• Symbol sensitivity is expected. Use the gates and length inputs to find stable settings
Open source reuse and credits
• None
Mode
Public open source. Source is visible and free to reuse within TradingView House Rules
Legal
Education and research only. Not investment advice. You are responsible for your decisions. Test on historical data and in simulation before any live use. Use realistic costs.

FluxGate Daily Swing StrategySummary in one paragraph
FluxGate treats long and short as different ecosystems. It runs two independent engines so the long side can be bold when the tape rewards upside persistence while the short side can stay selective when downside is messy. The core reads three directional drivers from price geometry then removes overlap before gating with clean path checks. The complementary risk module anchors stop distance to a higher timeframe ATR so a unit means the same thing on SPY and BTC. It can add take profit breakeven and an ATR trail that only activates after the trade earns it. If a stop is hit the strategy can re enter in the same direction on the next bar with a daily retry cap that you control. Add it to a clean chart. Use defaults to see the intended behavior. For conservative workflows evaluate on bar close.
Scope and intent
• Markets. Large cap equities and liquid ETFs major FX pairs US index futures and liquid crypto pairs
• Timeframes. From one minute to daily
• Default demo in this publication. SPY on one day timeframe
• Purpose. Reduce false starts without missing sustained trends by fusing independent drivers and suppressing activity when the path is noisy
• Limits. This is a strategy. Orders are simulated on standard candles. Non standard chart types are not supported for execution
Originality and usefulness
• Unique fusion. FluxGate extracts three drivers that look at price from different angles. Direction measures slope of a smoothed guide and scales by realized volatility so a point of slope does not mean a different thing on different symbols. Persistence looks at short sign agreement to reward series of closes that keep direction. Curvature measures the second difference of a local fit to wake up during convex pushes. These three are then orthonormalized so a strong reading in one does not double count through another.
• Gates that matter. Efficiency ratio prefers direct paths over treadmills. Entropy turns up versus down frequency into an information read. Light fractal cohesion punishes wrinkly paths. Together they slow the system in chop and allow it to open up when the path is clean.
• Separate long and short engines. Threshold tilts adapt to the skew of score excursions. That lets long engage earlier when upside distribution supports it and keeps short cautious where downside surprise and venue frictions are common.
• Practical risk behavior. Stops are ATR anchored on a higher timeframe so the unit is portable. Take profit is expressed in R so two R means the same concept across symbols. Breakeven and trailing only activate after a chosen R so early noise does not squeeze a good entry. Re entry after stop lets the system try again without you babysitting the chart.
• Testability. Every major window and the aggression controls live in Inputs. There is no hidden magic number.
Method overview in plain language
Base measures
• Return basis. Natural log of close over prior close for stability and easy aggregation through time. Realized volatility is the standard deviation of returns over a moving window.
• Range basis for risk. ATR computed on a higher timeframe anchor such as day week or month. That anchor is steady across venues and avoids chasing chart specific quirks.
Components
• Directional intensity. Use an EMA of typical price as a guide. Take the day to day slope as raw direction. Divide by realized volatility to get a unit free measure. Soft clip to keep outliers from dominating.
• Persistence. Encode whether each bar closed up or down. Measure short sign agreement so a string of higher closes scores better than a jittery sequence. This favors push continuity without guessing tops or bottoms.
• Curvature. Fit a short linear regression and compute the second difference of the fitted series. Strong curvature flags acceleration that slope alone may miss.
• Efficiency gate. Compare net move to path length over a gate window. Values near one indicate direct paths. Values near zero indicate treadmill behavior.
• Entropy gate. Convert up versus down frequency into a probability of direction. High entropy means coin toss. The gate narrows there.
• Fractal cohesion. A light read of path wrinkliness relative to span. Lower cohesion reduces the urge to act.
• Phase assist. Map price inside a recent channel to a small signed bias that grows with confidence. This helps entries lean toward the right half of the channel without becoming a breakout rule.
• Shock control. Compare short volatility to long volatility. When short term volatility spikes the shock gate temporarily damps activity so the system waits for pressure to normalize.
Fusion rule
• Normalize the three drivers after removing overlap
• Blend with weights that adapt to your aggression input
• Multiply by the gates to respect path quality
• Smooth just enough to avoid jitter while keeping timing responsive
• Compute an adaptive mean and deviation of the score and set separate long and short thresholds with a small tilt informed by skew sign
• The result is one long score and one short score that can cross their thresholds at different times for the same tape which is a feature not a bug
Signal rule
• A long suggestion appears when the long score crosses above its long threshold while all gates are active
• A short suggestion appears when the short score crosses below its short threshold while all gates are active
• If any required gate is missing the state is wait
• When a position is open the status is in long or in short until the complementary risk engine exits or your entry mode closes and flips
Inputs with guidance
Setup Long
• Base length Long. Master window for the long engine. Typical range twenty four to eighty. Raising it improves selectivity and reduces trade count. Lowering it reacts faster but can increase noise
• Aggression Long. Zero to one. Higher values make thresholds more permissive and shorten smoothing
Setup Short
• Base length Short. Master window for the short engine. Typical range twenty eight to ninety six
• Aggression Short. Zero to one. Lower values keep shorts conservative which is often useful on upward drifting symbols
Entries and UI
• Entry mode. Both or Long only or Short only
Complementary risk engine
• Enable risk engine. Turns on bracket exits while keeping your signal logic untouched
• ATR anchor timeframe. Day Week or Month. This sets the structural unit of stop distance
• ATR length. Default fourteen
• Stop multiple. Default one point five times the anchor ATR
• Use take profit. On by default
• Take profit in R. Default two R
• Breakeven trigger in R. Default one R
Usage recipes
Intraday trend focus
• Entry mode Both
• ATR anchor Week
• Aggression Long zero point five Aggression Short zero point three
• Stop multiple one point five Take profit two R
• Expect fewer trades that stick to directional pushes and skip treadmill noise
Intraday mean reversion focus
• Session windows optional if you add them in your copy
• ATR anchor Day
• Lower aggression both sides
• Breakeven later and trailing later so the first bounce has room
• This favors fade entries that still convert into trends when the path stays clean
Swing continuation
• Signal timeframe four hours or one day
• Confirm timeframe one day if you choose to include bias
• ATR anchor Week or Month
• Larger base windows and a steady two R target
• This accepts fewer entries and aims for larger holds
Properties visible in this publication
• Initial capital 25.000
• Base currency USD
• Default order size percent of equity value three - 3% of the total capital
• Pyramiding zero
• Commission zero point zero three percent - 0.03% of total capital
• Slippage five ticks
• Process orders on close off
• Recalculate after order is filled off
• Calc on every tick off
• Bar magnifier off
• Any request security calls use lookahead off everywhere
Realism and responsible publication
• No performance promises. Past results never guarantee future outcomes
• Fills and slippage vary by venue and feed
• Strategies run on standard candles only
• Shapes can update while a bar is forming and settle on close
• Keep risk per trade sensible. Around one percent is typical for study. Above five to ten percent is rarely sustainable
Honest limitations and failure modes
• Sudden news and thin liquidity can break assumptions behind entropy and cohesion reads
• Gap heavy symbols often behave better with a True Range basis for risk than a simple range
• Very quiet regimes can reduce score contrast. Consider longer windows or higher thresholds when markets sleep
• Session windows follow the exchange time of the chart if you add them
• If stop and target can both be inside a single bar this strategy prefers stop first to keep accounting conservative
Open source reuse and credits
• No reused open source beyond public domain building blocks such as ATR EMA and linear regression concepts
Legal
Education and research only. Not investment advice. You are responsible for your decisions. Test on history and in simulation with realistic costs

Dollar Volume Ownership Gauge Dollar Volume Ownership Gauge (DVOG)
By: Mando4_27
Version: 1.0 — Pine Script® v6
Overview
The Dollar Volume Ownership Gauge (DVOG) is designed to measure the intensity of real money participation behind each price bar.
Instead of tracking raw share volume, this tool converts every bar’s trading activity into dollar volume (price × volume) and highlights the transition points where institutional capital begins to take control of a move.
DVOG’s mission is simple:
Show when the crowd is trading vs. when the institutions are buying control.
Core Concept
Most retail traders focus on share count (volume) — but institutions think in dollar exposure.
A small-cap printing a 1-million-share candle at $1 is very different from a 1-million-share candle at $10.
DVOG normalizes this by displaying total traded dollar value per bar, then color-codes and alerts when the volume of money crosses key thresholds.
This exposes the exact moments when ownership is shifting — often before major breakouts, reclaims, or exhaustion reversals.
How It Works
Dollar Volume Calculation
Each candle’s dollar volume is computed as close × volume.
Data is aggregated from the 5-minute timeframe regardless of your current chart, allowing consistent institutional-flow detection on any resolution.
Threshold Logic
Two customizable levels define interest zones:
$500K Threshold → Early or moderate institutional attention.
$1M Threshold → High-conviction or aggressive accumulation.
Both levels can be edited to fit different market caps or trading styles.
Bar Coloring Scheme
Red = Dollar Volume ≥ $1,000,000 → Significant institutional activity / control bar.
Green = Dollar Volume ≥ $500,000 and < $1,000,000 → Emerging accumulation / transition bar.
Black = Below $500,000 → Retail or low-interest zone.
(Colors are intentionally inverted from standard expectation: when volume intensity spikes, the bar turns hotter in tone.)
Plot Display
Histogram style plot displays 5-minute aggregated dollar volume per bar.
Dotted reference lines mark $500K and $1M levels, with live right-hand labels for quick reading.
Optional debug label shows current bar’s dollar value, closing price, and raw volume for transparency.
Alerts & Conditions
DVOG includes three alert triggers for hands-off monitoring:
Alert Name Trigger Message Purpose
Green Bar Alert – Dollar Volume ≥ $500K When dollar volume first crosses $500K “Institutional interest starting on ” Signals early money entering.
Dollar Volume ≥ $500K Same as above, configurable “Early institutional interest detected…” Broad alert option.
Dollar Volume ≥ $1M When dollar volume first crosses $1M “Significant money flow detected…” Indicates heavy institutional presence or ignition bar.
You can enable or disable alerts via checkbox inputs, allowing you to monitor just the levels that fit your style.
Interpretation & Use Cases
Identify Institutional “Ignition” Points:
Watch for sudden green or red DVOG bars after long low-volume consolidation — these often precede explosive continuation moves.
Confirm Breakouts & Reclaims:
If price reclaims a key level (HOD, neckline, or coil top) and DVOG flashes green/red, odds strongly favor follow-through.
Spot Trap Exhaustion:
After a flush or low-volume fade, the first strong green/red DVOG bar can mark the institutional reclaim — the moment retail control ends.
Filter Noise:
Ignore standard volume spikes. DVOG only reacts when dollar ownership materially changes hands, not when small traders churn shares.
Customization
Setting Default Description
$500K Threshold 500,000 Lower limit for “Green” institutional attention.
$1M Threshold 1,000,000 Upper limit for “Red” heavy institutional control.
Show Alerts ✅ Enable or disable global alerts.
Alert on Green Bars ✅ Toggle only the $500K crossover alerts.
Adjust thresholds to match the liquidity of your preferred tickers — for example, micro-caps may use $100K/$300K, while large-caps might use $5M/$20M.
Reading the Output
Black baseline = Noise / retail chop.
First Green bar = Smart money starts building position.
Red bar(s) = Ownership shift confirmed — institutions active.
Flat-to-rising pattern in DVOG = Sustained accumulation; often aligns with strong trend continuation.
Summary
DVOG transforms raw volume into actionable context — showing you when capital, not hype, is moving.
It’s particularly effective for:
Momentum and breakout traders
Liquidity trap reclaims (Kuiper-style setups)
Identifying early ignition bars before halts
Confirming frontside strength in micro-caps
Use DVOG as your ownership radar — the visual cue for when the market stops being retail and starts being real.