Cerca negli script per "流通市值在50亿至200亿之间的股票中,成交量持续放大的个股有哪些?"

5 Moving Average Exponential 7-15-30-50-2005 Moving Average Exponential. Crypto EMA. 7 is a fast support or resistance, 15 confirmation support or resistance. 30 Important support and resistance. 50 institutional support or resistance. 200 general trend, support and resistance.

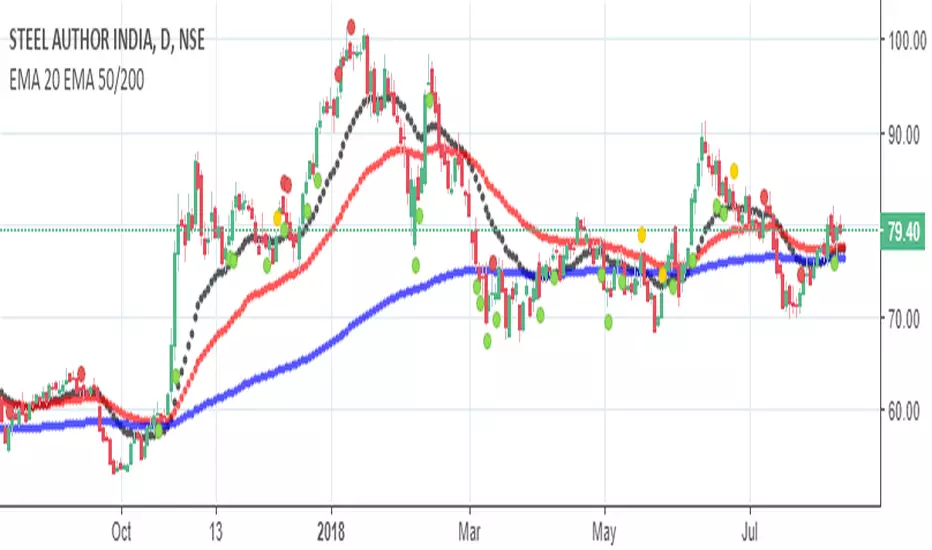
Moving Average 50/200 Golden Cross or Dead CrossA strategy is to apply two moving averages to a chart, one longer and one shorter. When the shorter MA 50 day scrosses above the longer term MA 200 days it's a buy signal as it indicates the trend is shifting up.This is known as a "golden cross."
When the shorter MA crosses below the longer term MA it's a sell signal as it indicates the trend is shifting down. This is known as a "dead/death cross"
For cryptocurrencies use 4 hour charts.

MA Cross 50/200 - Moving Averageindicates short-term 50-day moving average AND long-term 200-day moving average CROSS
@GateTicker

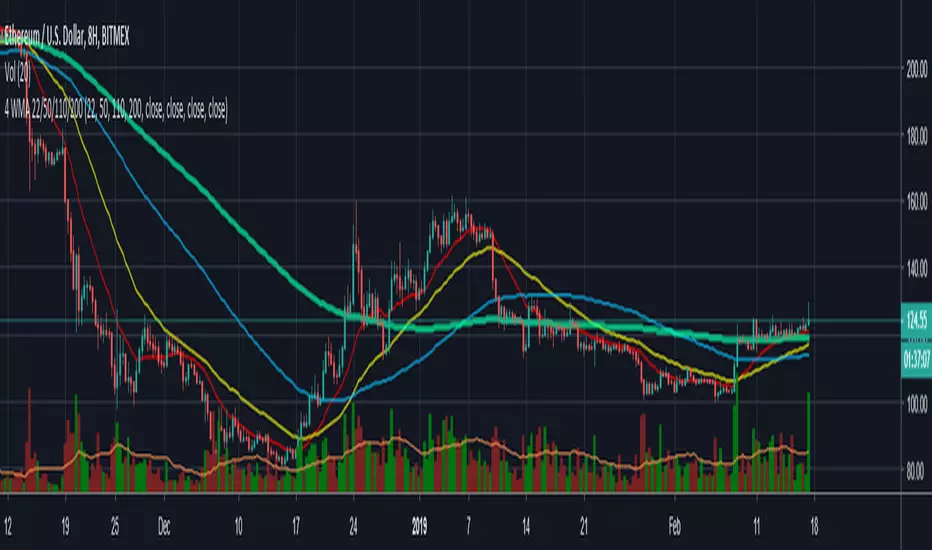
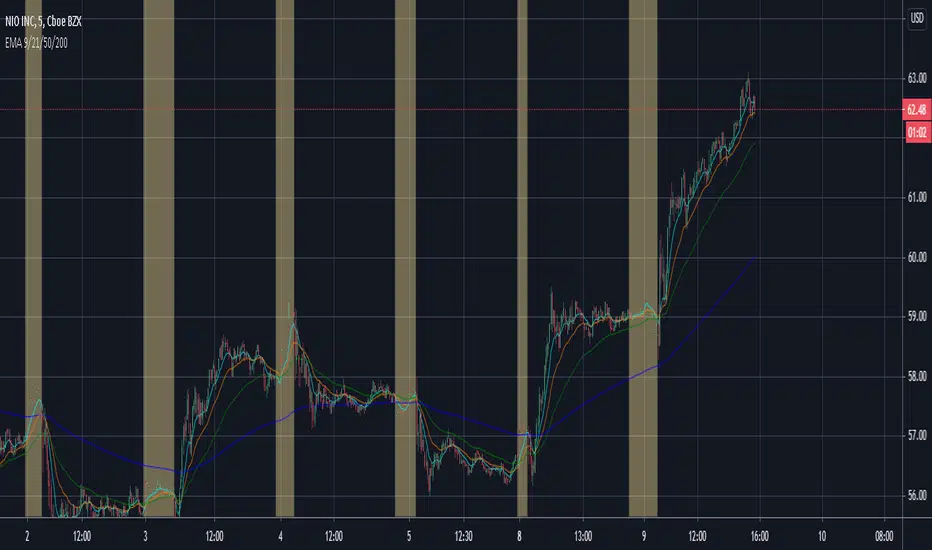
Single Timeframe Moving AverageProvides Moving average of 200 and 50 at the specific timeframe regardless of what interval you're looking at.
Saving the need to change it manually each time you switch the interval.
In this chart, I am looking at 4H interval with EMA of 50/200 of daily timeframe.
boot2thrill - EMA 20/50 & SMA 50/200//Notes:
//Version by boot2thrill on 05-20-2019.
//Version includes combined Exponential Moving Averages EMA 20/50 and Simple Moving Averages SMA 50/200.
//***Recommended use on BTCUSD 1h/4h/1d chart.***

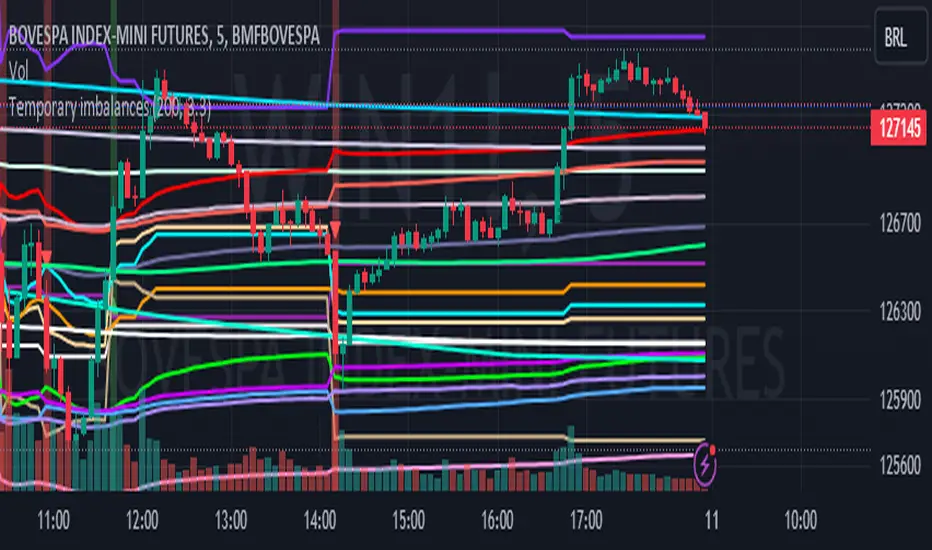
Temporary imbalances 2.0 This indicator attempts to calculate potential points of imbalance and equilibrium based on VWAPs and modified moving averages. The idea is to determine if there has been a change in volume and perform the calculation from that point It uses the standard deviation to determine the significant imbalance threshold. Candles with bullish imbalances are highlighted in green, while candles with bearish imbalances are highlighted in red.
"It also features a set of VWAPs and modified moving averages that you can enable or disable."
When you activate the 'Show Anchor VWAP' option, it will add five modified VWAPs.
Practical Significance:
The Anchored VWAP is a volume-weighted average price that serves as a dynamic reference to assess the average price during specific moments of market imbalance.
During a bullish imbalance, the anchor_vwap reflects the VWAP at that moment, emphasizing price behavior during that specific period.
Similarly, in a bearish imbalance, the anchor_vwap provides the associated VWAP for that condition, highlighting price movements during the imbalance phase.
How to Use:
The anchor_vwap can be employed to contextualize the volume-weighted average price during critical moments associated with significant changes in market imbalance.
By analyzing price behavior during and after periods of imbalance, the Anchored VWAP can help better understand market dynamics and identify potential areas of support or resistance.
Show VWAP Percent Imbalance"
Definition: Represents the Volume Weighted Average Price (VWAP) adjusted by the volume-weighted average of the price multiplied by volume, with a focus on conditions where the percentage volume variation surpasses a predefined threshold.
Calculation: Utilizes the simple moving average weighted of the product of the volume-weighted average price and volume only when the percentage volume variation exceeds a specific threshold.
Interpretation: Provides insight into the volume-weighted price trend during conditions where the percentage volume variation exceeds a predefined limit.
The "showDeltaVWAP" is a toggleable setting that you can turn on or off. When activated, it displays special lines on the chart. Let's understand what these lines represent:
Delta Anchor VWAP:
A green line (Delta Anchor VWAP) represents a measure of market volume imbalance.
Delta2 Anchor VWAP:
A red line (Delta2 Anchor VWAP) shows another perspective of volume imbalance.
VWAP Delta Volume:
A light blue line (VWAP Delta Volume) displays a volume-weighted average of price.
VWAP Delta Volume2:
An orange line (VWAP Delta Volume2) shows another view of the volume-weighted average of price.
Delta3 Anchor VWAP:
A light blue line (Delta3 Anchor VWAP) represents a combination of the previous measures.
Delta4 Anchor VWAP:
A purple line (Delta4 Anchor VWAP) is another combination, providing an overall view.
These lines are based on different conditions and calculations related to trading volume. When you activate "showDeltaVWAP," these lines appear on the chart, aiding in better understanding market behavior.
"Show Faster Volatility" is an option that you can enable or disable. When activated (set to true), it displays special lines on the chart called "Faster Volatility VWAP," "Faster Volatility VWAP2," and "Faster Volatility VWAP3." Let's understand what these lines represent:
Faster Volatility VWAP:
A purple line (Faster Volatility VWAP) is a Volume Weighted Average Price (VWAP) that is calculated more quickly based on short-term price reversal patterns.
Faster Volatility VWAP2:
A light gray line (Faster Volatility VWAP2) is another Volume Weighted Average Price (VWAP) that is calculated even more quickly based on even shorter-term price reversal patterns.
Faster Volatility VWAP3:
A purple line (Faster Volatility VWAP3) is another Volume Weighted Average Price (VWAP) calculated rapidly based on even shorter-term price reversal patterns.
These lines are designed to indicate moments of possible exhaustion of volatility in the market, suggesting that there may be a subsequent increase in volatility. When you activate "Show Faster Volatility," these lines are displayed on the chart.
"Show Average VWAPs Imbalance" displays weighted averages of different Volume Weighted Average Prices (VWAPs) in relation to specific market conditions. Here's an explanation of each component:
Standard VWAP:
The blue line represents the standard VWAP, a volume-weighted average of asset prices over a specific period.
VWAP with Added Imbalance (avg_vwap2):
The pink line is a weighted average that adds an imbalance value to the standard VWAP. This component highlights periods of market imbalance.
VWAP with Balance (avg_vwap3):
The lilac line is a weighted average that adds balance based on the imbalance between uptrend and downtrend, reflecting changes in volume. This provides insights into supply and demand dynamics.
Overall Average of VWAPs (avg_vwaptl):
The violet line is a weighted average that incorporates both standard and adjusted VWAPs, offering an overview of market behavior under different considered conditions.
Visual Customization (Show Average VWAPs Imbalance):
Users have the option to show or hide these average lines on the chart, allowing for a clear visualization of market trends.
"Show Min Variation VWAP" is associated with the calculation and display of a smoothed version of the Volume Weighted Average Price (VWAP), taking into account the minimum price variation over a specific period.
"How Imbalance Anchor VWAP Calculated as the smoothed relationship between liquidity difference and maximum VWAP equilibrium" is associated with the calculation and display of a smoothed version of the Imbalance Anchor VWAP. Here is a detailed explanation:
Calculations and Smoothing:
The variable "smoothed_difference" represents the exponential moving average (EMA) of the difference between two variables related to liquidity.
"smoothed_difference2" is the division of "smoothed_difference" by the maximum variation of the VWAP Equilibrium.
"smoothed_difference3" involves additional manipulation of "smoothed_difference" and "vwap_delta3."
"smoothed_difference4" incorporates the previous results, adjusted by the value of the VWAP.
Visual Customization:
The user has the option to enable or disable the display on the chart.
The line is colored in a shade of green.
It provides a smoothed representation of the Imbalance Anchor VWAP.
The line is colored in a shade of blue, and the calculation involves the summation of moving averages (20, 50, 200). Afterward, there is division by 3. Additionally, there is the summation of moving averages (766, 866, 966), divided by 3. The final step is to add these results together and divide by 2. media name is Imbalance Value2
Show VWAP Equilibrium (Max Variation) Calculated as the difference between two VWAPs derived from the highest and lowest price changes
Show Equilibrium VWAP Calculated as the sum of VWAP and (sma200 - sma20)
calculate the difference between the media of 200 to 20
Show Equilibrium VWAP Calculated as the sum of VWAP and (766+866+966)/3 - (sma200 - sma20)
Show Equilibrium VWAP Standard Deviation Calculated as the Exponential Moving Average (EMA) of the Standard Deviation of SMA (sma200 + sma20 + sma8)/3
Show Equilibrium VWAP Delta Calculated as the ratio of the smoothed VWAP Delta Result componentes
Show Standard Deviation Equilibrium VWAP Delta: Calculated as the Standard Deviation between the Average of VWAP Delta Result Components and Their Smoothed Versions
This average attempts to calculate the equilibrium."
vwap_equilibrium:
Definition: Represents the Volume Weighted Average Price (VWAP) adjusted by the volume-weighted average of the price (hl2) multiplied by volume, focusing on periods of volume equilibrium.
Calculation: Utilizes the simple moving average weighted (sma) of the product of the volume-weighted average price and volume only when there is no volume imbalance.
Interpretation: This indicator provides a view of the volume-weighted price trend during moments when the market is in equilibrium, meaning there is no noticeable imbalance in volume conditions. The calculation of VWAP is adjusted to reflect market characteristics during periods of stability.
vwap_percent_condition:
Definition: Represents the Volume Weighted Average Price (VWAP) adjusted by the volume-weighted average of the price multiplied by volume, with a focus on conditions where the percentage volume variation surpasses a predefined threshold.
Calculation: Utilizes the simple moving average weighted of the product of the volume-weighted average price and volume only when the percentage volume variation exceeds a specific threshold.
Interpretation: Provides insight into the volume-weighted price trend during conditions where the percentage volume variation exceeds a predefined limit.
The objective of these two VWAPs is to calculate possible equilibrium points between buyers and sellers.
The indicator works for all timeframes This indicator can be adjusted according to the preferences and characteristics of the specific asset or market. It provides clear visual information and can be used as a complementary tool for technical analysis in trading strategies.
Interesting
Interesting
lookback period 7 , 12, 20,70,200, 500,766,866,966
imbalance threshold 2.4, 3.3 ,4.2
The objective of this indicator is to identify and highlight various points of imbalance and equilibrium.
Long only strategy VWAP with BB and Golden Cross EMA50/200
This is strategy, mainly designed for stock markets
It makes uses of the EMA 50/ 200 ( Golden cross) and VWAP and Bollinger bands.
It only takes long positions. It can be adapted to all time frames, but preferably to be used with longer timeframes 1h +
The rules for entry are the next ones :
1. EMA50 > EMA 200
2. if current close > vwap session value
3. check if price dipped BB lower band for any of last 10 candles
EXIT RULE
1. price closes above BB upper
STOP LOSS EXIT
1. As configured --- default is set to 1%

Toolbar-FrenToolbar-Fren is a comprehensive, data-rich toolbar designed to present a wide array of key metrics in a compact and intuitive format. The core philosophy of this indicator is to maximize the amount of relevant, actionable data available to the trader while occupying minimal chart space. It leverages a dynamic color-coded system to provide at-a-glance insights into market conditions, instantly highlighting positive/negative values, trend strength, and proximity to important technical levels.
Features and Data Displayed
The toolbar displays a vertical column of critical data points, primarily calculated on the Daily timeframe to give a broader market context. Each cell is color-coded for quick interpretation.
DAY:
The percentage change of the current price compared to the previous day's close. The cell is colored green for a positive change and red for a negative one.
LOD:
The current price's percentage distance from the Low of the Day.
HOD
The current price's percentage distance from the High of the Day.
MA Distances (9/21 or 10/20, 50, 200)
These cells show how far the current price is from key Daily moving averages (MAs).
The values are displayed either as a percentage distance or as a multiple of the Average Daily Range (ADR), which can be toggled in the settings.
The cells are colored green if the price is above the corresponding MA (bullish) and red if it is below (bearish).
ADR
Shows the 14-period Average Daily Range as a percentage of the current price. The cell background uses a smooth gradient from green (low volatility) to red (high volatility) to visualize the current daily range expansion.
ADR%/50: A unique metric showing the distance from the Daily 50 SMA, measured in multiples of the 14-period Average True Range (ATR). This helps quantify how extended the price is from its mean. The cell is color-coded from green (close to the mean) to red (highly extended).
RSI
The standard 14-period Relative Strength Index calculated on the Daily timeframe. The background color changes to indicate potentially overbought (orange/red) or oversold (green) conditions.
ADX
The 14-period Average Directional Index (ADX) from the Daily timeframe, which measures trend strength. The cell is colored to reflect the strength of the trend (e.g., green for a strong trend, red for a weak/non-trending market). An arrow (▲/▼) is also displayed to indicate if the ADX value is sloping up or down.
User Customization
The indicator offers several options for personalization to fit your trading style and visual preferences:
MA Type
Choose between using Exponential Moving Averages (EMA 9/21) or Simple Moving Averages (SMA 10/20) for the primary MA calculations.
MA Distance Display
Toggle the display of moving average distances between standard percentage values and multiples of the Average Daily Range (ADR).
Display Settings
Fully customize the on-chart appearance by selecting the table's position (e.g., Top Right, Bottom Left) and the text size. An option for a larger top margin is also available.
Colors
Personalize the core Green, Yellow, Orange, and Red colors used throughout the indicator to match your chart's theme.
Technical Parameters
Fine-tune the length settings for the ADX and DI calculations.

Adaptive Multi-TF Indicator Table with Presets giua64📌 Script Name:
Adaptive Multi-Timeframe Indicator Table with Presets — giua64
📄 Description:
This script displays an adaptive multi-timeframe dashboard that summarizes the signals of three key technical indicators:
Moving Averages (MAs), Relative Strength Index (RSI), and MACD.
It provides a fast and visually intuitive overview of market conditions across five timeframes (5m, 15m, 30m, 1h, 4h), helping traders quickly identify potential directional biases (e.g., bullish, bearish, or neutral) based on either predefined presets or fully manual settings.
🧰 Preset Configurations:
You can choose between four trading styles, each with optimized indicator parameters:
Scalping
• MAs: 5 / 10 (Fast), 20 / 50 (Slow)
• RSI: 7 periods | Overbought: 70 | Oversold: 30
• MACD: 5 / 13 | Signal: 3
Intraday
• MAs: 9 / 21 (Fast), 50 / 100 (Slow)
• RSI: 14 periods | Overbought: 60 | Oversold: 40
• MACD: 12 / 26 | Signal: 9
Swing
• MAs: 10 / 20 (Fast), 50 / 200 (Slow)
• RSI: 14 periods | Overbought: 65 | Oversold: 35
• MACD: 12 / 26 | Signal: 9
Manual
• Full custom control over all indicator settings.
🛠️ All settings can be customized manually from the options panel, including the exact MA periods, RSI thresholds, and MACD structure.
🧠 How It Works:
For each timeframe, the script evaluates:
MA crossover status (two levels):
The first symbol refers to the crossover of the fast MAs
The second symbol refers to the crossover of the slow MAs
🟢 = Bullish crossover
🔴 = Bearish crossover
➖ = Flat or no clear signal
RSI Direction:
↑ = RSI above upper threshold (potential overbought)
↓ = RSI below lower threshold (potential oversold)
→ = RSI in neutral range
MACD Line vs Signal Line:
↑ = MACD line is above signal line (bullish)
↓ = MACD line is below signal line (bearish)
→ = Flat or neutral signal
Each signal is assigned a numerical score. These are aggregated per timeframe to compute a combined score that reflects the directional bias for that specific time window.
🧠 Adaptive Logic by Asset:
This script is designed to be universally compatible across all asset types — including forex, crypto, stocks, indices, and commodities.
Thanks to its multi-timeframe nature and flexible indicator presets, the script automatically adjusts its behavior based on the asset selected, ensuring relevant analysis without requiring manual recalibration.
🧾 Summary Table Output:
At the bottom of the dashboard, a combined sentiment is displayed for:
3TF → 5m, 15m, 30m
4TF → Adds 1h
5TF → Adds 4h
Each row shows:
Signal → LONG / SHORT / NEUTRAL
Confidence (%) → Based on score aggregation and signal consistency
📌 Customization Options:
Table Position: Left, Right, or Center
Text Size: Small, Normal, or Large
Full Manual Configuration: All MA, RSI, and MACD parameters can be adjusted as needed
⚠️ Disclaimer:
This script is for educational and analytical purposes only.
It does not constitute financial advice or guarantee any trading results.
Always do your own research and apply responsible risk management.

Uptrick:Intensity IndexPurpose:
The "Uptrick: Intensity Index" strategy is designed to provide traders with insights into the trend intensity of security by combining multiple moving averages and their relative positions. This versatile tool can be used effectively by both short-term and long-term traders to identify potential buy and sell signals based on specific conditions.
Explanation:
Input Parameters and Customization:
Moving Averages Lengths:
Adjust MA1, MA2, and MA3 lengths to change the calculation periods for the moving averages.
Trend Intensity Index SMA Length:
Adjust the length of the SMA applied to the TII.
Plot Colors:
Change the colors of the TII and TII MA plots for better visualization.
Background Colors and Transparency:
Set different colors for positive and negative TII MA values.
Control the transparency of the background color.
---------------------------------------------------------------------------
MA1 (Length 10): Short-term moving average, useful for capturing short-term market trends.
MA2 (Length 20): Medium-term moving average, providing a balanced view of market trends.
MA3 (Length 50): Long-term moving average, offering insights into long-term market trends.
The script calculates the relative positions of the closing price to each moving average (rel1, rel2, rel3) to determine how far the current price deviates from each average.
Trend Intensity Index (TII):
The TII is calculated as the average of the relative positions (rel1, rel2, rel3), multiplied by 100 to convert it into a percentage. This index reflects the overall intensity of the trend, considering short-term, medium-term, and long-term perspectives.
The TII is plotted in blue, providing a visual representation of trend intensity.
SMA of TII:
An additional SMA is applied to the TII (matii) to smooth out fluctuations and provide a clearer long-term trend signal.
The SMA of TII is plotted in orange, offering a reference for long-term trend analysis.
Determining Potential Price Movements:
For Short-Term Traders:
When the blue TII line crosses above the orange SMA of TII line, it indicates a potential buy signal.
When the blue TII line crosses below the orange SMA of TII line, it indicates a potential sell signal.
For Long-Term Traders:
When the orange SMA of TII line crosses above the highlighted 0 line, it indicates a potential buy signal.
When the orange SMA of TII line crosses below the highlighted 0 line, it indicates a potential sell signal.
Plotting and Visualization:
The TII and its SMA are plotted with distinct colors for easy identification.
A horizontal line at 0 is plotted in gray to serve as a reference point for long-term trend signals.
The background color changes based on the value of the SMA of TII (matii):
Green background for matii values above 0, indicating bullish conditions.
Red background for matii values below 0, indicating bearish conditions.
Utility and Potential Usage:
The "Uptrick: Intensity Index" indicator is a powerful tool for both short-term and long-term traders, offering clear buy and sell signals based on the crossover of the TII and its SMA, as well as the position of the SMA relative to the zero line.
By consolidating multiple moving averages and their relative positions into a single indicator, traders can gain comprehensive insights into market trends and intensity.
The ability to adjust all inputs and toggle visibility options enhances the flexibility and utility of the indicator, making it suitable for various trading styles and market conditions.
Through its versatile design and advanced features, the "Uptrick: Intensity Index" indicator equips traders with actionable insights into trend intensity and potential price movements. By integrating this robust tool into their trading strategies, traders can navigate the markets with greater precision and confidence, thereby enhancing their trading outcomes.
WHAT SETTINGS TO HAVE FOR THE MOVING AVERAGE:
Short-term traders (day traders) might prefer a shorter SMA length (e.g., 5-20 periods) as they are looking for quick signals and react to price changes more rapidly.
Medium-term traders (swing traders) might opt for a medium SMA length (e.g., 20-50 periods) which can filter out some noise and provide a clearer signal on the trend.
Long-term traders (position traders) might choose a longer SMA length (e.g., 50-200 periods) to get a broader view of the market trend and avoid reacting to short-term fluctuations.

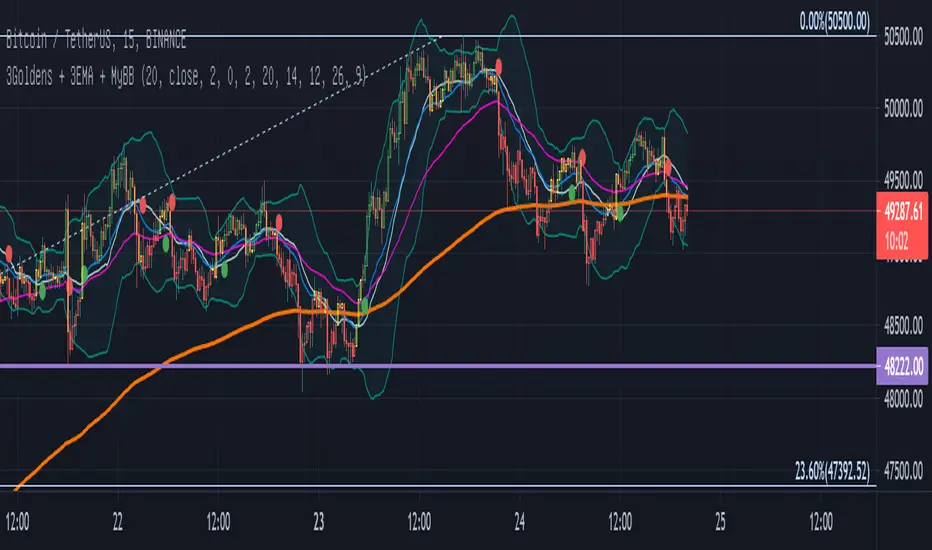
Three Golden By Moonalert =========================
English
=========================
Three Golden By Moonalert
(Green Bar) BUY = All three conditions are agree uptrend.
1 candlestick is on the middle line of Bollinger Bands
2 RSI is more than 50
3 MACD cross up Zero Line
(Red Bar) SELL = All three conditions are agree downtrend
1 candlestick is under the middle line of Bollinger Bands
2 RSI is less than 50
3 MACD cross down Zero Line
(Yello Bar) Wait and see = some candition are agree uptrend or downtrend
Basic logic is
Green = Buy
Red = Sell
Yello = wait and see
Working Good for TF Daily.
=========================
THAI
=========================
เขียว = ซื้อ ( Bollinger bands , Rsi , Macd บอกขึ้นทั้งหมด )
เเดง = ขาย ( Bollinger bands , Rsi , Macd บอกลงทั้งหมด )
เหลือง = นั่งนิ่งๆ ( Bollinger bands , Rsi , Macd บอกขั้นหรือลงบางตัว )
สามารถปรับMACD ระหว่าง
Cross Signal กับ Cross Zeroได้ เเนะนำอย่างหลัง
สามารถปรับ EMA 20 50 200 เปิดปิดได้ที่ตั้งค่า
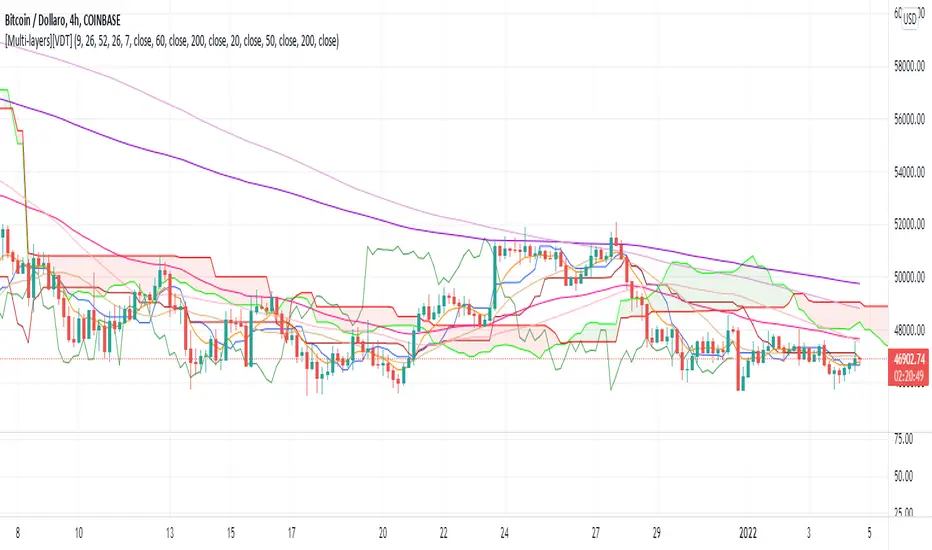
[Multi-layers][VDT]New multi-indicator to merge together three of the most popular indicators used by traders in technical analysis:
1) Ichimoku Cloud, with parameters editable by the trader. Default parameters are: 9-26-52-26
2) 3X Simple Moving Average (SMA), with periods editable by the trader. Default periods are: 20-50-200
3) 3X Exponential Moving Average (EMA), with periods editable by the trader. Default periods are: 7-60-200
Traders can decide whether to print or to hide each indicators separately in the graph, creating three different overlays.
Timeframe StrategyThis is a multi-timeframe trading strategy inspired by Ross Cameron's style, optimized for scalping and trend-following across various timeframes (1m, 5m, 15m, 1h, and 1D). The strategy integrates a comprehensive set of technical indicators, dynamic risk management, and visual tools.
Core Features
Dynamic Take Profit, Stop Loss & Trailing Stop
> Separate settings per timeframe for:
-TP% (Take Profit)
-SL% (Stop Loss)
-Trailing Stop %
-Cooldown bars
> Configurable via UI inputs.
>Smart Entry Conditions
Bullish entry: EMA9 crossover EMA20 and EMA50 > EMA200
Bearish entry: EMA9 crossunder EMA20 and EMA50 < EMA200
>Additional confirmation filters:
-Volume Filter (enabled/disabled via UI)
-Time Filter (e.g., only between 15:00–20:00 UTC)
-Spike Filter: rejects high-volatility candles
-RSI Filter: above/below 50 for trend confirmation
-ADX Filter (only applied on 1m, e.g., ADX > 15)
-Micro-Volatility Filter: minimum range percentage (1m only)
-Trend Filter (1m only): price must be above/below EMA200
>Trailing Stop Logic
-Configurable for each timeframe.
- Optional via toggle (use_trailing).
>Trade Cooldown Logic
-Prevents consecutive trades within X bars, configurable per timeframe.
>Technical Indicators Used
-EMA 9 / 20 / 50 / 200
-VWAP
-RSI (14)
-ATR (14) for volatility-based spike filtering
-Custom-calculated ADX (14) (manually implemented)
>Visual Elements
🔼/🔽 Entry signals (long/short) plotted on the chart.
📉 Table in bottom-left:
Displays current values of EMA/VWAP/volume/ATR/ADX.
> Optional "Tab info" panel in top-right (toggleable):
-Timeframe & strategy settings
-Live status of filters (volume, time, cooldown, spike, RSI, ADX, range, trend)
-Uses emoji (✅ / ❌) for quick diagnostics.
>User Customization
-Inputs per timeframe for all key parameters.
-Toggle switches for:
-Trailing stop
-Volume filter
-Info table visibility
This strategy is designed for active traders seeking a balance between momentum entry, risk control, and adaptability across timeframes. It's ideal for backtesting quick reversals or breakout setups in fast markets, especially at lower timeframes like 1m or 5m.

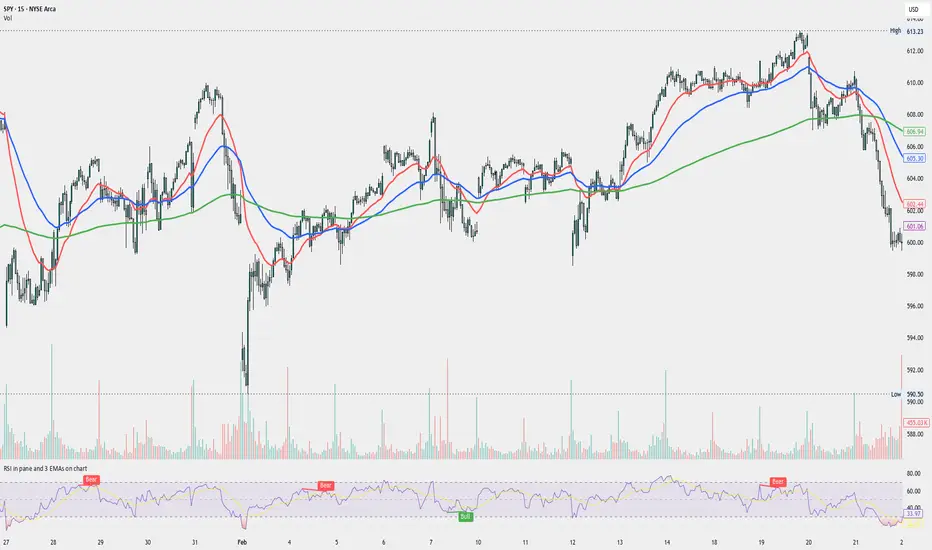
RSI in pane and 3 EMAs on chartCustom RSI in Pane + 3 EMAs on Chart — with Optional RSI Divergence Detection
Combines RSI in a separate pane with 3 EMAs on the chart and optional RSI-based divergence detection. Useful for analyzing both momentum and trend structure.
Features
RSI Pane
Custom RSI calculation (not built-in ta.rsi) with adjustable source and length
Overlay optional moving average (SMA, EMA, SMMA/RMA, WMA, VWMA, or Bollinger Bands) Overbought/oversold gradient fill for visual clarity (70 / 30 zones)
Midline (50) for neutral RSI territory
RSI Divergence Detection
Optional: toggle on/off with one input
Regular Bullish Divergence : Price makes a lower low, RSI makes a higher low
Regular Bearish Divergence : Price makes a higher high, RSI makes a lower high
Customizable lookback for pivot detection
Visual markers and labels plotted on RSI
Built-in alert conditions for both divergence types
3 EMA Trend Indicators on Price Chart
Three customizable EMAs (default: 20, 50, 200)
Color-coded and clearly plotted on main chart
Use to determine short/mid/long-term trend bias
No repainting or smoothing artifacts
Why use this script?
Gives a full view of trend + momentum without cluttering the main price chart, and it helps confirm entries and exits by observing RSI behavior alongside EMAs. The optional divergence detection can act as a signal for potential exhaustion or reversal (not entry signals on their own). It is a Good fit for traders who use RSI zones, divergences, and EMA structure in their decision-making, both for intra-day and swing trades (where it performs best).
How to use
Add this script to your chart. EMAs will appear on the main price chart; RSI and divergence will appear in a separate pane.
Adjust RSI and MA settings to fit your trading style (e.g., fast RSI for scalping, slower for swing)
Enable "Show Divergence" if you want visual alerts and markers
Use alerts to get notified when a divergence occurs without watching the chart
Always check the divergences on different time frames to validate the setup, and do not consider them valid on small time frames (<15 minutes).
Built for traders who want both momentum and trend context in a single tool — without clutter, repainting, or noise. I created this script to streamline my own analysis and avoid switching between multiple indicators. It's not meant to be a "signal generator" but a visual assistant for making better decisions. If you find it useful or have feedback, feel free to reach out.
Triple EMA + Volume/Price SignalsOverview
This script merges three exponential moving averages (EMA) with adaptive volume thresholds to identify high-confidence trends. Unlike basic volume indicators, it triggers signals only when volume exceeds both a user-defined absolute value (e.g., 500k) and a percentage increase (e.g., 5%) – reducing noise in volatile markets.
Key Features
Triple EMA System:
Short (9), Medium (21), and Long (50) EMAs for trend direction.
Bullish Signal: Short EMA > Medium EMA > Long EMA.
Bearish Signal: Short EMA < Medium EMA < Long EMA.
Dual-Threshold Volume Confirmation:
Absolute Volume: Highlight bars where volume exceeds X (e.g., 500,000).
Percentage Increase: Highlight bars where volume rises by Y% (e.g., 5%) vs. prior bar.
Users can enable/disable either threshold.
Customizable Alerts:
Trigger alerts only when both EMA alignment and volume conditions are met.
How It Works
Trend + Volume Synergy:
A bullish EMA crossover alone might be a false breakout. This script requires additional volume confirmation (e.g., 500k volume + 5% spike) to validate the move.
Flexibility: Adjust thresholds for different assets:
Stocks: Higher absolute volume (e.g., 1M shares).
Crypto: Smaller absolute volume but larger % spikes (e.g., 10%).
Usage Examples
Swing Trading:
Set EMA lengths to 20/50/200 and volume thresholds to 500k + 5% on daily charts.
Scalping:
Use 5/13/21 EMAs with 100k volume + 3% spikes on 5-minute charts.

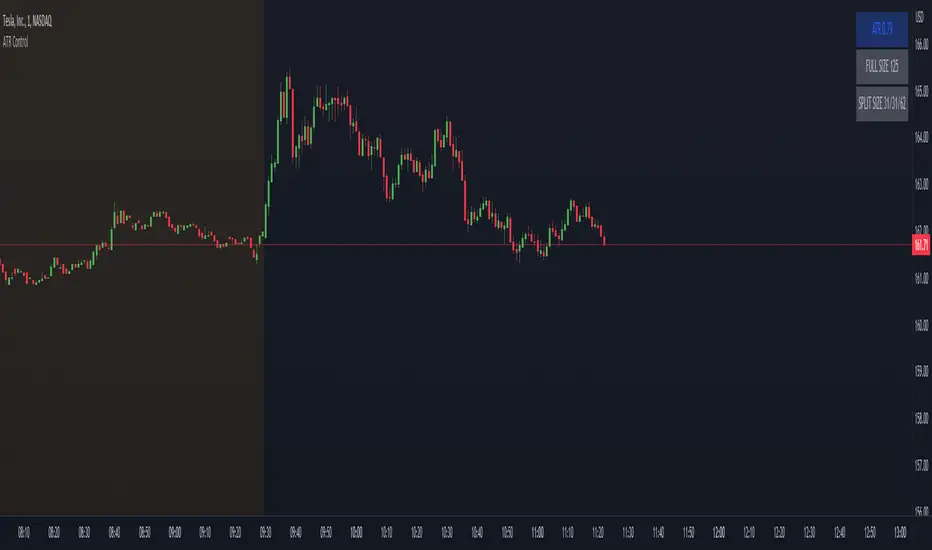
ATR ControlThis indicator shows the following values:
ATR value of the current symbol
Size of the full position based on the maximum risk set
Three sizes that are percents of the full size already present in this indicator
Customizable settings are:
Show/hide single rows
ATR Timeframe
ATR Lenght
First percent of the split to apply
Second percent of the split to apply
Maximum risk
The last percent is automatically calculated using the first two.
Example:
Full size: 500
First percent: 10
Second percent: 40
The third percent is calculated as 100 - first percent - second percent = 50
The split sizes shown are: 50/200/250
MTF Adaptive Trendline Scalper (ATR + EMA System) By GouravThe MTF Adaptive Trendline Scalper is a precision-built trading tool designed for intraday scalpers and swing traders.
🔹 Core Features:
Adaptive Trendline Engine: Dynamically shifts trendline support/resistance using volatility (ATR) and Bollinger-band extremes.
Multi-Timeframe Mode: Calculate signals on your chosen higher timeframe or sync with the chart resolution.
Automatic Buy/Sell Signals: Clear trend reversal markers (💣 Buy / 🔨 Sell) for fast execution.
Volatility Filtering: ATR-based buffer reduces noise in choppy conditions.
Extra EMA Overlay: Plots 9 / 15 / 50 / 200 EMAs to help confirm trend bias and momentum.
🔹 How It Helps You Trade:
Catch scalping entries with trendline flips.
Trade trend-following continuations using EMA alignment.
Spot reversals when price pierces the adaptive channel.
Works on all assets (Forex, Crypto, Stocks, Indices) and any timeframe.
⚠️ Note: This is not financial advice. Always combine with your own risk management and strategy.
