S&P Bear Warning IndicatorTHIS SCRIPT HAS BEEN BUILT TO BE USED AS A S&P500 SPY CRASH INDICATOR ON A DAILY TIME FRAME (should not be used as a strategy).
THIS SCRIPT HAS BEEN BUILT AS A STRATEGY FOR VISUALIZATION PURPOSES ONLY AND HAS NOT BEEN OPTIMIZED FOR PROFIT.
The script has been built to show as a lower indicator and also gives visual SELL signal on top when conditions are met. BARE IN MIND NO STOP LOSS, NOR ADVANCED EXIT STRATEGY HAS BEEN BUILT.
As well as the chart SELL signal an alert option has also been built into this script.
The script utilizes a VIX indicator (maroon line) and 50 period Momentum (blue line) and Danger/No trade zone(pink shading).
When the Momentum line crosses down across the VIX this is a sell off but in order to only signal major sell offs the SELL signal only triggers if the momentum continues down through the danger zone.
A SELL signal could be given earlier by removing the need to wait for momentum to continue down through the Danger Zone however this is designed only to catch major market weakness not small sell offs.
As you can see from the picture between the big October 2018 and March 2020 market declines only 2 additional SELLS were triggered.
To use this indicator to identify ideal buying then you should only buy when Momentum line is crossed above the VIX and the Momentum line is above the Danger Zone (ideally 3 - 5 days above danger zone)
Cerca negli script per "米哈游2018年股票价格"

MACD Cross+MAStrategy MACD cross + Ma cross
การเข้าจะเข้าต่อเมื่อมีการ Cross ของ MACD ก่อน แล้วมีการ Cross ของเส้น ma 9,26 ตามมา
จากการ Backtest ของผมถือว่าเป้น Indicator ที่ค่อนข้างบอกให้เข้าช้าเลยทีเดียว แต่ใช้ Follow เทรนพอใช้ได้อยู่ครับ
แนะนำให้ใช้ในช่วงที่ตลาดเป็นขาขึ้นนะครับ ช่วงหมียาวอย่างปี 2018 Indicator ตั้วนี้ไม่เวิร์คอย่างแรงเลยครับ
ในภาพ backtest ตั้งแต่ปี 2019 - ปัจจุบันนะครับ
ใช้ใน TF Day จะเห็นผลดีที่สุด

Simple Harmonic Oscillator (SHO)The indicator is based on Akram El Sherbini's article "Time Cycle Oscillators" published in IFTA journal 2018 (pages 78-80) (www.ftaa.org.hk)
The SHO is a bounded oscillator for the simple harmonic index that calculates the period of the market’s cycle. The oscillator is used for short and intermediate terms and moves within a range of -100 to 100 percent. The SHO has overbought and oversold levels at +40 and -40, respectively. At extreme periods, the oscillator may reach the levels of +60 and -60. The zero level demonstrates an equilibrium between the periods of bulls and bears. The SHO oscillates between +40 and -40. The crossover at those levels creates buy and sell signals. In an uptrend, the SHO fluctuates between 0 and +40 where the bulls are controlling the market. On the contrary, the SHO fluctuates between 0 and -40 during downtrends where the bears control the market. Reaching the extreme level -60 in an uptrend is a sign of weakness. Mostly, the oscillator will retrace from its centerline rather than the upper boundary +40. On the other hand, reaching +60 in a downtrend is a sign of strength and the oscillator will not be able to reach its lower boundary -40.
Centerline Crossover Tactic
This tactic is tested during uptrends. The buy signals are generated when the WPO/SHI cross their centerlines to the upside. The sell signals are generated when the WPO/SHI cross down their centerlines. To define the uptrend in the system, stocks closing above their 50-day EMA are considered while the ADX is above 18.
Uptrend Tactic
During uptrends, the bulls control the markets, and the oscillators will move above their centerline with an increase in the period of cycles. The lower boundaries and equilibrium line crossovers generate buy signals, while crossing the upper boundaries will generate sell signals. The “Re-entry” and “Exit at weakness” tactics are combined with the uptrend tactic. Consequently, we will have three buy signals and two sell signals.
Sideways Tactic
During sideways, the oscillators fluctuate between their upper and lower boundaries. Crossing the lower boundary to the upside will generate a buy signal. On the other hand, crossing the upper boundary to the downside will generate a sell signal. When the bears take control, the oscillators will cross down the lower boundaries, triggering exit signals. Therefore, this tactic will consist of one buy signal and two sell signals. The sideway tactic is defined when stocks close above their 50-day EMA and the ADX is below 18

Wave Period Oscillator Wave Period Oscillator developed by Akram El Sherbini
Published in article Time Cycle Oscillators in IFTA Journal 2018 (page 66 - 77)
read his article : ifta.org
Entry Long - WPO cross above centerline (Zero Line)
Exit Long - WPO cross below overbought level or cross below centerline(Zero Line)
Entry Short - WPO cross below centerline (Zero Line)
Exit Short - WPO cross above oversold level or cross above centerline(Zero Line)

Fast SMAFast SMA is based on the simple moving average and adds to it more flexibility.
It is a composite indicator, as it uses sma and counts factor that gives more weight for a more recent price index.
The difference between sma (thin line) and fast sma (bold line) you can see on the chart.
Fast sma with default parameters with this script is faster then ema with the same length.
It has flexibility almost as HMA with the same length has.
After using it for two months I found this ma very interesting and decided to share its code and the way it can be used.
FSMA and price index interact:
1) FSMA acts as support or resistance giving price line good pullbacks.
2) If price breaks through FSMA the stop of this move form strong support or resistance level.
3) if price cross FSMA without cutting move of make fuss on FSMA it forms range. In this case, FSMA break must be considered only after price leaves the range. In such cases, FSMA usually shows the direction by giving additional price pullback confirmations.
On the chart I added some comments and marked SR lvls, zones and strong moves of BTC since 2018 till now with submitted FSMA strategy.
I wish you good trades.
examples:

Simple Momentum Strategy Based on SMA, EMA and VolumeA simple, non short selling (long positions only, i.e. buy low and sell high) strategy. Strategy makes use of simple SMA, EMA and Volume indicators to attempt to enter the market at the most optimum time (i.e. when momentum and price are moving upwards). Optimum time is defined mainly by picking best timing for price moves higher based on upwards momentum.
This script is targeted / meant for an average/typical trader or investor. This is why a non short selling approach was selected for optimisation for this strategy because "typpical", "average" traders and investors usually use basic (i.e. minimum fees / free membership) exchanges that would not usually offer short selling functionality (at least without additional fees). The assumption used here is that only advanced and sophisticated traders and investors would pay for advanced trading platforms that enable short selling, have a risk appetite for short selling and thus use short selling as a strategy.
The results of the strategy are:
In an overall roughly bearish market (backward testing from beginning to end of 2018) i.e. the market immediately following the highs of around 20k USD per BTC, this strategy made a loss of £3231 USD on trades of a maximum of 1 BTC per long position.
But in an overall bullish market, it makes a profit of about $6800 USD from beginning of 2019 onwards by trading a maximum of 1 BTC per long position.
NOTE: All trading involves high risk. Most strategies use past performance and behaviour as indicators of future performance and that is not necessarily indicative of future results. Hypothetical or simulated performance results have certain inherent limitations too. One limitation is that unlike an actual performance record, simulated results do not represent actual trading and since the trades have not actually been executed, the results of those trades themselves do not have any influence on actual market results, which in real life they would have had (no matter how minor). Additionally, simulated results may have under or over-compensated for the impact, if any, of certain market factors, such as lack of liquidity. Simulated trading programs in general are also, by their nature, designed with the benefit of hindsight. No representation is being made that any account will or is likely to achieve profits or losses similar to those shown.

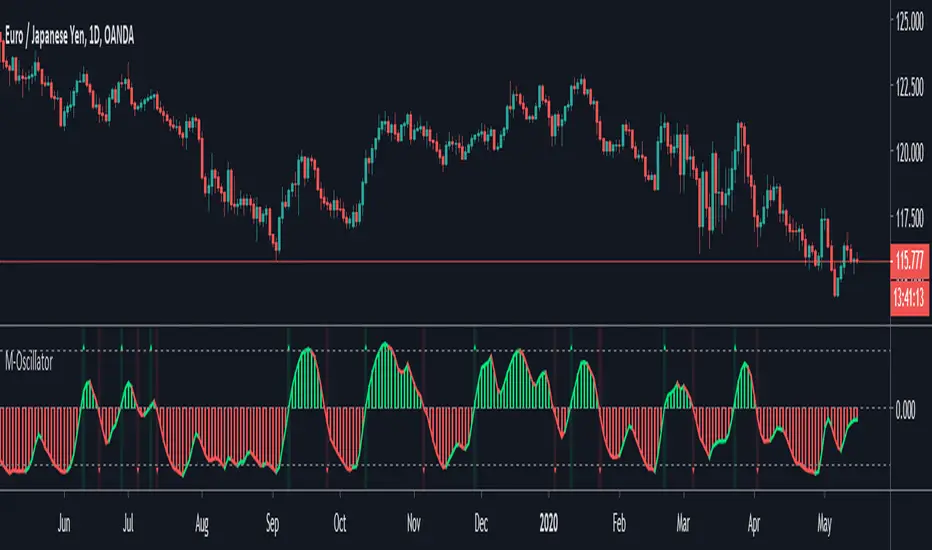
M-OscillatorM-Oscillator developed By Mohamed Fawzy, MFTA, CFTe
as Written in IFTA Journal 2018 Edition
more info : ifta.org
Interpretation
• M-Oscillator is a bounded oscillator that moves between (-14) and (+14),
• Movement above 10 is considered overbought, and movement below -10 is oversold.
Overbought/Oversold rule:
• Buy when the M-Oscillator violates the (-10) level to the downside and crosses back to the upside.
• Sell when the M-Oscillator crosses above the (+10) level and crosses back to the downside.
Crossover on Extreme Levels
• Sell signals are triggered when the M-Oscillator crosses its signal line above (13), which indicates an extreme market condition
• Buy signals are triggered when the M-Oscillator crosses its signal line below (- 13)
inwCoin Martingale Strategy ( for Bitcoin )** Same as my previous martingale script but this version = opensource **
inwCoin Martingale Strategy is the proof of concept strategy that in the end, anyone who using martingale strategy will kaboom their portfolio.
For those who don't know what is "martingale".. it's a simple double down strategy in the hope to cover the loss in previous entry.
Example
In the game that if you win, you'll get 100% of your bet money back.
1st loss = 1$
2nd loss = bet 2$ : if win, get 2$ / real profit = 1$ ( 2-1 )
3rd loss = bet 4$ : if win, get 4$ / real profit = 1$ ( 4 - ( 2+1) )
4th loss = bet 8$ : if win, get 8$ / real profit = 1$ ( 8 - ( 4+2+1 ) )
...
...
10th loss = bet 512$ : if win, get 512$ / real profit = 1$ ( 512 - ( 256+128+64+32+16+8+4+2+1) )
as you can see, the next bet will be first bet x 2^(n-1)
and the profit will equal to your first bet.
==================
In trading and forex EA ( Expert Advisor or bot ) people use this strategy to fool newbies that their martingale system will generate steady income for eternity.
But in reality, this strategy will destroy your whole portfolio eventually some time in the future. Because there will be some "Blackswan event" in market at some point in time. And one who ignore this fact, will lose everything.
But, if you using low risk strategy and generate some profit from your low-risk portfolio. You can take small chunk of that profit and put it in riskier strategy like this martingale, to accerelate your profit snowball.
===================
Parameter Explaination
====================
Price = datasource for indicator calculation
Fixed position size option = if uncheck, the "Start position size" parameter will be % of your initial capital. If checked, it will fixed position size ( like 1 BTC )
Start Position Logic = condition to enter first trade
- MACD singal > 0 : Self explanatory, default macd value
- Stochastic RSI cross up : enter when sto line cross up from bottom ( 20 )
- ATR channel : enter trade if price cross above 2.3 ATR
Take Profit Percent = take profit target % from average entry
Start martingale ..= if price compare to average position entry less than this %, it will start to double down ( martingale )
Martingale Multiplier = you can specific how big you'll double down, default is 2
Trade Direction = long only for now
Use date rang = self explanatory
** make sure to setup your initial capital in properties tab **
On chart
=======
White Line = Average position price
Orange Line = your current equity
If equity less than 0, it will close any remaining positions ( It's mean your position got liquidated )
If price > equity line for "take profit percent" it will close any remaining positions.
=======
As you can see, this strategy survive 2018 drop and pump profit to 1000+% ( Check in the strategy tester tab > list of trades )
But in May 2020 -50% drop in just 3 days, your whole portfolio got liquidated.
Actually, after some digging in profit and backtest result.
This strategy, when it can survive a shape drop, can generate a lot of profit.
So, if you want to use martingale. Make sure to use only small chunk of your profit from "low-risk" strategy to accelerate your profit generation ( aka degen port )
DO NOT greedy and use all of your initial capital or borrowed money to use with this strategy!

M.H Pee indicatorsHere is a collection of Trend Indicators as defined by M.H Pee and presented
in various articles of the "STOCKS & COMMODITIES Magazine"
The actual implementation of the indicators here are made by: everget
I thought they were rather cool, so I have gather them here so that they easily can be tested.
My own test was made using 15 companies from the OMXS30 list
during the time period of 2016-2018, and I only went LONG.
The result was as follows (Average Net Profit , StdDev):
TDI 3.04% 5.97
TTF 1.22%. 5.73
TII 1.07% 6.2
TCF 0.32% 2.68
Would be interesting to hear what other people get as test result from these indicators.
To do that just run this strategy, and chose the indicator from the setup menu.

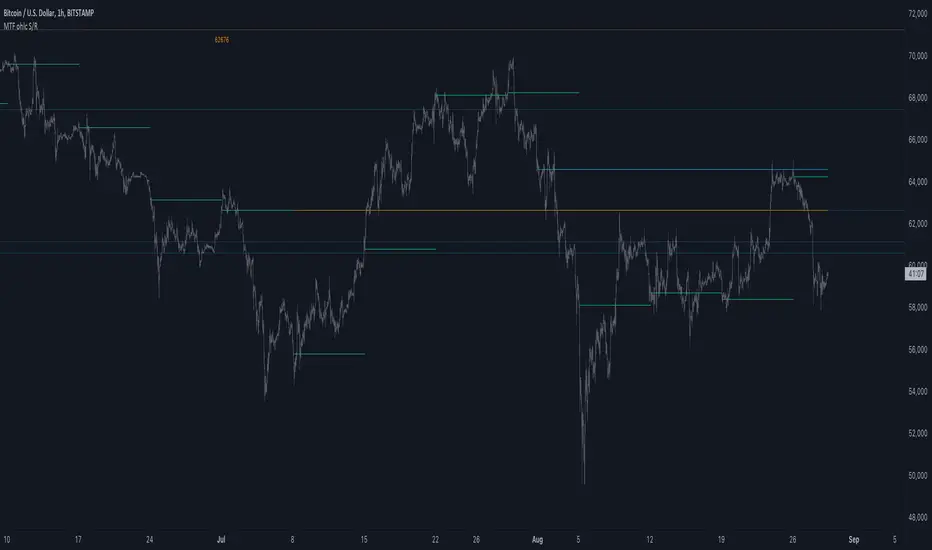
MTF ohlc S/RA very simple idea, a close (or high, low, ohlc4 or open) from a higher Time Frame
will give future Support/Resistance area's
In this example of BTC/USD we see:
- Yearly close 2017 gave Resistance in June 2019
- Yearly close 2018 gave Support in March 2020
We are now pushing to the Resistance of Yearly close 2019...
Since there is a limit for the amount of lines (since it is just too much if everything is plotted)
there are different options:
- 4 different Time Frames, each can be enabled/disabled,
- TF can be chosen,
- source can be changed (close, open, high, low, ohlc4)
- Period can be changed, for example TF Month:
You can choose just to show a particular year, Month,...
You also can choose between which prices you want to see lines,
for example Monthly close, since the beginning till now, but only between $6000 - $8000:
This helps to know the closest S/R around the present price
Other example:
- Lines can be extended to the right, or not
- Labels can be enabled/disabled:
- Linewidth and brightness of the line can be changed, also the style (solid, dashed or dotted line)
Default only 2 very high TF's are enabled (3 Month = one quarter, and 1 Year)
The 3 Month has a dotted line, which helps distinguish the line against the yearly line
- Prices above 1000 are rounded since it seems distracting to see for example 6478,878654,
seems better just to see 6479, prices below 1000 are just seen as intended
Have fun!
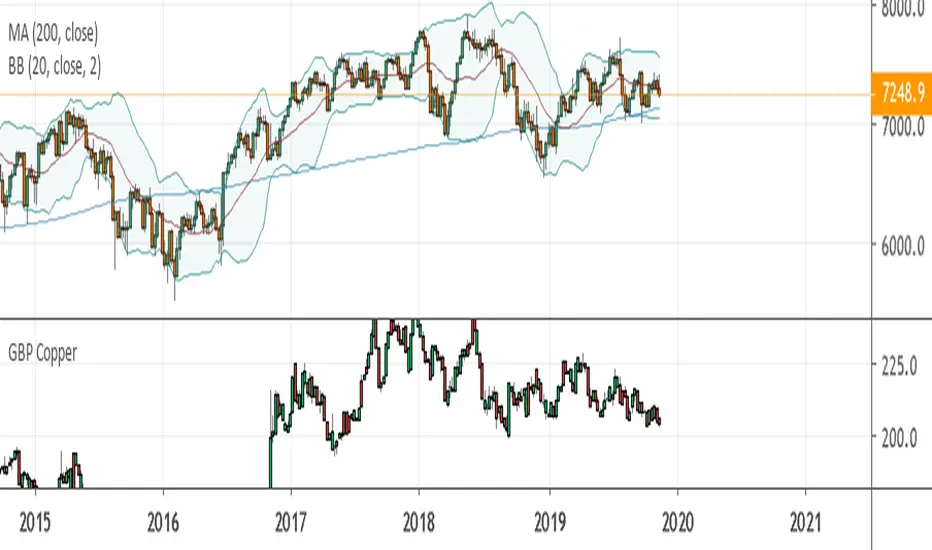
GBP CopperThis is copper prices in GBP.
After noticing that the FTSE100 shot up in March 2018 very sharply and continued into May while the rest of the world seemed to take its time carrying on until September while the FTSE fell back after its May peak, I wonder if the price of copper had any effect.
So here's the price of Copper in GBP.
SMU Price Volume Noise V1This Script show the price volume movement for different time frame. As you can see large buy/sell has significantly increased before the crash or 2018 and similar pattern is developing for 2019/2020. In shorter time frame, the chart shows daily movement of big volume of Buy/Sell and the low volume period appears as a noise. The idea is to look ta the volume price noise to distinguish big market moves from small side line or low volume movement. Fell free to expand on this idea.

Wave Period Oscillator by KIVANC fr3762WPO – Wave Period Oscillator
A Time Cycle Oscillator – Published on IFTA Journal 2018 by Akram El Sherbini (pages 68-77)
(http:www.ftaa.org.hk/Files/2018130101754DGQ1JB2OUG. pdf )
Bullish signals are generated when WPO crosses over 0
Bearish signals are generated when WPO crosses under 0
OverBought level is 2
OverSold level is -2
ExtremeOB level is 2.7
ExtremeOS level is -2.7
As with most oscillators, divergences can be taken advantage of.
via PROREALCODE
Here's the link to a complete list of all my indicators:
tr.tradingview.com
Şimdiye kadar Tradingview'a eklediğim tüm indikatörlerin tam listesi için:
tr.tradingview.com

Volume & Dollar BarsThis scriptlet is a part of an ongoing project and attempts at volume and dollar bar identification. The original idea is taken from excellent books 'Hands-On Machine Learning for Algorithmic Trading' (2019) by Stefan Jansen and 'Advances in Financial Machine Learning' (2018) by Marcos Lopez de Prado.
Statement of Purpose
I am an advocate of Open source and against those who publish their code with a lock icon. My code and ideas are aimed at people with critical thinking, who are able to take an informative and responsible decision when it comes to investing their funds. I do not guarantee that all of my ideas will perform well. As usual, they require a certain degree of your sound judgment. My final aim is to provide you with coding techniques that you could use in your own scripts and strategies.

Trend Direction Helper (ZigZag and S/R and HH/LL labels)Hey everyone
First of all, I'd like to thank Ricardo Santos, Backtest Rookies for the inspiration for this script.
Actually, most of it is coming from them and I only mixed them up (and added my secret sauce ^^). If some of you are not thinking about a trading secret sauce, please get serious for a moment :)
Some of you asked me how I do to set the trend direction. You all understood that if you get an UP label, then the price should go up and vice-versa for down.
But it's not so easy to define the good signals for each asset and each timeframe. I'm going to repeat what I said yesterday because ... well... that's what trading is about
So quoting myself here "The inputs set by default will have to be changed for your asset/timeframe and can't be generic for everything. You have to play with the inputs until the signals will make sense to you
The indicator/strategy with a unique configuration that you'll never check or update according to the market condition DOES NOT exit. "
BUT... a bit of patience and practice and you might do wonders.
The Method
I never realized until now but by connecting the higher highs/lower lows, I was drawing zigzag lines.
The Zig Zag Master is Ricardo Santos . Please give him a follow, he's awesome
For those who don't want to draw on the chart or (my preferred choice) need some inspiration to define your trend directions, this script is for YOU (and your family, your pet, your girlfriend/boyfriend, ...)
I think that each asset/timeframe chart has its own history. What worked in a post could work in the future.
In that regard, if a trend direction worked in the past, that's the parameter that I'll use to trade with it in a demo account and make sure it's relevant. If not then I will adjust
If you're trading with new indicators or a new method right away on your real trading account, you're gonna have a bad time imgflip.com
Lines EVERYWHERE
The script draws the classical horizontal pivots + the zig zag lines + the Higher Highs/Lower Lows label in just 1 script. I'm very excited to share a script (on which I coded 100 lines out of 500) but no one else did it
The horizontal pivots part are coming from Backtest Rookies
For more security, you can add a pullback on a moving average after getting a signal. Pullbacks are necessary to limit any eventual loss or maximize your gains by getting in the trend sooner.
I really give you a solid method and a great script in my opinion. 6 years of experience given away for FREE :p (when Dave will start thinking as a business man instead :O)
Does it repaint ?
Getting this question twice a day. You guys are obsessed with the repainting :)
Short answer, yes because it will calculate the pivots and zig zags whenever new higher highs/lower lows will be formed.
However, the trend direction code is based on the candle close so it shouldn't repaint. If it does, please let me know
See you all on Monday
Love you all
Dave
____________________________________________________________
Be sure to hit the thumbs up. Building those indicators take a lot of time and likes are always rewarding for me :) (tips are accepted too)
- If you want to suggest some indicators that I can develop and share with the community, please use my personal TRELLO board
- I'm an officially approved PineEditor/LUA/MT4 approved mentor on codementor. You can request a coaching with me if you want and I'll teach you how to build kick-ass indicators and strategies
Jump on a 1 to 1 coaching with me
- You can also hire for a custom dev of your indicator/strategy/bot/chrome extension/python
Disclaimer:
Trading involves a high level of financial risk, and may not be appropriate because you may experience losses greater than your deposit. Leverage can be against you.
Do not trade with capital that you can not afford to lose. You must be aware and have a complete understanding of all the risks associated with the market and trading. We can not be held responsible for any loss you incur.
Trading also involves risks of gambling addiction.
Please notice I do not provide financial advice - my indicators, strategies, educational ideas are intended to provide only some source code for anyone interested in improving their trading
The proprietary indicators and strategies developed by Best Trading Indicator, the object of intellectual property rights are and remain the exclusive property of Best Trading Indicator, at the exclusion of images and videos and texts free of rights or provided by the Company or external legal or physical person.
No assignment of intellectual property rights is carried out through these Terms and Conditions.
Any total or partial reproduction, modification or use of these properties for any reason whatsoever is strictly prohibited without the express written authorization of the Company.

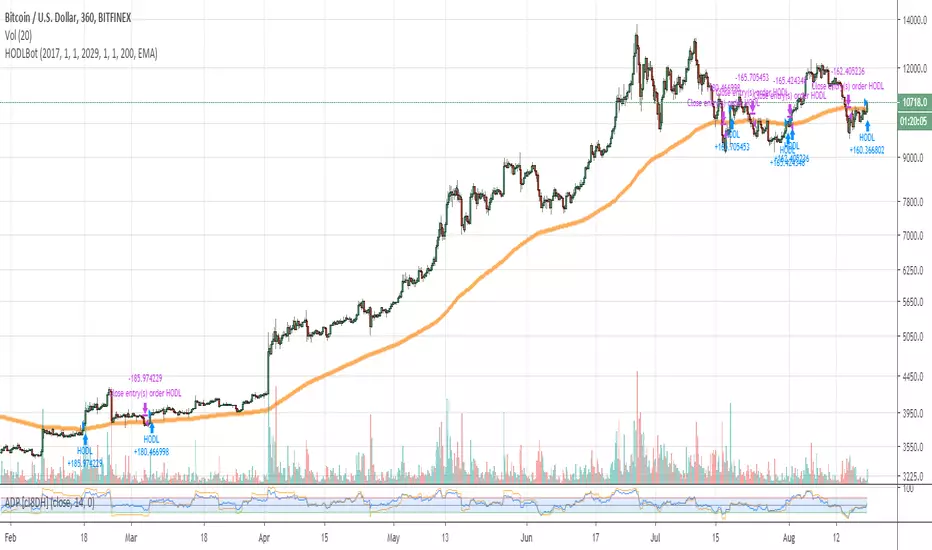
HODLBotHODLBot is a very simple script that HODLs BTC when price > 200 EMA on 6hr timeframe, and sells (closes long) when price < 200 EMA.
Designed to be used with just coins / not leveraged trading, to allow restful sleep knowing that you're not participating in brutal drawdowns like 2018 ^_^
Correlation MATRIX (Flexible version)Hey folks
A quick unrelated but interesting foreword
Hope you're all good and well and tanned
Me? I'm preparing the opening of my website where we're going to offer the Algorithm Builder Single Trend, Multiple Trends, Multi-Timeframe and plenty of others across many platforms (TradingView, FXCM, MT4, PRT). While others are at the beach and tanning (Yes I'm jealous, so what !?!), we're working our a** off to deliver an amazing looking website and great indicators and strategies for you guys.
Today I worked in including the Trade Manager Pro version and the Risk/Reward Pro version into all our Algorithm Builders. Here's a teaser
We're going to have a few indicators/strategies packages and subscriptions will open very soon.
The website should open in a few weeks and we still have loads to do ... (#no #summer #holidays #for #dave)
I see every message asking me to allow access to my Algorithm Builders but with the website opening shortly, it will be better for me to manage the trials from there - otherwise, it's duplicated and I can't follow all those requests
As you can probably all understand, it becomes very challenging to publish once a day with all that workload so I'll probably slow down (just a bit) and maybe posting once every 2/3 days until the website will be over (please forgive me for failing you). But once it will open, the daily publishing will resume again :) (here's when you're supposed to be clapping guys....)
While I'm so honored by all the likes, private messages and comments encouraging me, you have to realize that a script always takes me about 2/3 hours of work (with research, coding, debugging) but I'm doing it because I like it. Only pushing the brake a bit because of other constraints
INDICATOR OF THE DAY
I made a more flexible version of my Correlation Matrix .
You can now select the symbols you want and the matrix will update automatically !!! Let me repeat it once more because this is very cool... You can now select the symbols you want and the matrix will update automatically :)
Actually, I have nothing more to say about it... that's all :) Ah yes, I added a condition to detect negative correlation and they're being flagged with a black dot
Definition : Negative correlation or inverse correlation is a relationship between two variables whereby they move in opposite directions.
A negative correlation is a key concept in portfolio construction, as it enables the creation of diversified portfolios that can better withstand portfolio volatility and smooth out returns.
Correlation between two variables can vary widely over time. Stocks and bonds generally have a negative correlation, but in the decade to 2018, their correlation has ranged from -0.8 to 0.2. (Source : www.investopedia.com
See you maybe tomorrow or in a few days for another script/idea.
Be sure to hit the thumbs up to cheer me up as your likes will be the only sunlight I'll get for the next weeks.... because working on building a great offer for you guys.
Dave
____________________________________________________________
- I'm an officially approved PineEditor/LUA/MT4 approved mentor on codementor. You can request a coaching with me if you want and I'll teach you how to build kick-ass indicators and strategies
Jump on a 1 to 1 coaching with me
- You can also hire for a custom dev of your indicator/strategy/bot/chrome extension/python

Dollar Cost Average (Data Window Edition)Hi everyone
Hope you had a nice weekend and you're all excited for the week to come. At least I am (thanks to a few coffee but that still counts !!!)
This indicator is inspired from Dollar-Cost-Average-Cost-Basis
EDUCATIONAL POST
The educational post is coming a bit later this afternoon explaining how to use the indicator so I would advise to follow me so that you'll get updated in real-time :) (shameless self-advertising)
1 - What is Dollar-Cost Averaging (DCA)?
Dollar-Cost Averaging is a strategy that allows an investor to buy the same dollar amount of an investment on regular intervals. The purchases occur regardless of the asset's price.
I hope you're hungry because that one is a biggie and gave me a few headaches. Happy that it's getting out of my way finally and I can offer it
This indicator will analyse for the defined date range, how a dollar cost average (DCA) method would have performed vs investing all the hard earnt money at the beginning
2- What's on the menu today ?
Please check this screenshot to understand what you're supposed to see : CLICK ME I'M A SCREENSHOT (I'll repeat this URL one more time below as I noticed some don't read the information on my description and then will come pinging me saying "sir me no understand your indicator, itz buggy sir"
(yes I finally thought about a way to share screenshots on TradingView, took me 4 weeks, I'm slow to understand things apparently)
My indicator works with all asset classes and with the daily/weekly/monthly timeframes
As always, let's review quickly the different fields so that you'll understand how to use it (and I won't get spammed with questions in DM ^^)
- Use current resolution : if checked will use the resolution of the chart
- Timeframe used for DCA : different timeframe to be used if Use current resolution is unchecked
- Amount invested in your local currency : The amount in Fiat money that will be invested at each period selected above
- Starting Date
- Ending Date
- Select a candle level for the desired timeframe : If you want to use the open or close of the selected period above. Might make a diffence when the timeframe is weekly or monthly
3 - Specifications used
I got the idea from this website dcabtc.com and the result shown by this website and my indicator are very interesting in general and for your own trading
The formula used for the DCA calculation is that one : Investopedia Dollar Cost Average
4 - How to interpret the results
"But sir which results ??"...... those ones : CLICK ME I'M A SCREENSHOT :) (strike #2 with the screenshot)
It will draw all the plots and will give you some nice data to analyze in the Data Window section of TradingView
I'm not completely satisfied with the tool yet but the results are very closed to the dcabtc website mentioned above
If you're trading a very bullish asset class (who said crypto ?), it's very interesting to see what a DCA strategy could bring in term of performance. But DCA is not magic, there is a time component which is the day/week/month you'll start to invest (those who invested in crypto beginning of 2018 in altcoins know what I'm talking about and ..............will hate me for this joke)
5 - What's next ?
As said, the educational post is coming next but not only.
Will probably post a strategy tomorrow using this indicator so that you can compare what's performing best between your trading and a dollar cost average method
I'll publish as a protected source this time a more advanced version of that one including DCA forecasts
6 - Suggested alternative (but I'll you doing it)
If you don't want to have this panel in the bottom with the plots and analyze the results in the data window, you can always create an infopanel like shown here Risk-Reward-InfoPanel/ and display all the data there
Hope you'll like it, like me, love it, love me, tip me :)
____________________________________________________________
Feel free to hit the thumbs up as it shows me that I'm not doing this for nothing and will motivate to deliver more quality content in the future. (Meaning... a few likes only = no indicators = Dave enjoying the beach)
- I'm an offically approved PineEditor/LUA/MT4 approved mentor on codementor. You can request a coaching with me if you want and I'll teach you how to build kick-ass indicators and strategies
Jump on a 1 to 1 coaching with me
- You can also hire for a custom dev of your indicator/strategy/bot/chrome extension/python

3-day Death/Golden CrossBased on Crypto Crew University youtube video, "Emergency Update: New Bitcoin GOLDEN Cross Emerges (btc crypto live news market price today 2019 ta" (19 June 2019), comparing 2015 and 2018 bull runs.
Golden Ratio Macro Top IndicatorsThis is inspired by Philip Swift's Golden Ratio Multiplier research however it uses the 300 DMA to predict the Macro Cycle Top's Price. It still uses the 350 DMA * 2 and 111 DMA to predict the top's date (the two cross).
111 DMA (Orange) crosses the 350 DMA * 2 (Green) predicts the Macro Cycle Top Date
300 DMA * 3 (Red) predicts the Current Macro Cycle Top Price
300 DMA * 5 (Yellow) predicted the 2018 Macro Cycle Top Price
300 DMA * 8 (Blue) predicted the 2014 Macro Cycle Top Price

Golden RatioThis is inspired by Philip Swift's Golden Ratio Multiplier research however it uses the 300 DMA to predict the Macro Cycle Top's Price. It still uses the 350 DMA * 2 and 111 DMA to predict the top's date (the two cross).
111 DMA (Orange) crosses the 350 DMA * 2 (Green)= Macro Cycle Top Date
300 DMA * 3 (Red) predicts the Current Macro Cycle Top Price
300 DMA * 5 (Yellow) predicted the 2018 Macro Cycle Top Price
300 DMA * 8 (Blue) predicted the 2014 Macro Cycle Top Price

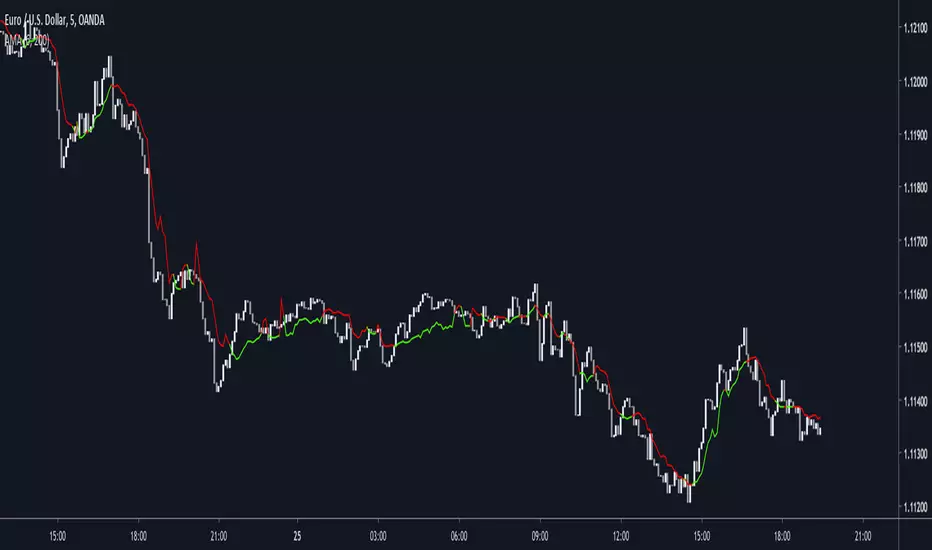
Dynamically Adjustable Moving AverageIntroduction
The Dynamically Adjustable Moving Average (AMA) is an adaptive moving average proposed by Jacinta Chan Phooi M’ng (1) originally provided to forecast Asian Tiger's futures markets. AMA adjust to market condition in order to avoid whipsaw trades as well as entering the trending market earlier. This moving average showed better results than classical methods (SMA20, EMA20, MAC, MACD, KAMA, OptSMA) using a classical crossover/under strategy in Asian Tiger's futures from 2014 to 2015.
Dynamically Adjustable Moving Average
AMA adjust to market condition using a non-exponential method, which in itself is not common, AMA is described as follow :
1/v * sum(close,v)
where v = σ/√σ
σ is the price standard deviation.
v is defined as the Efficacy Ratio (not be confounded with the Efficiency Ratio) . As you can see v determine the moving average period, you could resume the formula in pine with sma(close,v) but in pine its not possible to use the function sma with variables for length, however you can derive sma using cumulation.
sma ≈ d/length where d = c - c_length and c = cum(close)
So a moving average can be expressed as the difference of the cumulated price by the cumulated price length period back, this difference is then divided by length. The length period of the indicator should be short since rounded version of v tend to become less variables thus providing less adaptive results.
AMA in Forex Market
In 2014/2015 Major Forex currencies where more persistent than Asian Tiger's Futures (2) , also most traded currency pairs tend to have a strong long-term positive autocorrelation so AMA could have in theory provided good results if we only focus on the long term dependency. AMA has been tested with ASEAN-5 Currencies (3) and still showed good results, however forex is still a tricky market, also there is zero proof that switching to a long term moving average during ranging market avoid whipsaw trades (if you have a paper who prove it please pm me) .
Conclusion
An interesting indicator, however the idea behind it is far from being optimal, so far most adaptive methods tend to focus more in adapting themselves to market complexity than volatility. An interesting approach would have been to determine the validity of a signal by checking the efficacy ratio at time t . Backtesting could be a good way to see if the indicator is still performing well.
References
(1) J.C.P. M’ng, Dynamically adjustable moving average (AMA’) technical
analysis indicator to forecast Asian Tigers’ futures markets, Physica A (2018),
doi.org
(2) www.researchgate.net
(3) www.ncbi.nlm.nih.gov
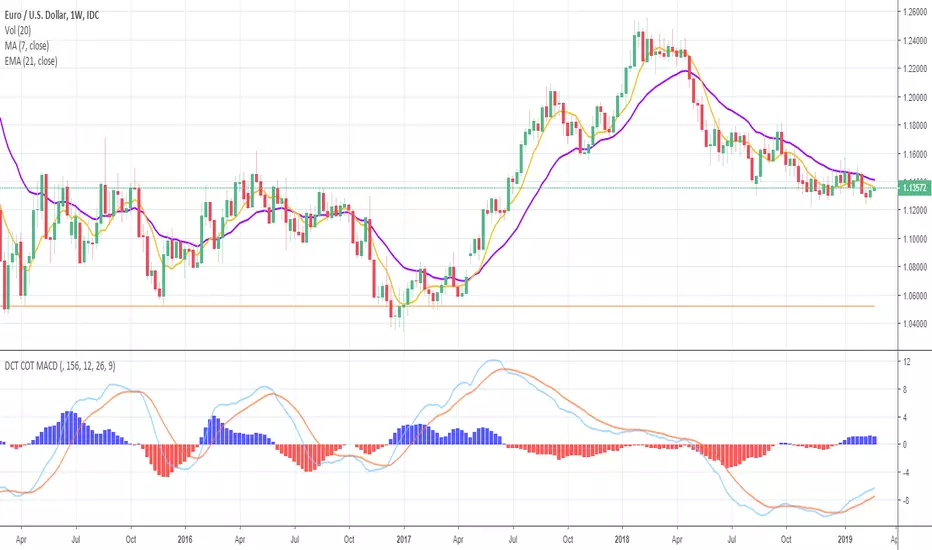
Deckchair Trader COT MACDPlots the COT MACD from the legacy report data from Quandl. Plots the commercial, non commercial and non reportables. Each plot can be hidden as needed.
I've tried to capture the basic dollar based currencies and the futures such as corn , wheat , rice, oil , hogs etc. The symbols required a little translation to match what Quandl is expecting but I think I got most of them. Please let me know of any issues with these.
Part of a suite of COT related indicators based on the excellent book "the commitment of traders bible" by Stephen Briese.
Feb 26, 2018
Release Notes: Quandl have changed their codes :( now they seem to be using the CFTC Id's where are numeric (and can be found in the dump you get from them)
So whereas before for example, GBPUSD was mapped to BP it is now mapped to 096742.
I have gone through the various dumps and tried to map all the symbols I was using, the currency were the easy ones, the wheat, corn etc a little harder to trade down due to variations.
Please let me know if different
Thanks
Tim Titchmarsh
DeckchairTrader