Multi SMA EMA WMA HMA BB (4x3 MAs Bollinger Bands) Pro MTF - RRBMulti SMA EMA WMA HMA 4x3 Moving Averages with Bollinger Bands Pro MTF by RagingRocketBull 2018
Version 1.0
This indicator shows multiple MAs of any type SMA EMA WMA HMA etc with BB and MTF support, can show MAs as dynamically moving levels.
There are 4 MA groups + 1 BB group. You can assign any type/timeframe combo to a group, for example:
- EMAs 50,100,200 x H1, H4, D1, W1 (4 TFs x 3 MAs x 1 type)
- EMAs 8,13,21,55,100,200 x M15, H1 (2 TFs x 6 MAs x 1 type)
- D1 EMAs and SMAs 12,26,50,100,200,400 (1 TF x 6 MAs x 2 types)
- H1 WMAs 7,77,231; H4 HMAs 50,100,200; D1 EMAs 144,169,233; W1 SMAs 50,100,200 (4 TFs x 3 MAs x 4 types)
- +1 extra MA type/timeframe for BB
compile time: 25-30 sec
full redraw time after parameter change in UI: 3 sec
There are several versions: Simple, MTF, Pro MTF, Advanced MTF and Ultimate MTF. This is the Pro MTF version. The Differences are listed below. All versions have BB
- Simple: you have 2 groups of MAs that can be assigned any type (5+5)
- MTF: +2 custom Timeframes for each group (2x5 MTF)
- Pro MTF: +4 custom Timeframes for each group (4x3 MTF), MA levels and show max bars back options
- Advanced MTF: +2 extra MAs/group (4x5 MTF), custom Ticker/Symbol, backreferences for type, TF and MA lengths in UI
- Ultimate MTF: +individual settings for each MA, custom Ticker/Symbols
Features:
- 4x3 = 12 MAs of any type including Hull Moving Average (HMA)
- 4x MTF groups with step line smoothing
- BB +1 extra TF/type for BB MAs
- 12 MA levels with adjustable group offsets, indents and shift
- show max bars back
- you can show/hide both groups of MAs/levels and individual MAs
Notes:
1. based on 3EmaBB, uses plot*, barssince and security functions
2. you can't set certain constants from input due to Pinescript limitations - change the code as needed, recompile and use as a private version
3. Levels = trackprice implementation
4. Show Max Bars Back = show_last implementation
5. uses timeframe textbox instead of input resolution to allow for 120 240 and other custom TFs. Also supports TFs in hours: 2H or H2
6. swma has a fixed length = 4, alma and linreg have additional offset and smoothing params
7. Smoothing is applied by default for visual aesthetics on MTF. To use exact ma mtf values (lines with stair stepping) - disable it
MTF Notes:
- uses simple timeframe textbox instead of input resolution dropdown to allow for 120, 240 and other custom TFs, also supports timeframes in H: 2H, H2
- Groups that are not assigned a Custom TF will use Current Timeframe (0).
- MTF will work for any MA type assigned to the group
- MTF works both ways: you can display a higher TF MA/BB on a lower TF or a lower TF MA/BB on a higher TF.
- MTF MA values are normally aligned at the boundary of their native timeframe. This produces stair stepping when a higher TF MA is viewed on a lower TF.
Therefore X Y Point Density/Smoothing is applied by default on MA MTF for visual aesthetics. Set both to 0 to disable and see exact ma mtf values (lines with stair stepping and original mtf alignment).
- Smoothing is disabled for BB MTF bands because fill doesn't work with smoothed MAs after duplicate values are replaced with na.
- MTF MA Value fluctuation is possible on the current bar due to default security lookahead
Smoothing:
- X,Y == 0 - X,Y smoothing disabled (stair stepping on high TFs)
- X == 0, Y > 0 - X,Y smoothing applied to all TFs
- Y == 0, X > 0 - X smoothing applied to all TFs < deltaX_max_tf, Y smoothing disabled
- X > 0, Y > 0 - Y smoothing applied to all TFs, then X smoothing applied to all TFs < deltaX_max_tf
X Smoothing with Y == 0 - shows only every deltaX-th point starting from the first bar.
X Smoothing with Y > 0 - shows only every deltaX-th point starting from the last shown Y point, essentially filling huge gaps remaining after Y Smoothing with points and preserving the curve's general shape
X Smoothing on high TFs with already scarce points produces weird curve shapes, it works best only on high density lower TFs
Y Smoothing reduces points on all TFs, removes adjacent points with prices within deltaY, while preserving the smaller curve details.
A combination of X,Y produces the most accurate smoothing. Higher delta value - larger range, more points removed.
Show Max Bars Back:
- can't set plot show_last from input -> implemented using a timenow based range check
- you can't delete/modify history once plotted, so essentially it just sets a start point for plotting (from num_bars bars back) that works only in realtime mode (not in replay)
Levels:
You can plot current MA value using plot trackprice=true or by checking Show Price Line in Style. Problem is:
- you can only change color (not the dashed line style, width), have both ma + price line (not just the line), and it's full screen wide
- you can't set plot trackprice from input => implemented using plotshape/plotchar with fixed text labels serving as levels
- there's no other way of creating a dynamic level: hline, plot, offset - nothing else works.
- you can't plot a text var - all text strings must be constants, so you can't change the style, width and text labels without recompiling.
- from input you can only adjust offset, indent and shift for each level group, and change color
- the dot below each level line is the exact MA value. If you want just the line swap plotshape with plotchar, recompile and save as your private version, adjust Y shift.
To speed up redraw times: reduce last_bars to ~2000, recompile and use as your own private version
Pinescript is a rudimentary language (should be called Painscript instead) that can basically only plot data. You can't do much else. Please see the code for tips and hints.
Certain things just can't be done or require shady workarounds and weeks of testing trying to resolve weird node.js compiler errors.
Feel free to learn from/reuse/change the code as needed and use as your own private version. See comments in code. Good Luck!
Cerca negli script per "米哈游2018年股票价格"

JSE Wyckoff Wave Volume Code// The Stock Market Institute (SMI) describes an propriety indicator the "SMI Wyckoff Wave" for US Stocks. This code is an attempt to make a Wyckoff Wave for the Johannesburg Stock Exchange (JSE).
// The JSE Wyckoff Wave is in a separate code. This is the code for the volume of the wave. Please see code for the JSE Wyckoff Wave which goes with this indicator.
//
// The Wave presents a normalized price for the 10 selected stocks (An Index for the 10 stocks).
// The theory is to select stocks that are widely held, market leaders, actively traded and participate in important market moves.
// This is only my attempt to select 10 stocks and a different selection can be made.
// I am not certain how SMI determine their weightings but what I have done it to equalize the Rand value of the stock volumne so that moves are of equal magnitude.
// The then provides a view of the overall condition of the market and volume flow in the market.
//
// I have used the September 2018 price to normalize the stock price for the 10 selected stocks based. The stocks and weightings can be changed periodically depending on the performance and leadership.
//
// Please, let me know if there is a better work around this.
The stocks and their weightings are:
"JSE:BTI"/0.79
"JSE:SHP"/2.87
"JSE:NPN"/0.18
"JSE:AGL"/1.96
"JSE:SOL"/1.0
"JSE:CFR"/4.42
"JSE:MND"/1.40
"JSE:MTN"/7.63
"JSE:SLM"/7.29
"JSE:FSR"/8.25

JSE Wyckoff WaveThe Stock Market Institute (SMI) describes an propriety indicator the "SMI Wyckoff Wave" for US Stocks. This code is an attempt to make a Wyckoff Wave for the Johannesburg Stock Exchange (JSE). Once the wave has been established the volume can also be calculated. Please see code for the JSE Wyckoff Wave Volume which goes with this indicator.
The Wave presents a normalized price for the 10 selected stocks (An Index for the 10 stocks). The theory is to select stocks that are widely held, market leaders, actively traded and participate in important market moves. This is only my attempt to select 10 stocks and a different selection can be made. I am not certain how SMI determine their weightings but what I have done it to equalize the Rand value of the stock so that moves are of equal magnitude. The then provides a view of the overall condition of the market and volume flow in the market.
I have used the September 2018 price to normalize the stock price for the 10 selected stocks based. The stocks and weightings can be changed periodically depending on the performance and leadership.
Most Indecies when constructed assume that all high prices and all low prices happen at the same time and therefor inflate the wicks of the bars. To make the wave more representatives for the SMI Wyckoff Wave the price is determined on the 5 minute timeframe which removes this bias. However, TradingView does not calculate properly when selecting a lower timeframe than in current period. A work around is to call the sma of the highs and add these which provides more realistic tails. Please, let me know if there is a better work around this.
The stocks and their weightings are:
"JSE:BTI"*0.79
"JSE:SHP"*2.87
"JSE:NPN"*0.18
"JSE:AGL"*1.96
"JSE:SOL"*1.0
"JSE:CFR"*4.42
"JSE:MND"*1.40
"JSE:MTN"*7.63
"JSE:SLM"*7.29
"JSE:FSR"*8.25

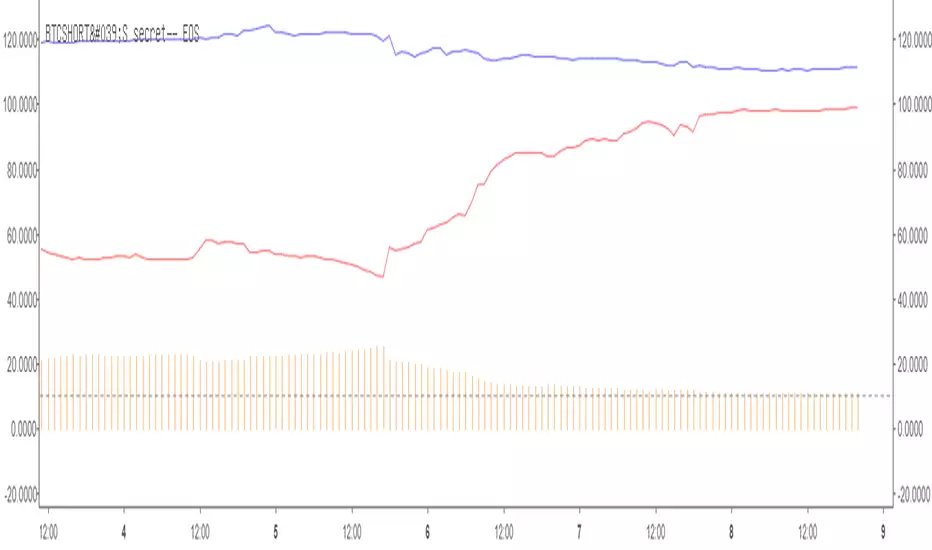
BTCSHORT'S secret_ETHHi everyone, I am back.
After I published my first script, many people ask me if I can provide a long-short ratio script for other cryptocurrencies,ike for EOS /ETH.
SO,I decided to publish a BITshort‘s secret series script.
This script for Eth(Bitfinex)
What’s that
The indicator is BITFINEX Eth total margin positions(longs&shorts)
HOW TO USE THAT ? (Similar as Bitcoin)
1·RED line is Eth total shorts.Red line corresponds to the frist number shown above
2·BLUE line is Eth total longs.Blue line corresponds to the second number shown above
3·The histogramis Long-short ratio, orange one represents taht L/S is more than 1,green one represents that L/S is less than 1.
Histogram corresponds to the third number shown above.
4·The total longs and shorts has been reduced by 10000 times,Long-short ratio magnified 10 times.
For example
Frist number(red) is 19.8285 second(blue) is 27.1612 third(orange or green) is 13.6781
This means that total shorts is 198285 Eth total longs is 271612 Eth and L/S ration is 1.36781
I am a beginner in code writing.The script source code created by user BTCshort.Updated by user legofish123(me) 2018-9-8
Sincerely,again,Thank for BTCSHORT help with my code writing.
BTCshort (Tradingview,ID is BTCSHORT) ,A Bitcoin ghost,is a man who always able to predict the price of bitcoin.So we always call him 'Raytheon' .

BTCSHORT'S secret series—— EOSHi everyone, I am back.
After I published my first script, many people ask me if I can provide a long-short ratio script for other cryptocurrencies,ike for EOS /ETH.
SO,I decided to publish a BTCshort‘s secret series.
This script for EOS(Bitfinex)
What’s that
The indicator is BITFINEX EOS total margin positions(longs&shorts)
HOW TO USE THAT ? (Similar as Bitcoin)
1·RED line is EOS total shorts.Red line corresponds to the frist number shown above
2·BLUE line is EOS total longs.Blue line corresponds to the second number shown above
3·The histogramis Long-short ratio, orange one represents taht L/S is more than 1,green one represents that L/S is less than 1.
Histogram corresponds to the third number shown above.
4·The total longs and shorts has been reduced by 100000 times,Long-short ratio magnified 10 times.
For example
Frist number(red) is 99.0956 second(blue) is 111.3089 third(orange or green) is 11.2325
This means that total shorts is 9909560 EOS total longs is 11130890 EOS and L/S ration is 1.12325
I am a beginner in code writing.The script source code created by user BTCshort.Updated by user legofish123(me) 2018-9-8
Sincerely,again,Thank for BTCSHORT help with my code writing.
BTCshort (Tradingview,ID is BTCSHORT) ,A Bitcoin ghost,is a man who always able to predict the price of bitcoin.So we always call him 'Raytheon' .
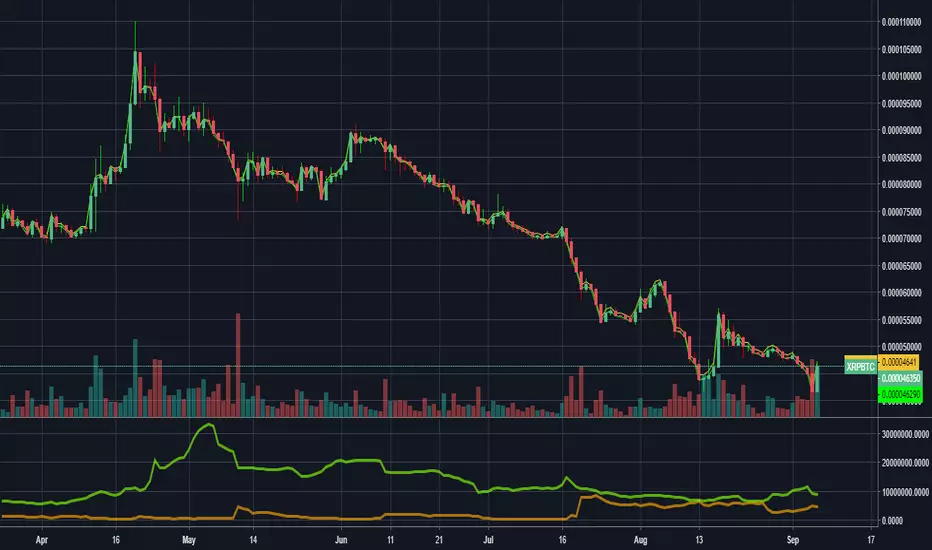
XRPBTCSHORTS XRPBTCLONGS - Bitfinex XRP Shorts & Longs// Created by titanlyy
// This script was inspired by @autemox who created the BTC version of this.
// Hope this helps. Peace out.
// 7th September 2018
XRPUSDSHORTS XRPUSDLONGS - Bitfinex XRP Shorts & Longs// Created by titanlyy
// This script was inspired by @autemox who created the BTC version of this.
// I was looking for an easy script to display XRP Longs vs Shorts, at the moment of publishing this indicator, XRPUSD Shorts are very near ATH
// Hope this helps. Peace out.
// 7th September 2018

Multi SMA EMA WMA HMA BB (5+5 MAs + Bollinger Bands) MTF by RRBMulti SMA EMA WMA HMA BB (5+5 Moving Averages of Any Type with Bollinger Bands) MTF by RagingRocketBull 2018
Version 1.0
This indicator shows multiple MAs of any type (SMA EMA WMA HMA etc) with BB and MTF support
There are several versions: Simple, MTF, Pro MTF and Ultimate MTF. This is the MTF version. The Differences are listed below. All versions have BB
- Simple: you have 2 groups of MAs that can be assigned any type (5+5)
- MTF: +assign 1 custom Timeframe to any group combo (5+5 Custom TF)
- Pro MTF: +multiple Timeframes for multiple MA groups (4*3 MTF), horizontal levels and show max bars back options
- Ultimate MTF: +individual settings for each MA, multiple Timeframes
There are 2 groups of MAs, 3rd group is BB. You can:
- show/hide all MAs in a group. Use length 0 to hide a particular MA independently or uncheck in Style.
- apply any MA type to all MAs in a particular MA group. For example, you can assign all EMAs the HMA type. Groups are called EMAs and SMAs just for reference.
- assign Custom Timeframe to a particular MA/BB group combination or all groups. For example, show daily (D) EMAs+SMAs on H1 Timeframe, or only H4 (240) BB on H1.
You can use different types of MAs as dynamic S/R levels to trade of off and MA crosses as signals for possible trend change (golden/death bull/bear crosses).
Current Timeframe MAs can be used together with Custom Timeframe MAs on a single chart. Higher TF MAs are more important than lower TF MAs.
Most common MA types are: SMA, EMA, WMA, HMA.
Most common MA lengths are: 12, 20, 26, 30, 50, 100, 200, 400 etc.
MTF Notes:
- Script UI uses simple timeframe textbox instead of input resolution dropdown to allow for 240 120 and other custom TFs
- Groups that are not assigned a Custom TF will use Current Timeframe (0).
- MTF will work for any MA type assigned to the group. BB group always uses SMA type.
- MTF works both ways: you can display a higher TF MA/BB on a lower TF or a lower TF MA/BB on a higher TF.
- MTF MA values are normally aligned at the boundary of their native timeframe. This produces stair stepping when a higher TF MA is viewed on a lower TF.
Therefore Point Density/Smoothing is applied by default on MA MTF for visual aesthetics. Set to 0 to disable and see exact ma mtf values (lines with stair stepping and original mtf alignment).
- Smoothing is disabled for BB MTF because fill doesn't work with smoothed MAs after duplicate values are replaced with na.
- MTF MA Value fluctuation is possible on the current bar due to default security lookahead
Features:
- 2 groups of custom 5+5 MAs of any type including Hull Moving Average (HMA)
- BB
- 1x Custom Timeframe with step line smoothing for 3 groups (MAs + BB)
1. based on 3EmaBB, uses plot, fill, security, change, barstate, stdev and custom hma functions
2. you can't set certain constants from input due to Pinescript limitations - change the code as needed, recompile and use as a private script version
3. you can't have plot* inside ?/if/for/function, and implementing condition forks using 2 sets of plots (na vs non-na) doubles indicator params and styles - confusing
4. swma has a fixed length = 4, alma and linreg have additional offset and smoothing params
Feel free to use. Good Luck!

Multi SMA EMA WMA HMA BB (5+5 MAs + Bollinger Bands) by RRB
Multi SMA EMA WMA HMA BB (5+5 Moving Averages of Any Type with Bollinger Bands) by RagingRocketBull 2018
Version 1.0
This indicator shows multiple MAs of any type (SMA EMA WMA HMA etc) with BB on a chart at the same time with/without MTF support depending on the version.
There are several versions (published later): Simple, MTF, Pro MTF and Ultimate MTF. This is the Simple version. The Differences are listed below. All versions have BB
- Simple: you have 2 groups of MAs that can be assigned any type (5+5)
- MTF: +assign 1 custom Timeframe to any group combo (5+5 Custom TF)
- Pro MTF: +multiple Timeframes for multiple MA groups (4*3 MTF), horizontal levels and show max bars back options
- Ultimate MTF: +individual settings for each MA, multiple Timeframes
You can use different types of MAs as dynamic S/R levels to trade of off and MA crosses as signals for possible trend change (golden/death bull/bear crosses).
Most common MA types are: SMA, EMA, WMA, HMA.
Most common MA lengths are: 12, 20, 26, 30, 50, 100, 200, 400 etc.
Features:
- 2 groups of custom 5+5 MAs of any type including Hull Moving Average (HMA)
- BB
1. based on 3EmaBB, uses plot, fill, stdev and custom hma functions
2. swma has a fixed length = 4, alma and linreg have additional offset and smoothing params
Feel free to use. Good Luck!


Bars In a Row Counter Pro by RRBBars In a Row Counter Pro by RagingRocketBull 2018
Version 1.0
This indicator counts bars of the same color in a sequence (dojis included) and plots the resulting counts as histogram bars
1. based on barssince, uses plot function with histogram style
2. Min/Max Threshold is the upper and lower limits for counting bars. For example, you can look only for sequences of 5 to 10 bars of the same color in a row
3. Show Histogram Beyond Threshold - you can hide/change color of the non-important histogram part that exceeds the threshold
4. Show Threshold Bands - show the upper and lower limits as levels on the indicator
5. Show Min/Max Bands - show ATH max red/green bars in a row historic levels on the indicator
6. Count Red Bars - count red bars in a sequence, show/hide red bars on a histogram (you can exclude red bars and count only green bars)
7. Count Green Bars - count green bars in a sequence, show/hide green bars on a histogram (you can exclude green bars and count only red bars)
8. Invert Red Bars - show red and green histograms together on the same axis above zero (saves space)
Feel free to use. Good Luck!

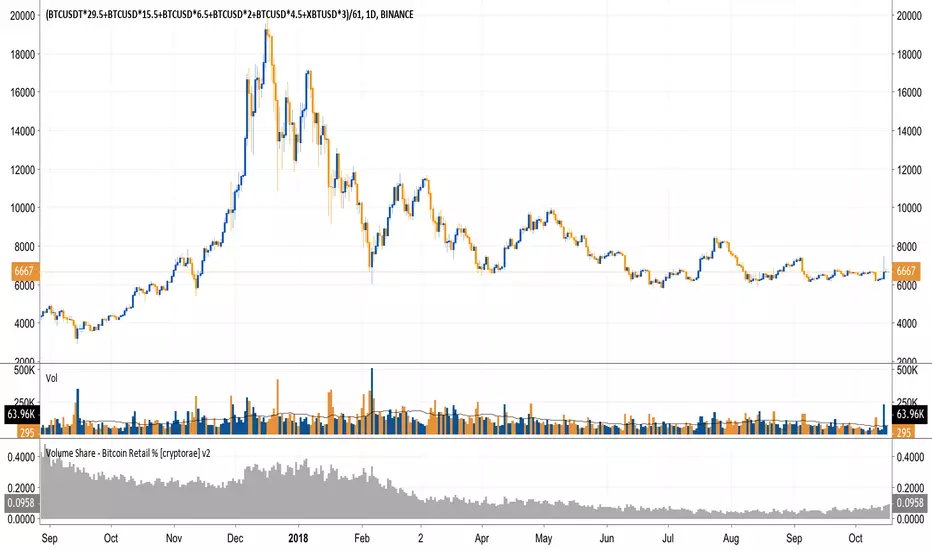
Volume Share - Bitcoin Retail % [cryptorae]I've been keeping my eyes on retail BTC trading volume as a % of total BTC trading volume (charted).
It's the single best chart showing the death of sentiment in this bear market. Retail fell to as low as 5.6% on 6/8. The good news is that the % has stabilized at these levels.
I think retail interest will need to trend higher in tandem with higher price moves for us to break through key resistance levels.
To know why, let's look closer at the anatomy of the recent bull and bear market.
In the 2017 bull market:
- Retail interest trended higher or sideways with each drive up
- Average retail volume share was ~46%
In other words, price movements were dominated by infusions of new money.
In the 2018 bear market:
- Retail interest trended LOWER with each recovery in price
- Average retail volume share was ~15%
In other words, price movements were dominated by money exchanging through the hands of traders.
Open thoughts:
- If the bear market persists and prices reach critical levels, I think that retail % would spike as some finally rush for the exit and new investors happily jump in
- If prices recover w/o a sustained increase in retail %, I'd not be so quick to call a bull market
Things I classify as "retail":
- Bitflyer
- Bithumb
- Coinbase
- Bistamp
- Kraken
Things classified as "non-retail"
- Bitmex
- Bitfinex
The formula is retail / (retail + non-retail)
The script is open for you to modify if you disagree. Let me know your thoughts/tweaks.
Crypto Market Change in BTC [Fingers]Crypto Market Change provides an indication of whether the value of a basket of 19 coins traded in BTC on Binance (as of July 12, 2018) are headed up or down. A simple moving average of the percentage change in BTC price for each coin is calculated. The moving averages are then summed and displayed. A measure of price volatility is indicated by standard deviation bands. Period, moving average length, and number of standard deviations are adjustable.

Crypto Market Change in BTC [Fingers]Crypto Market Change provides an indication of whether the value of a basket of 19 coins traded in BTC on Binance (as of July 12, 2018) are headed up or down. A simple moving average of the percentage change in BTC price for each coin is calculated. The moving averages are then summed and displayed. A measure of price volatility of indicated by standard deviation bands. Period, moving average length, and number of standard deviations are adjustable.

Crypto Market Change in USDT [Fingers]Crypto Market Change provides an indication of whether the value of a basket of 16 coins traded in USDT on Binance (as of July 12, 2018) are headed up or down. A simple moving average of the percentage change in USDT price for each coin is calculated. The moving averages are then summed and displayed. A measure of price volatility of indicated by standard deviation bands. Period, moving average length, and number of standard deviations are adjustable.

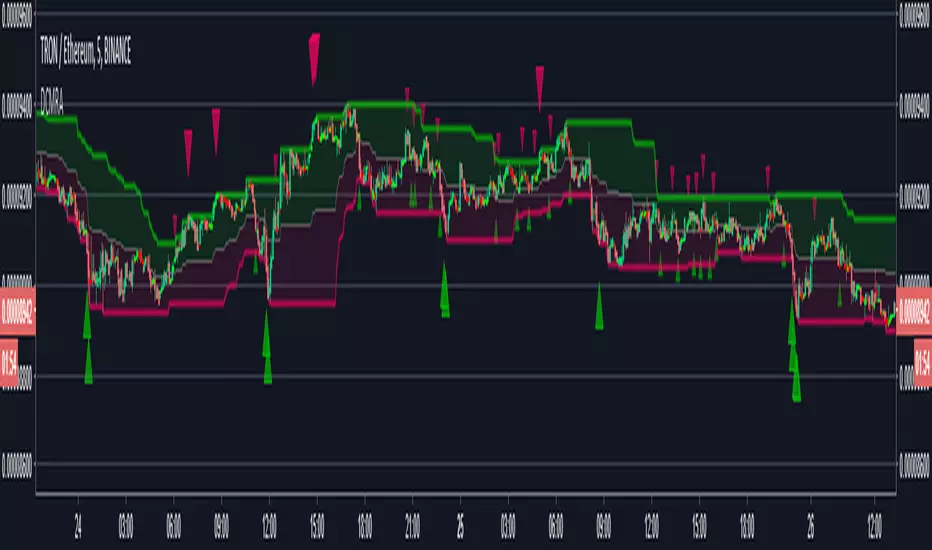
Donchian Mean Reversion AlertsDonchian Channels mean reversion signals/alerts with RSI filtering with signals applied to the mean, for strong trend situations.
Original Author: ChrisMoody
Modified Donchonian Channel with separate adjustments for upper and lower levels
Purpose is if you expect big move up, Use lower input example 3 or 4, and longer lower input, 40 - 100 and use lower input line as a stop out
Opposite if you expect big move down
Mid Line Rule in Long Example. If lower line is below entry take partial profits at Mid Line and move stop to Break even.
If Lower line moves above entry price before price retraces to midline use Lower line as Stop...Opposite if Shorting
Created by user ChrisMoody 1-30-2014
Updated 7-11-2018 by Dysrupt
Revamped for mean reversion strategy
Created midline alerts for strong trending upside buy signals/downside sell signals.
Added RSI Filtering
Added Alerts
Removed bar color change
Ehlers DSMA by Tim D.The Deviation-Scaled Moving Average from July 2018 TASC. "In “The Deviation-Scaled Moving Average” in this issue, author John Ehlers introduces a new adaptive moving average that has the ability to rapidly adapt to volatility in price movement. The author explains that due to its design, it has minimal lag yet is able to provide considerable smoothing."

Volume Factored Relative Strength Index (VFRSI)RSI is an indicator that is dependent only on price. I modified RSI to factor in volume as well. On BTC chart presented above, VFRSI is more accurate than RSI in detecting extreme conditions (green line is VFRSI). In some instances, it seems to be better than RSI in detecting divergences as well (scroll to March 2018).
In smaller time frames, it reduces the bart effect present on RSI without compromising responsiveness (unlike moving averages).
Features:
- Parameterized variables
- Includes regular RSI
- Includes an adjustable weight factor to reduce the effect of volume. At 0, it is identical to RSI.
PS: If you have seen a similar indicator, please let me know. Otherwise, this indicator has the potential to replace regular RSI.
Your feedback is very welcome :)
c|:D

Ice Yolo RSI Public//Created By ChrisMoody on 8/15/2014
//Uploaded By Iceberg on 6/13/2018
//This script allovvs you to set up to 3 different length RSI at the same time. I usually use tvvo.
//Chris removed his script and someone asked mine. I simplified a lot of lines.
//This script shovvs highlighted background vvhen your First RSI is in oversold or overbought zone, and flashes vvhen
//it crosses the lines. You can use it to check crossings or bounces of different lengths too.
//The settings highly depends on your Timeframe AND trading style. So make sure they match you as you like. I don't recommend using
//the default ones! Thanks for using, and thanks again Chris Moody!

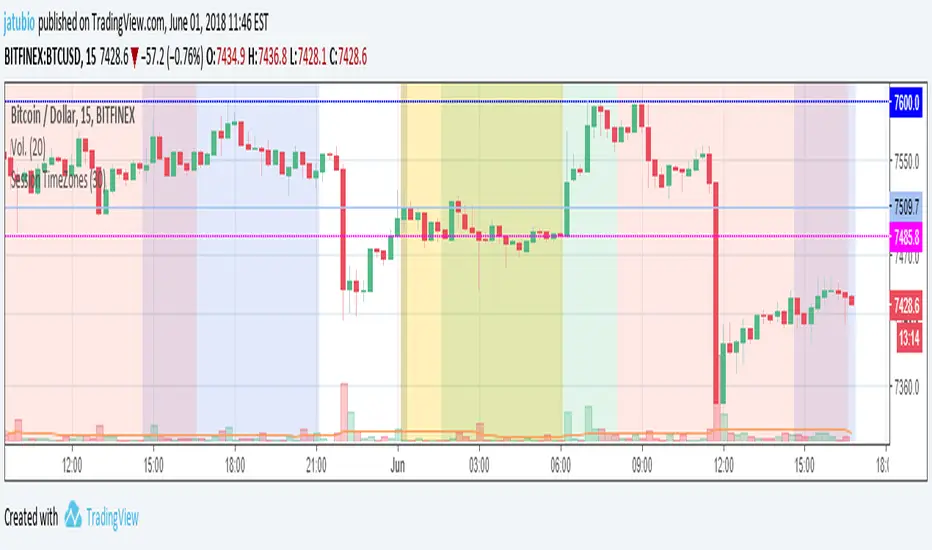
Custom Session TimeZonesThis indicators show background colours to identify world timezones
You can setup five custom zones.
You can also define time interval to show/hide
Can be used to know from what time of the world they are traders awake or
to search correlations between big moves and timezones hours.
Thanks to:
www.tradingcode.net
01/06/2018

Session TimeZonesThis indicators show background colours to identify world timezones
New York, London, Tokio, China and Sydney sessions
You can also setup timeframe intervals to show or hide.
Time Values based on UTC: ** YOU HAVE TO SETUP YOUR CHARTS TO 0-UTC TIMEZONE **
Values from: en.wikipedia.org
New York: UTC-5
Market Session: 09:30 - 16:00 (Local Time)
Market Session: 14:30 - 21:00 (UTC Based Time)
London: UTC
Market Session: 08:00 - 16:30 (Local Time)
Market Session: 08:00 - 16:30 (UTC Based Time)
Tokyo: UTC+9
Market Session: 09:00 - 15:00 (Local Time)
Market Session: 00:00 - 06:00 (UTC Based Time)
China: UTC+8
Market Session: 09:30 - 16:00 (Local Time)
Market Session: 01:30 - 08:00 (UTC Based Time)
Sydney: UTC+10
Market Session: 10:00 - 16:00 (Local Time)
Market Session: 00:00 - 06:00 (UTC Based Time)
Can be used to know from what time of the world they are traders awake or
to search correlations between big moves and timezones hours.
Thanks to:
www.tradingcode.net
01/06/2018

ORB_BHCH_CombinedPublished on 16/04/2018
Coded By Krishna Khanna (kkonline.org)
This Indicator is in use in NimblrTA
This indicator does the following
1) Plots the BH>50%CH candles with indications
2) Plots the EMA 5 21 and 55
3) Plots Gapup / Gapdown for identification
