Divergences: Price × RSI × OBV The Triple Confirmation Divergence indicator is a sophisticated momentum and volume-based tool designed to identify high-probability trend exhaustion points and potential reversals. It moves beyond traditional single-indicator divergence analysis by synthesizing signals from three core pillars of technical analysis: Price Action, Momentum, and Volume Flow.
This indicator works better on the time frames: 1H, 4H, 1D, 1W and 1M.
Cerca negli script per "纳斯达克指数期货cfd"

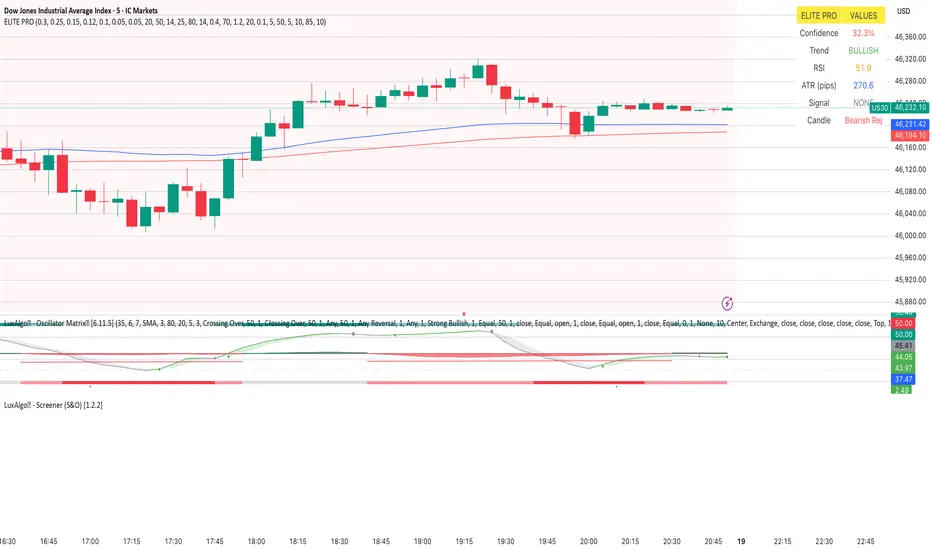
Elite_Pro_SignalsA sophisticated trading indicator that combines 8 powerful technical factors into a single confidence score to identify high-probability reversal signals.
8-Factor Confidence Scoring - Weighted analysis of multiple technical aspects
Smart Trend Alignment - Multi-timeframe EMA convergence
Advanced Pattern Recognition - Pin Bars, Engulfing, Inside Bars, Hammer/Shooting Star
Supply/Demand Zones - Automatic key level detection
Support/Resistance Confluence - Price action at significant levels
⚡ Smart Filters
Market Regime Detection - Avoid choppy/low-volatility conditions
Volume Confirmation - Ensure institutional participation
Liquidity Sweep Validation - Smart money movement detection
Candle Quality Filter - Eliminate false signals from tiny candles
🔧 How It Works
Confidence Scoring System (0-100%)
text
Wick Strength (30%) + Trend Alignment (25%) + Pattern Recognition (15%) +
Supply/Demand Zones (12%) + Support/Resistance (10%) + RSI Momentum (5%) +
Volume & Liquidity (5%)
Signal Generation
🟢 BUY Signals - Bullish rejection + Uptrend + High confidence
🔴 SELL Signals - Bearish rejection + Downtrend + High confidence
🎨 Visual Features
Clear Buy/Sell Arrows - Easy-to-spot signals
Confidence Background - Color-coded confidence levels
Info Table - Real-time metrics and analysis
Multi-Timeframe EMAs - Trend direction visualization
Professional Alerts - Real-time notifications
⚙️ Customization
Confidence Weights
Adjust the importance of each factor to match your trading style
Strategy Parameters
EMA periods (Fast: 20, Slow: 50)
RSI levels (Oversold: 25, Overbought: 80)
Minimum confidence threshold (70% recommended)
Advanced Filters
Volume multiplier settings
Liquidity sweep sensitivity
Market regime filters
Zone detection parameters
📈 Recommended Usage
Timeframes
Primary: 5-minute to 1-hour charts
Best Results: 15-minute with 1-hour trend alignment
Markets
Forex Pairs (EURUSD, GBPUSD, XAUUSD)
Indices (US30, NAS100, DE40)
Commodities (Gold, Oil)
Trading Sessions
London & New York overlap (Highest volatility)
Avoid Asian session (Low signal quality)
🔍 Signal Interpretation
High-Confidence Signals (80%+)
Strong trend alignment
Clear rejection patterns
Volume confirmation
Multiple confluence factors
Medium-Confidence Signals (60-80%)
Good setup but missing 1-2 factors
Requires additional confirmation
Low-Confidence Signals (<60%)
Avoid trading
Wait for better setups
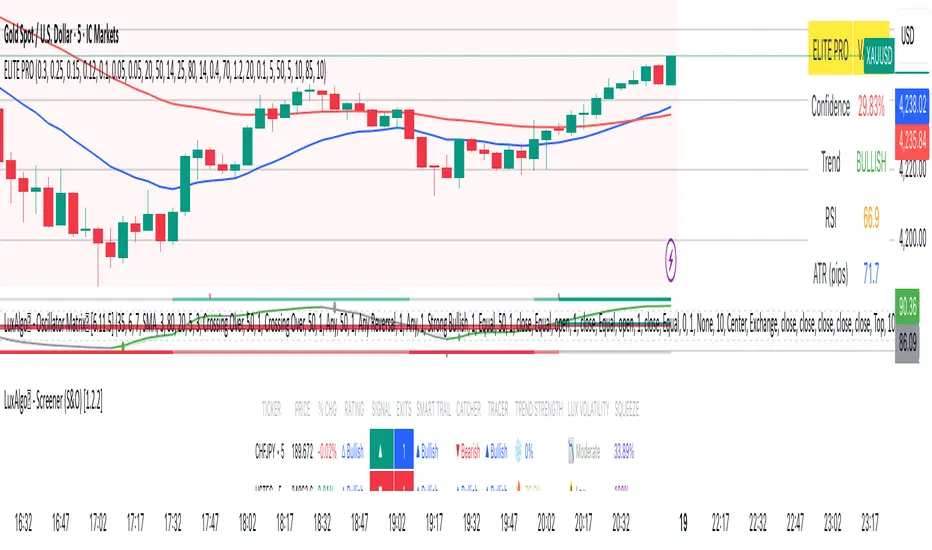
Elite_Pro SignalsTrial version to get the signals. used various indicators including candle pattern. Works on 5 min candle but checks multi time frames to see if it is inline with 15 min and 1 hr. Best works on Gold and Indices.
Triple EMA strategy by kingtraderthis strategy is purely based on moving everages, ema5, ema50 and ema200, avoid ranging market. in 1 mint your tp should 15-20pips, in 3mint tp should be 25pips, in 5mint tp should not above 50pips, in 15mints make tp 60 to 80 pips, in 30 mints tp 150 and 1h and h4 ur tp above 200pips, when target achieves have partial closing and keep ur trade breakeven. this indicator is for educational purpose only any loss by using this indicator, the author will not be responsible.
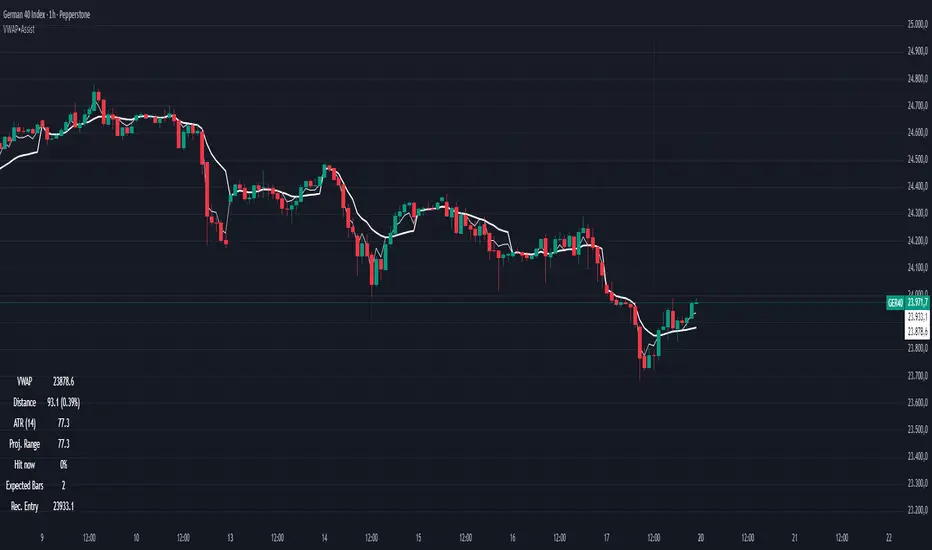
VWAP Entry Assistant (v1.0)Description:
Anchored VWAP with a lightweight assistant for VWAP reversion trades.
It shows the distance to VWAP, an estimated hit probability for the current bar, the expected number of bars to reach VWAP, and a recommended entry price.
If the chance of touching VWAP is low, the script suggests an adjusted limit using a fraction of ATR.
The VWAP line is white by default, and a compact summary table appears at the bottom-left.
Educational tool. Not financial advice. Not affiliated with TradingView or any exchange. Always backtest before use.
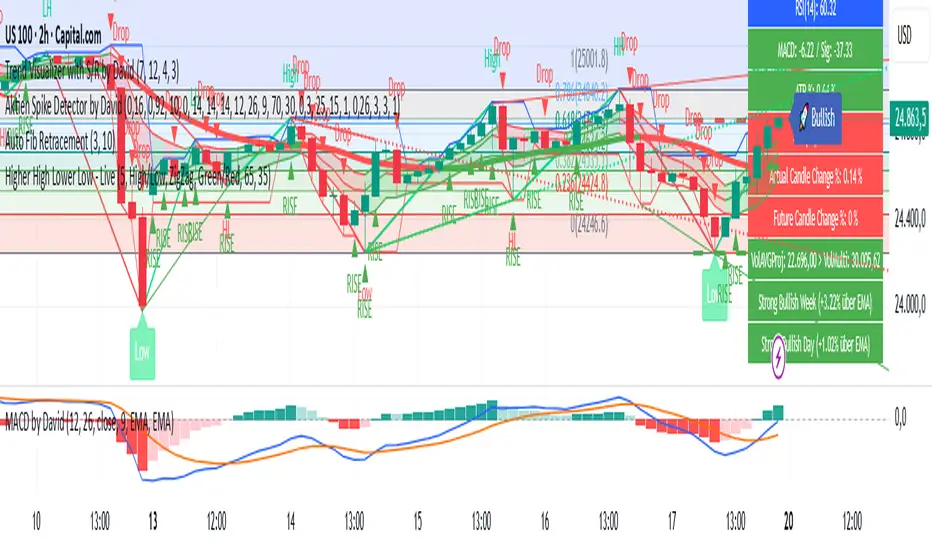
Aktien Spike Detector by DavidDescription:
This indicator marks the daily high and low on the chart and provides a visual and audible alert whenever the current price touches either of these levels. Additionally, the indicator highlights the candlestick that reaches the daily high or low to quickly identify significant market movements or potential reversal points.
Features:
📈 Daily high and low are automatically calculated and displayed as lines on the chart.
🔔 Alert notification when the price touches the daily high or low.
🕯️ Highlighting of the touch candlestick (e.g., color-coded) for better visual orientation.
💡 Ideal for traders trading breakouts, rejections, or intraday reversals.
Areas of application:
Perfect for day traders, scalpers, and intraday analysts who want to see precisely when the market reaches key daily levels.
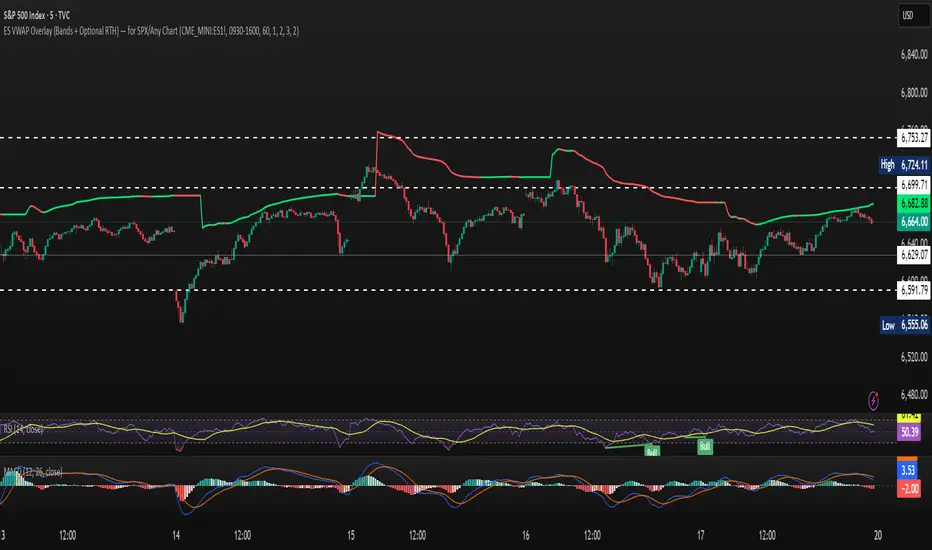
ES VWAP Overlay for SPX VWAP indicator for SPX. Since SPX does not have volume (index) it's using /es to mimic SPX volume. I find it good for day trading
Master Trend Strategy - by jake_thebossMaster Trend Strategy
This strategy combines multiple technical indicators to identify high-probability trend entries across all asset classes.
Core Signal Logic:
Entry triggered when EMA 4 crosses above/below EMA 5
Confirmation required from RSI (>50 for long, <50 for short)
Price must be above/below key moving averages: EMA 21, SMA 50, EMA 55, EMA 89, and EMA 750
Additional confirmation from Stochastic (>52 bullish, <48 bearish) or EMA 89 breakout or VWAP cross
Key Features:
VWAP filter: Only takes bullish signals above VWAP and bearish signals below VWAP
Optional pyramiding: Allows multiple entries in the same direction (up to 200 orders)
Individual stop loss and take profit management for each pyramid level
Time filter: Customizable trading hours with timezone offset
Risk management: Adjustable stop loss (default 0.3%) and take profit (default 0.6%)
Visualization:
Entry, stop loss, and take profit levels drawn as horizontal lines
Customizable signal markers (triangles) for bull/bear entries
Optional EMA overlay display
The strategy is designed for trend-following on lower timeframes, with strict multi-indicator confirmation to filter out false signals.

MACD + Supertrend + DEMA StrategySTRATEGY 📊 STRATEGY LOGIC:
Long Entry: When ALL of these occur simultaneously:
MACD histogram crosses above 0
Supertrend is bullish (green)
Short DEMA > Long DEMA
Short Entry: When ALL of these occur simultaneously:
MACD histogram crosses below 0
Supertrend is bearish (red)
Short DEMA < Long DEMA
Exits: Based on your TP/SL percentages from entry price
This follows the same clean structure as your MACD strategy but adds the alignment concept and proper risk management!

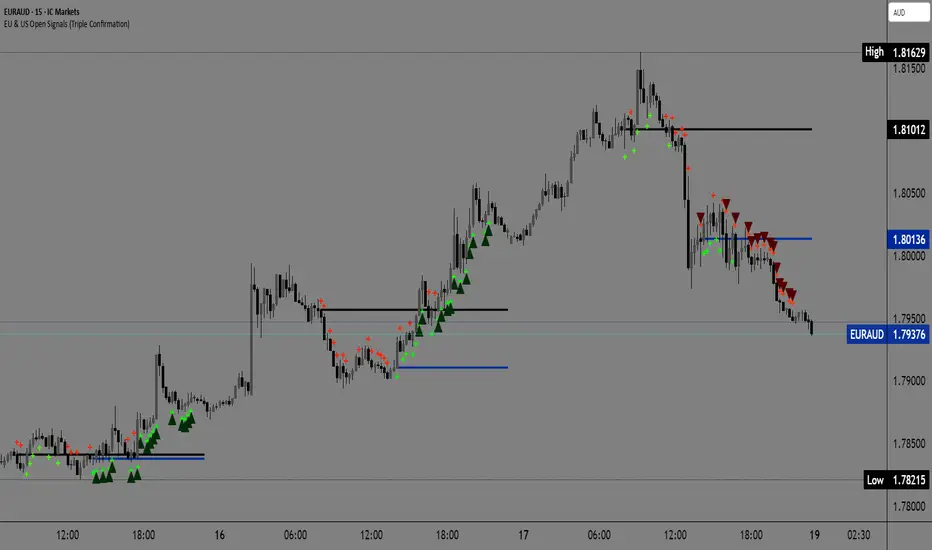
EU & US Open Signals (Triple Confirmation)🚀 EU & US Open Signals: Triple Confirmation Breakouts
💡 What This Indicator Does
This indicator plots the opening prices of the European (EU) and American (US) trading sessions as key daily support/resistance levels. Its main function is to generate three distinct levels of signals based on the breakout of these levels, strictly filtered by candlestick type.
The goal is to easily spot market momentum following the opening of the major trading sessions.
🔑 Key Features
1. Daily Session Levels
The indicator plots two crucial horizontal lines that reset daily:
EU Open (Black Line): The European session opening price (Default: 06:00 UTC).
US Open (Dark Blue Line): The American session opening price (Default: 12:00 UTC).
2. Triple Signaling Logic
All signals are only generated if the breakout candle is bullish (for Buy) or bearish (for Sell), and only within your set trading hours.
Logic I. EU Single Break
Condition: Close breaks above/below the EU Open Level + Bullish/Bearish candle.
Visual Plot: Small Cross (Green for Buy / Red for Sell).
Meaning: Early signal focused on EU session momentum.
Logic II. US Single Break
Condition: Close breaks above/below the US Open Level + Bullish/Bearish candle.
Visual Plot: Small Cross (Green for Buy / Red for Sell).
Meaning: Signal focused on US session momentum.
Logic III. Double Break (HIGH CONFIRMATION)
Condition: Close breaks above Both Levels (EU and US) for Buy, or below Both Levels for Sell + Bullish/Bearish candle.
Visual Plot: Large Triangle (Dark Green/Red).
⚠️ Crucial: This is the strongest signal, indicating strong momentum as both key daily levels have been broken.
⚙️ Simple Settings
Easily customize the indicator to fit your strategy:
EU/US Session Open Hour (UTC): Set the exact session open times.
Time Zone: Select your time zone for accurate level calculation.
Start/End Trading Hour: Define the daily window for when signals will be active.
🎯 Recommended Use
High Confidence: Focus on the Double Break (Logic III) - Large Triangle for your most confirmed entries.
Context: Use the Single Break signals (I and II) to confirm early market bias.
Risk: The Open Levels can serve as natural points for setting Stop-Loss orders.
Disclaimer: Trading carries risk. This tool is for analysis purposes only. Use it at your own discretion.
Khusan Pullback & Mean-Reversion (Manual ADX, Clean)Description
The indicator combines two logics in one tool:
Trend Pullback: Entries in the direction of the dominant trend after a short-term pullback to the EMA.
Return to the mean (Mean-Reversal): countertrend trades from external Bollinger bands with an RSI filter.
Key Features
Manual ADX (Wilder calculation): more precisely, it controls the strength of the trend without hidden smoothing.
There is a clear separation of market modes: the background of the chart highlights the condition: trend up/down or sideways (range).
Signal tags: Long TPB / Short TPB for pullbacks in the trend, Long MR / Short MR for a return to the average.
A minimum of “noise": neat colors, clear captions, without unnecessary graphics.
How to read signals
Trend Pullback
Long TPB — ADX ≥ threshold, price returns above fast EMA, RSI > 45.
Short TPB — ADX ≥ threshold, price goes below fast EMA, RSI < 55.
Mean-Reversion
Long MR — sideways (ADX < threshold), price below lower BB, RSI < 30, confirmation of reversal.
Short MR — sideways (ADX < threshold), price above upper BB, RSI > 70, reversal confirmation.
Parameters (Inputs)
EMA fast / EMA slow — fast and slow EMA (default 20/50).
ADX length / threshold — period and trend strength threshold.
BB length / mult — period and Bollinger Bands multiplier.
RSI length — RSI period.
Show labels/background — enable mode signatures and highlighting.
Recommendations for use
Timeframes: from M15 to H4. On lower TF, add a filter by the higher trend (e.g. H1/H4 EMA).
Instruments: XAUUSD, FX majors, indices, liquid futures and crypto pairs.
Risk management: for TPB, use SL behind the local swing extremum/below the EMA zone; for MR, use SL behind the external BB.
Filters: avoid entering against strong news; prioritize MR when volatility is low, and TPB when volatility is high.
Alerts
Create standard alerts based on the appearance of Long/Short TPB and Long/Short MR labels — the indicator provides clear conditions for auto-entry/notifications.
Important
The indicator is not

EMA 3 Lines✅ JP
1つのインジケーター枠内に3本のEMA(短期・中期・長期)を表示します。
初期設定では 8(青)/50(赤)/200(緑)の期間が適用されます。
設定画面から期間・ラインカラー・太さを自由にカスタマイズできます。
✅ EN
This indicator displays three EMAs (short-term, mid-term, and long-term) within a single indicator window.
By default, the EMA periods are set to 8 (blue), 50 (red), and 200 (green).
You can freely customize the EMA lengths, line colors, and line thickness from the settings panel.

EMA 8/50/200I set it up so that three EMAs are displayed within a single indicator window.
このスクリプトでは、3本のEMA(8間・50期間・200期間)を1つのインジケータ枠で表示しています。

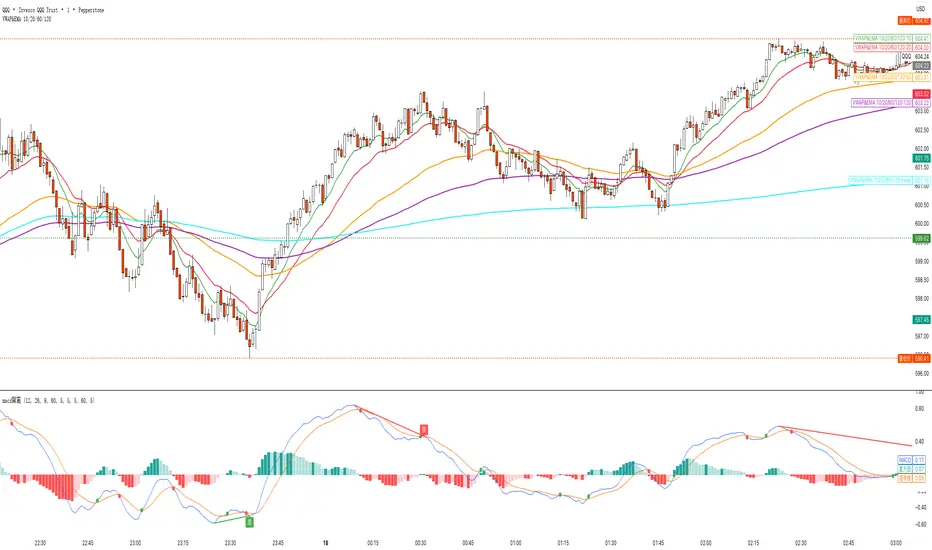
VWAP&EMA 10/20/60/120his script is a clean and straightforward technical analysis tool designed to provide traders with a clear view of market trends and key price levels by overlaying five essential moving averages onto your chart:
Volume Weighted Average Price (VWAP)
Four (4) Exponential Moving Averages (EMAs) at lengths 10, 20, 60, and 120.
By combining these indicators, traders can quickly assess short-term momentum, medium-term trends, and long-term direction, all while referencing the volume-weighted average price as a key benchmark for institutional activity.
Features & Components
This indicator plots five distinct lines on your chart, each color-coded for easy identification:
VWAP (Volume Weighted Average Price)
Plot: Plotted as a bright blue line.
Purpose: The VWAP represents the true average price of an asset for the day (or session), weighted by volume. It is a critical level for many day traders and institutions.
Prices above VWAP are often considered bullish.
Prices below VWAP are often considered bearish.
It frequently acts as a dynamic level of support or resistance.
EMA 10 (Short-Term Momentum)
Plot: Plotted as a green line.
Purpose: This is the fastest-moving average, reflecting the most recent price action and short-term momentum.
EMA 20 (Short-Term Trend)
Plot: Plotted as a red line.
Purpose: Often used in conjunction with the EMA 10, this average helps confirm the immediate trend. Crossovers between the 10 and 20 EMAs can signal potential entry or exit points.
EMA 60 (Medium-Term Trend)
Plot: Plotted as an orange line.
Purpose: This average provides a clearer picture of the medium-term trend, filtering out much of the short-term noise. It often serves as a significant dynamic support or resistance level.
EMA 120 (Long-Term Trend)
Plot: Plotted as a purple line.
Purpose: This is the slowest-moving average in the script, defining the major underlying trend. As long as the price remains above the EMA 120, the long-term bias is generally considered bullish, and vice-versa.
How to Use This Indicator
This indicator is versatile and can be adapted to various trading strategies:
Trend Confirmation: Use the alignment of the EMAs to determine the trend.
Strong Bullish Trend: Price > EMA 10 > EMA 20 > EMA 60 > EMA 120.
Strong Bearish Trend: Price < EMA 10 < EMA 20 < EMA 60 < EMA 120.
Dynamic Support & Resistance: Watch how the price reacts to each of the five lines. In an uptrend, the EMAs and VWAP will often act as "bounces" or support levels for pullbacks. In a downtrend, they will act as resistance.
Entry & Exit Signals (Crossovers):
A bullish crossover (e.g., EMA 10 crossing above EMA 20) can signal buying interest.
A bearish crossover (e.g., EMA 10 crossing below EMA 20) can signal selling pressure.
VWAP Confluence: Pay special attention to areas where an EMA (like the 20 or 60) crosses or travels close to the VWAP. This "confluence" can create a very strong and significant price level. For example, if the price pulls back to the VWAP and also finds support at the EMA 60, it can be a high-probability trade setup.
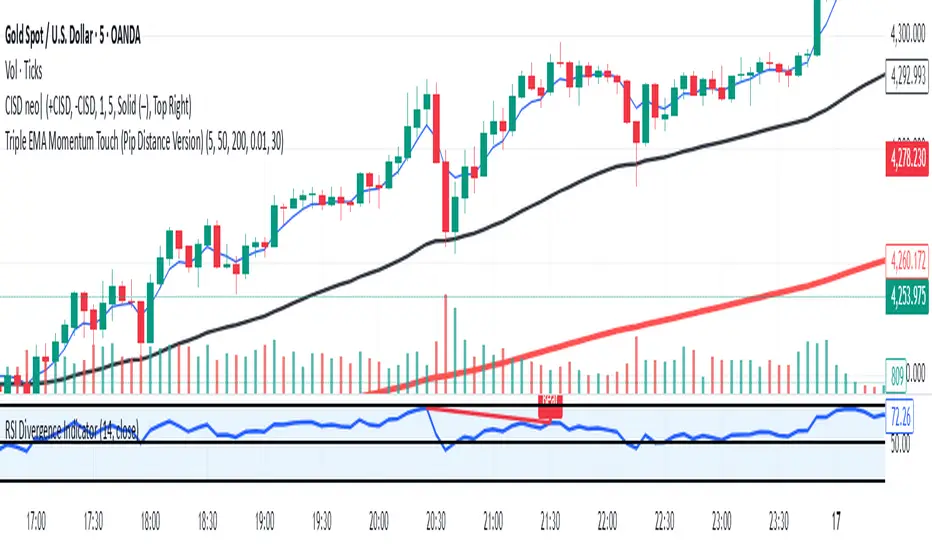
G_GMMA• Comprehensive GMMA Visualization: It plots six fast EMAs and six slow EMAs, clearly distinguishing short term and long term trends. The indicator fills the space between the fastest and slowest EMAs in each group, turning the moving averages into easily identifiable ribbons rather than a mass of overlapping lines.
• Customizable Appearance: Users can adjust the colors of the fast and slow EMA lines, the fill colors of each ribbon, and the overall line thickness. This makes it easy to tailor the chart to personal preferences or trading templates.
• Dynamic Background Shading: The script can shade the chart’s background depending on whether the fast ribbon is above or below the slow ribbon, giving a quick visual cue for trend direction (uptrend vs. downtrend).
• Touch Alert System: Up to three different EMA lengths can be monitored for “touch” events. When price touches a selected EMA (e.g., 20 , 50 or 200 period EMA), the indicator triggers an alert condition and plots a small circle on the chart at the contact point. This helps traders catch precise entry or exit signals without staring at the screen.
• Flexible Input: Both fast and slow EMA lengths, colors, and alert parameters are user adjustable from the indicator’s settings. This allows the same script to be used on different instruments (e.g., Gold, forex pairs) and time frames by simply changing the period values.
• Trend Sensitive Support/Resistance: By treating the slow EMA ribbon as a dynamic support/resistance zone, the indicator helps traders identify where price is likely to stall or reverse. Combining this with the touch alerts makes it well suited for scalping or intraday trades.

byquan AlphaTrend + Supertrend Combo🔍 Overview
The AlphaTrend + SuperTrend Combo is a smart confirmation-based trading indicator that blends two powerful trend-following systems — AlphaTrend and SuperTrend — into one unified tool.
Its main purpose is to filter out false breakouts and improve entry accuracy by waiting for both indicators to confirm a signal within a specified number of candles.
This combination gives traders high-confidence BUY and SELL signals, clearly marked on the chart, with optional alert notifications.
⚙️ How It Works
🧠 1. AlphaTrend Logic
The AlphaTrend component calculates dynamic support and resistance bands based on Average True Range (ATR) and Money Flow Index (MFI) or RSI (if no volume data).
It identifies momentum shifts using:
upT = Lower ATR band
downT = Upper ATR band
Depending on whether the MFI (or RSI) is above or below 50, AlphaTrend adapts to bullish or bearish conditions.
Signals:
✅ Buy Signal → When AlphaTrend crosses above its past level (momentum turning up).
❌ Sell Signal → When AlphaTrend crosses below its past level (momentum turning down).
📈 2. SuperTrend Logic
The SuperTrend indicator uses ATR to track trend direction based on price and volatility.
A green SuperTrend implies a bullish trend.
A red SuperTrend implies a bearish trend.
It triggers signals when trend direction changes:
✅ SuperTrend Buy → Price breaks above the SuperTrend line.
❌ SuperTrend Sell → Price drops below the SuperTrend line.
Users can choose whether to use the standard ATR or a smoothed ATR version for calculation (changeATR option).
🔄 3. Combo Confirmation Logic
The indicator’s core strength is signal confirmation.
When one indicator (AlphaTrend or SuperTrend) gives a signal, it waits for the other to confirm within a certain number of candles — defined by the “Wait Bars” input.
Example:
AlphaTrend gives a Buy → within the next 3 candles, if SuperTrend also turns bullish → confirmed BUY.
SuperTrend gives a Sell → within the next 3 candles, if AlphaTrend confirms → confirmed SELL.
This filtering greatly reduces false signals caused by volatility or short-term noise.
🧭 Inputs & Settings
Parameter Description
Wait Bars Number of candles to wait for confirmation from the other indicator.
Show Labels Toggle visibility of BUY/SELL labels on chart.
AlphaTrend Multiplier / Period / Source Adjusts AlphaTrend’s sensitivity.
Use RSI (no volume) If true, replaces MFI with RSI for instruments without volume data (e.g., crypto indexes).
SuperTrend ATR Period / Multiplier Controls SuperTrend sensitivity and reactivity.
Use Standard ATR? If disabled, uses smoothed ATR instead.
SuperTrend Source Usually hl2, but can be customized.
📊 Signals & Visualization
🟢 BUY Label: Both indicators confirm an uptrend.
🔴 SELL Label: Both indicators confirm a downtrend.
Labels appear directly on the chart (abovebar for SELL, belowbar for BUY).
Alerts are automatically triggered for both confirmed directions.
🔔 Alerts
Two alert conditions are built in:
"Combo BUY: AlphaTrend + SuperTrend confirmed!"
"Combo SELL: AlphaTrend + SuperTrend confirmed!"
You can use these in TradingView’s alert system to receive push notifications or email alerts.
💡 Trading Tips
✅ Works best on trending markets (crypto, forex, stocks).
✅ Use on 15m–4h timeframes for optimal balance between speed and reliability.
✅ Combine with volume or higher timeframe trend filters for stronger entries.
✅ Adjust Wait Bars (2–5) depending on volatility.
⚖️ Summary
The AlphaTrend + SuperTrend Combo helps traders trade confidently by requiring dual confirmation before signaling a trade.
Key Features:
Combines two proven trend systems.
Reduces false entries through confirmation logic.
Visual BUY/SELL markers.
Built-in alerts for both signals.
Customizable sensitivity and timeframe adaptability.
🎯 Trade only when AlphaTrend and SuperTrend agree — let the market confirm your direction.
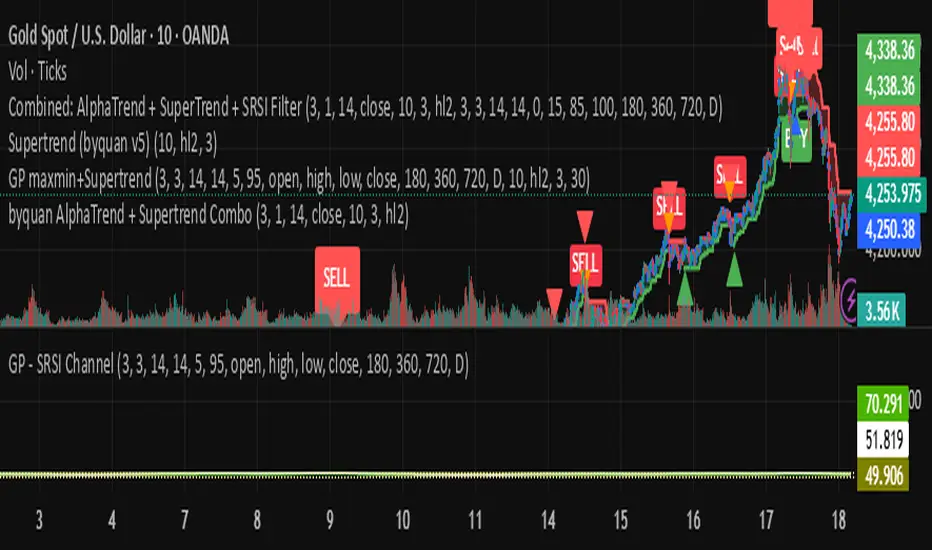
byquan GP - SRSI Channel🔍 What Is It?
The GP – SRSI Channel is a momentum-based oscillator that measures the relative strength of price movements across multiple timeframes using the Stochastic RSI (SRSI) method.
Instead of using a single RSI line, this indicator analyzes four price inputs and four timeframes to create a dynamic channel that reflects the true market momentum — helping traders identify overbought and oversold zones with higher accuracy.
⚙️ How It Works
The indicator combines multiple layers of analysis to produce a smooth and reliable momentum channel.
1. Multi-Source RSI Calculation
It computes RSI and Stochastic RSI values for four different price sources:
Open
High
Low
Close
Each source generates its own SRSI value:
dsopen, dshigh, dslow, and dsclose
From these, it extracts:
starraymin: the lowest (most oversold) SRSI value
starraymax: the highest (most overbought) SRSI value
This forms a momentum range based on all price inputs.
2. Multi-Timeframe (MTF) Integration
To strengthen signal reliability, it repeats this SRSI analysis across four higher timeframes (configurable by user):
Parameter Default Value Meaning
Time 1 180 minutes 3-hour chart
Time 2 360 minutes 6-hour chart
Time 3 720 minutes 12-hour chart
Time 4 1D Daily chart
Each timeframe produces its own set of minimum, maximum, and close SRSI values.
These are then combined and normalized to a 0–100 scale.
3. Normalization and Channel Plot
The combined results create three main lines:
Min Line (Green–Red gradient) → represents oversold strength
Max Line (Green–Red gradient) → represents overbought strength
Close Line (White) → represents average SRSI value
The area between the Min and Max lines is filled with a color gradient to form the SRSI Channel, visually showing momentum strength and range.
4. Signal & Alerts
Two alert levels are defined:
Alert Min Level → Default = 5 (oversold)
Alert Max Level → Default = 95 (overbought)
When:
oranmin ≤ Alert Min Level → Market is in an oversold state (potential reversal up).
oranmax ≥ Alert Max Level → Market is in an overbought state (potential reversal down).
When either of these thresholds is crossed, the indicator triggers:
A white square marker on the chart.
A custom alert with the message:
“SRSI Channel reached alert threshold (oranmax ≥ MaxLevel or oranmin ≤ MinLevel)”
🧭 How to Use It
🪄 Step 1 — Add to Chart
Copy the code into a new Pine Script in TradingView.
Click Add to chart.
You’ll see three lines and a colored channel between them.
⚙️ Step 2 — Adjust Inputs
Core SRSI Settings
Setting Description
K, D Smoothing factors for Stochastic RSI.
RSI Length Number of bars for RSI calculation.
S Length Period used for %K in Stochastic RSI.
Alert Min/Max Level Defines oversold/overbought zones.
Multi-Timeframe Settings
Change Time 1 to Time 4 to suit your trading style:
Shorter timeframes → faster but more noise.
Longer timeframes → smoother, more reliable momentum.
📈 Step 3 — Interpret the Chart
Indicator Element Meaning
🟩 Lower Boundary (Min) Lowest SRSI reading → momentum weakness / possible rebound area
🟥 Upper Boundary (Max) Highest SRSI reading → strong momentum / possible exhaustion
⚪ Middle Line (Close) Average of all SRSI readings → overall momentum strength
🌈 Channel Fill Visualizes balance between overbought and oversold levels
When the channel widens → market volatility and strength increase.
When it narrows → consolidation or low-momentum phase.
🔔 Step 4 — Alerts
You can create alerts using:
Condition: SRSI Extreme
Message: SRSI Channel reached alert threshold
Use this to receive notifications when the market hits extreme momentum levels (great for reversal traders).
💡 Trading Tips
✅ Combine with Supertrend, MACD, or Moving Averages for confirmation.
✅ Look for SRSI extremes aligning with price support/resistance for stronger reversal entries.
✅ Use different timeframe combinations (e.g., 1H–4H–12H–1D) depending on your trading style.
✅ Treat it as a momentum filter — not a direct buy/sell signal tool.
⚖️ Summary
The GP – SRSI Channel is a sophisticated multi-timeframe momentum indicator that helps traders visualize market strength and identify overbought or oversold conditions with exceptional clarity.
Features:
4 price sources × 4 timeframes = deep momentum insight
Dynamic, color-coded SRSI channel
Built-in alert system for extreme conditions
Clean and intuitive visual design
Best suited for:
Swing and position traders
Traders who use RSI/Stoch indicators
Those seeking to confirm entries with multi-timeframe momentum data
🎯 Understand the market’s true momentum — before it moves.
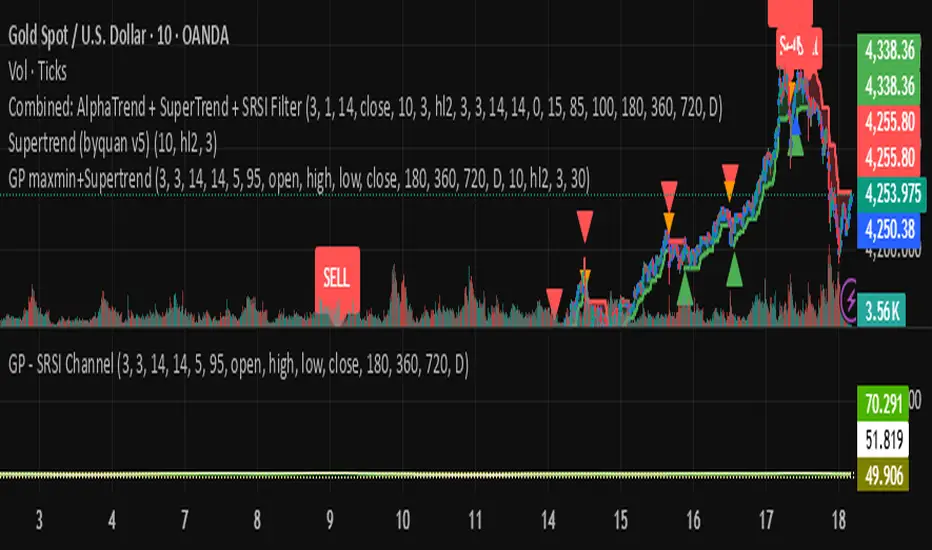
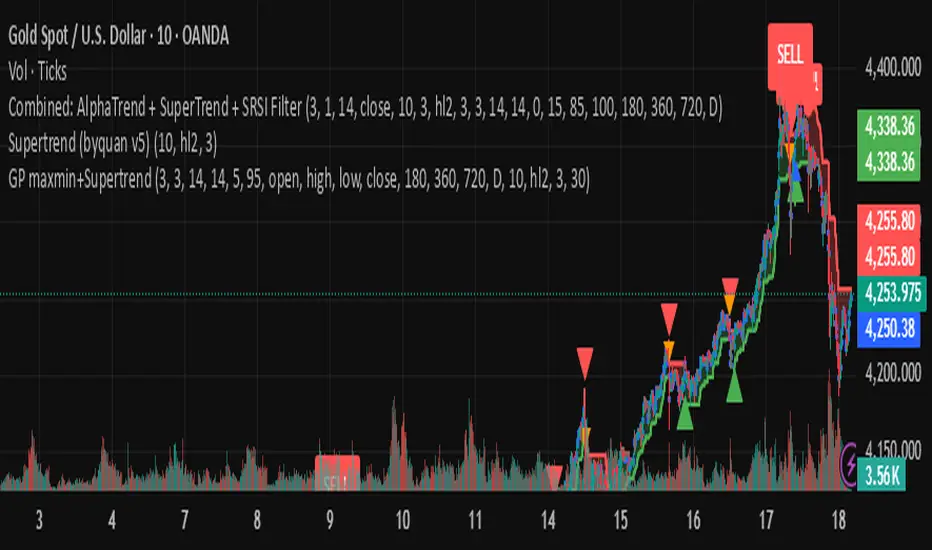
byquan GP maxmin+Supertrend🔍 Overview
The GP MaxMin + Supertrend indicator is an advanced trend-following tool that combines the power of the Supertrend indicator with a multi-timeframe Stochastic RSI (SRSI) filter.
It aims to generate high-confidence buy and sell signals by confirming Supertrend breakouts only when the market’s momentum (based on SRSI) supports them.
In other words:
Supertrend gives you trend direction,
and SRSI ensures you only trade when the market is ready to move.
⚙️ How It Works
The indicator operates in three main layers:
1. SRSI Channel Analysis
It calculates Stochastic RSI values on four price sources:
Open
High
Low
Close
From these, it extracts both minimum (oversold) and maximum (overbought) SRSI readings.
To make the signal more robust, the script collects SRSI data from four different timeframes:
3 hours (180 minutes)
6 hours (360 minutes)
12 hours (720 minutes)
1 day
These multi-timeframe readings are averaged and normalized between 0 and 100.
Key thresholds:
Below 5 → Oversold zone (potential BUY zone)
Above 95 → Overbought zone (potential SELL zone)
2. Supertrend Core
The indicator uses a standard Supertrend logic:
ATR Period: 10
ATR Multiplier: 3.0
It dynamically plots the Supertrend line that shifts between bullish and bearish zones.
When the price crosses the Supertrend line, a trend change is detected:
From bearish to bullish → Buy signal
From bullish to bearish → Sell signal
3. SRSI-Based Signal Filtering
To avoid false breakouts, the Supertrend signals are filtered through the SRSI logic.
Here’s how it works:
When the market becomes oversold, the script records that event.
If a Supertrend Buy signal appears within a certain number of bars (default = 30) after that oversold event → the signal is validated.
The same applies for Sell signals after an overbought event.
This creates a smart “confirmation window,” ensuring that only those Supertrend signals that align with market momentum are displayed.
🧭 How to Use It
✅ Step 1: Add to Your Chart
Copy and paste the script into a new Pine Script editor window in TradingView, then click “Add to chart.”
✅ Step 2: Configure Parameters
SRSI Settings
K, D, RSI Length, S Length: Standard SRSI parameters.
Alert Min Level and Alert Max Level: Define overbought/oversold zones (default 5 and 95).
Timeframes: You can adjust the four MTF levels if you want faster or slower momentum confirmation.
Supertrend Settings
ATR Period: A higher value smooths the trend.
ATR Multiplier: Controls signal sensitivity (lower = more signals, higher = fewer).
Filter Settings
Signal Filter Window: Defines how long after an overbought/oversold event a Supertrend signal remains valid (default = 30 bars).
✅ Step 3: Interpret Signals
Signal Type Condition Interpretation
Buy Supertrend flips to bullish and SRSI was recently oversold Start of an uptrend
Sell Supertrend flips to bearish and SRSI was recently overbought Start of a downtrend
Each signal is marked on the chart:
🟢 Green “Buy” label → potential long entry
🔴 Red “Sell” label → potential short entry
You can also enable or disable background highlighting to visually track bullish/bearish zones.
✅ Step 4: Set Alerts
You can create alerts using the built-in alert condition:
SRSI-Filtered SuperTrend Signal Triggered!
This triggers whenever a filtered Buy or Sell signal appears.
💡 Trading Tips
Combine this indicator with price action or volume confirmation for best results.
Adjust the filter window to fit your preferred timeframe (short-term vs swing trading).
Avoid trading against higher-timeframe Supertrend direction.
⚖️ Advantages
✅ Filters out false Supertrend signals
✅ Uses multi-timeframe momentum confirmation
✅ Clean visual layout with clear entry markers
✅ Supports alerts for automation or notifications
⚠️ Limitations
⚠️ The indicator is computationally heavy due to multi-timeframe requests.
⚠️ It’s a confirmation tool — not a standalone strategy.
⚠️ Results depend on correct parameter tuning for your market and timeframe.
📈 Summary
The GP MaxMin + Supertrend is a hybrid indicator that blends trend detection with momentum filtering.
It helps traders:
Avoid false breakouts
Enter trades at better timing
Stay aligned with both trend and momentum
Perfect for swing traders, crypto traders, and anyone who wants cleaner Supertrend signals with deeper confirmation logic.
ICT PDA - Gold & BTC (QuickScalp Bias/FVG/OB/OTE + Alerts)What this script does
This indicator implements a complete ICT Price Delivery Algorithm (PDA) workflow tailored for XAUUSD and BTCUSD. It combines HTF bias, OTE zones, Fair Value Gaps, Order Blocks, micro-BOS confirmation, and liquidity references into a single, cohesive tool with early and final alerts. The script is not a mashup for cosmetic plotting; each component feeds the next decision step.
Why this is original/useful
Symbol-aware impulse filter: A dynamic displacement threshold kTune adapts to Gold/BTC volatility (body/ATR vs. per-symbol factor), reducing noise on fast markets without hiding signals.
Scalping preset: “Quick Clean” mode limits drawings to the most recent bars and keeps only the latest FVG/OB zones for a clear chart.
Three display modes: Full, Clean, and Signals-Only to match analysis vs. execution.
Actionable alerts: Early heads-up when price enters OTE in the HTF bias direction, and Final alerts once mitigation + micro-break confirm the setup.
How it works (high-level logic)
HTF Bias: Uses request.security() on a user-selected timeframe (e.g., 240m) and EMA filter. Bias = close above/below HTF EMA.
Dealing Range & OTE: Recent swing high/low (pivot length configurable) define the range; OTE (62–79%) boxes are drawn contextually for up/down ranges.
Displacement: A candle’s body/ATR must exceed kTune and break short-term structure (displacement up/down).
FVG: 3-bar imbalance (bull: low > high ; bear: high < low ). Latest gaps are tracked and extended.
Order Blocks: Last opposite candle prior to a qualifying displacement that breaks recent highs/lows; zones are drawn and extended.
Entry & Alerts:
Long: Bullish bias + price inside buy-OTE + mitigation of a bullish FVG or OB + micro BOS up → “PDA Long (Final)”.
Short: Bearish bias + price inside sell-OTE + mitigation of a bearish FVG or OB + micro BOS down → “PDA Short (Final)”.
Early Alerts: Trigger as soon as price enters OTE in the direction of the active bias.
Inputs & controls (key ones)
Bias (HTF): timeframe minutes, EMA length.
Structure: ATR length, Impulse Threshold (Body/ATR), swing pivot length, OB look-back.
OTE/FVG/OB/LP toggles: show/hide components.
Auto-Tune: per-symbol factors for Gold/BTC + manual tweak.
Display/Performance: View Mode, keep-N latest FVG/OB, limit drawings to last N bars.
Recommended usage (scalping)
Timeframes: Execute on M1–M5 with HTF bias from 120–240m.
Defaults (starting point): ATR=14, Impulse Threshold≈1.6; Gold factor≈1.05, BTC factor≈0.90; Keep FVG/OB=2; last 200–300 bars; View Mode=Clean.
Workflow: Wait for OTE in bias direction → see mitigation (FVG/OB) → confirm with micro BOS → manage risk to nearest liquidity (prev-day H/L or recent swing).
Alerts available
“PDA Early Long/Short”
“PDA Long (Final)” / “PDA Short (Final)”
Attach alerts on “Any alert() function call” or the listed conditions.
Chart & screenshots
Please include symbol and timeframe on screenshots. The on-chart HUD shows the script name and state to help reviewers understand context.
Limitations / notes
This is a discretionary framework. Signals can cluster during news or extreme volatility; use your own risk management. No guarantee of profitability.
Changelog (brief)
v1.2 QuickScalp: added Quick Clean preset, safer array handling, symbol-aware impulse tuning, display modes.
------------------------------
ملخص عربي:
المؤشر يطبق تسلسل PDA عملي للذهب والبتكوين: تحيز من فريم أعلى، مناطق OTE، فجوات FVG، بلوكات أوامر OB، وتأكيد micro-BOS، مع تنبيهات مبكرة ونهائية. تمت إضافة وضع “Quick Clean” لتقليل العناصر على الشارت وحساسية إزاحة تتكيّف مع الأصل. للاستخدام كسكالب: نفّذ على M1–M5 مع تحيز 120–240 دقيقة، وابدأ من الإعدادات المقترحة بالأعلى. هذا إطار سلوكي وليس توصية مالية.

Multi-Timeframe Stochastic (4x Konfiguracja + Schodki)Skrypt stoch z wielu TF można sobie ustawiać pod siebie.


Full Currency Strength Table Dashboard (8 Currencies)
# Full Currency Strength Table Dashboard (8 Currencies) 📊
This indicator provides a **simplified, visual representation of the current relative strengths of 8 major global currencies** (EUR, USD, GBP, JPY, AUD, NZD, CAD, CHF). It's designed as a minimalist dashboard that appears discreetly on your chart, giving traders a quick and clear picture of forex pair movements.
The indicator calculates the relative strength of each currency based on its movement against the other 7 currencies in the panel, providing insight into which currencies are currently the strongest and which are the weakest.
## Key Features 🌟
* **Simplified Visualization:** Instead of showing currency strength as a line on the chart, which can often be distracting, the indicator uses a **data table (dashboard)** positioned on the chart. This ensures **maximum chart visibility** and cleanliness.
* **8 Major Currencies:** All major currencies are included ($A$ - EUR, $B$ - USD, $C$ - GBP, $D$ - JPY, $E$ - AUD, $F$ - NZD, $G$ - CAD, $H$ - CHF), allowing strength calculation based on **28 base currency pairs**.
* **Strength Calculation:** Strength is calculated based on the average percentage change $\left(\frac{\text{Close} - \text{Open}}{\text{Open}} \times 100\right)$ of the currency relative to all 7 other currencies.
* **Timeframe Setting:** Users can select a **higher timeframe (TF)** (e.g., Daily - 'D') for the strength calculation. This allows analysis of longer-term currency strength momentum, independent of the chart's current timeframe.
* **Customizable Design:** You can adjust the table's position, text size, the colour of each currency, and the resolution (length) of the strength meter.
## How to Use the Indicator (Interpretation) 💡
1. **Select a Timeframe (TF):** It's recommended to use a higher TF (e.g., Daily - 'D' or 4h - '240') to get more stable currency strength signals.
2. **The Dashboard Table:** The table displays:
* The currency name (bottom, with its corresponding colour).
* The numerical strength value (top, expressed in points or average change).
* The **Strength Meter (bar)** visually represents the currency's relative strength compared to the other currencies on the panel (calculated based on the Min/Max values across all 8 currencies).
3. **Making Decisions:**
* **Buy:** Look for a currency pair where the **Base Currency** is significantly **strong** (high positive value, long meter) and the **Quote Currency** is significantly **weak** (high negative value, short meter).
* **Sell:** Look for a currency pair where the **Base Currency** is significantly **weak** and the **Quote Currency** is significantly **strong**.
* **Avoid Trading:** Avoid pairs where both currencies have roughly the same strength or are close to zero.
## Note on Calculation and Code 🛠️
* **Base Pairs:** The script calculates 28 base currency pairs (e.g., EURUSD, EURGBP... CADCHF) using the `request.security` function to retrieve data from the selected timeframe (`freq`).
* **Data Correction:** A correction was implemented in the code by adding ` ` after `request.security` to always use the **CLOSED bar values** from the higher TF. This **eliminates NaN (Not a Number) data** that would appear when using the current bar.
* **Accumulation:** Accumulation (`sumA, sumB...`) only occurs when the selected higher TF changes (`timeframe.change(freq)`), effectively tracking the currency's relative strength during the formation of **one closed bar** on that higher TF.
### License
This work is licensed under the **Attribution-NonCommercial-ShareAlike 4.0 International (CC BY-NC-SA 4.0)** license.
The original concept and code are based on the work of the **LuxAlgo** team and finalized to fix syntax errors and handle NaN data for stable use with 8 currencies.
---
**Questions or suggestions?** I'd love to hear your feedback in the comments! Happy trading! 📈
