EventsLibrary "Events"
events()
Returns the list of dates supported by this library as a string array.
Returns: array : Names of events supported by this library
fomcMeetings()
Gets the FOMC Meeting Dates. The FOMC meets eight times a year to determine the course of monetary policy. The FOMC announces its decision on the federal funds rate at the conclusion of each meeting and also issues a statement that provides information on the economic outlook and the Committee's assessment of the risks to the outlook.
Returns: array : FOMC Meeting Dates as timestamps
fomcMinutes()
Gets the FOMC Meeting Minutes Dates. The FOMC Minutes are released three weeks after each FOMC meeting. The Minutes provide information on the Committee's deliberations and decisions at the meeting.
Returns: array : FOMC Meeting Minutes Dates as timestamps
ppiReleases()
Gets the Producer Price Index (PPI) Dates. The Producer Price Index (PPI) measures the average change over time in the selling prices received by domestic producers for their output. The PPI is a leading indicator of CPI, and CPI is a leading indicator of inflation.
Returns: array : PPI Dates as timestamps
cpiReleases()
Gets the Consumer Price Index (CPI) Rekease Dates. The Consumer Price Index (CPI) measures changes in the price level of a market basket of consumer goods and services purchased by households. The CPI is a leading indicator of inflation.
Returns: array : CPI Dates as timestamps
csiReleases()
Gets the CSI release dates. The Consumer Sentiment Index (CSI) is a survey of consumer attitudes about the economy and their personal finances. The CSI is a leading indicator of consumer spending.
Returns: array : CSI Dates as timestamps
cciReleases()
Gets the CCI release dates. The Conference Board's Consumer Confidence Index (CCI) is a survey of consumer attitudes about the economy and their personal finances. The CCI is a leading indicator of consumer spending.
Returns: array : CCI Dates as timestamps
nfpReleases()
Gets the NFP release dates. Nonfarm payrolls is an employment report released monthly by the Bureau of Labor Statistics (BLS) that measures the change in the number of employed people in the United States.
Returns: array : NFP Dates as timestamps
eciReleases()
Gets the ECI The Employment Cost Index (ECI) is a measure of the change in the cost of labor,
Cerca negli script per "美国cpi公布时间"

SH_LibraryLibrary "SH_Library"
events()
Returns the list of dates supported by this library as a string array.
Returns: array : Names of events supported by this library
fomcMeetings()
Gets the FOMC Meeting Dates. The FOMC meets eight times a year to determine the course of monetary policy. The FOMC announces its decision on the federal funds rate at the conclusion of each meeting and also issues a statement that provides information on the economic outlook and the Committee's assessment of the risks to the outlook.
Returns: array : FOMC Meeting Dates as timestamps
fomcMinutes()
Gets the FOMC Meeting Minutes Dates. The FOMC Minutes are released three weeks after each FOMC meeting. The Minutes provide information on the Committee's deliberations and decisions at the meeting.
Returns: array : FOMC Meeting Minutes Dates as timestamps
ppiReleases()
Gets the Producer Price Index (PPI) Dates. The Producer Price Index (PPI) measures the average change over time in the selling prices received by domestic producers for their output. The PPI is a leading indicator of CPI, and CPI is a leading indicator of inflation.
Returns: array : PPI Dates as timestamps
cpiReleases()
Gets the Consumer Price Index (CPI) Rekease Dates. The Consumer Price Index (CPI) measures changes in the price level of a market basket of consumer goods and services purchased by households. The CPI is a leading indicator of inflation.
Returns: array : CPI Dates as timestamps
csiReleases()
Gets the CSI release dates. The Consumer Sentiment Index (CSI) is a survey of consumer attitudes about the economy and their personal finances. The CSI is a leading indicator of consumer spending.
Returns: array : CSI Dates as timestamps
cciReleases()
Gets the CCI release dates. The Conference Board's Consumer Confidence Index (CCI) is a survey of consumer attitudes about the economy and their personal finances. The CCI is a leading indicator of consumer spending.
Returns: array : CCI Dates as timestamps
nfpReleases()
Gets the NFP release dates. Nonfarm payrolls is an employment report released monthly by the Bureau of Labor Statistics (BLS) that measures the change in the number of employed people in the United States.
Returns: array : NFP Dates as timestamps
eciReleases()
Gets the ECI The Employment Cost Index (ECI) is a measure of the change in the cost of labor,

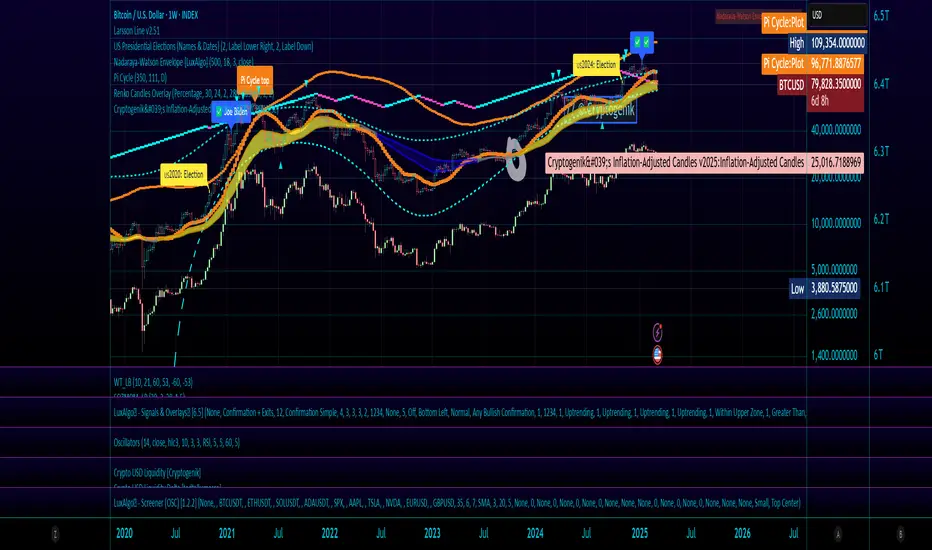
Cryptogenik's Inflation-Adjusted Candles v2025Inflation-Adjusted Price Indicator by Cryptogenik
This indicator adjusts price data for inflation, allowing you to visualize how stock/asset prices would look with constant purchasing power. By using Consumer Price Index (CPI) data from FRED, it transforms nominal prices into inflation-adjusted values that reflect real-world purchasing power.
What This Indicator Does
The Inflation-Adjusted Price indicator converts traditional price charts to show what prices would be if the purchasing power of currency remained constant. This is essential for long-term analysis, as it removes the distortion caused by inflation when comparing prices across different time periods.
Key Features
Displays inflation-adjusted price candles alongside original prices
Uses official CPI data from the Federal Reserve (FRED:CPIAUCSL)
Allows easy comparison between nominal and real prices
Helps identify true price movements by filtering out the effects of inflation
Perfect for long-term investors and macroeconomic analysis
How To Use It
Apply the indicator to any chart
Green/red candles show the inflation-adjusted prices
Gray line shows the original unadjusted price
The information label displays the current CPI value
This indicator is particularly valuable for analyzing stocks, commodities, and other assets over periods of 5+ years, where inflation effects become significant. It helps answer the question: "Has this asset truly increased in value, or is the price increase just reflecting inflation?"
Technical Details
The indicator calculates adjusted prices using the formula: (price / CPI) * 100, which effectively shows prices as a percentage of current purchasing power. This approach normalizes all prices to a consistent standard, making historical comparisons more meaningful.
Cryptogenik's Inflation-Adjusted Candles v2025
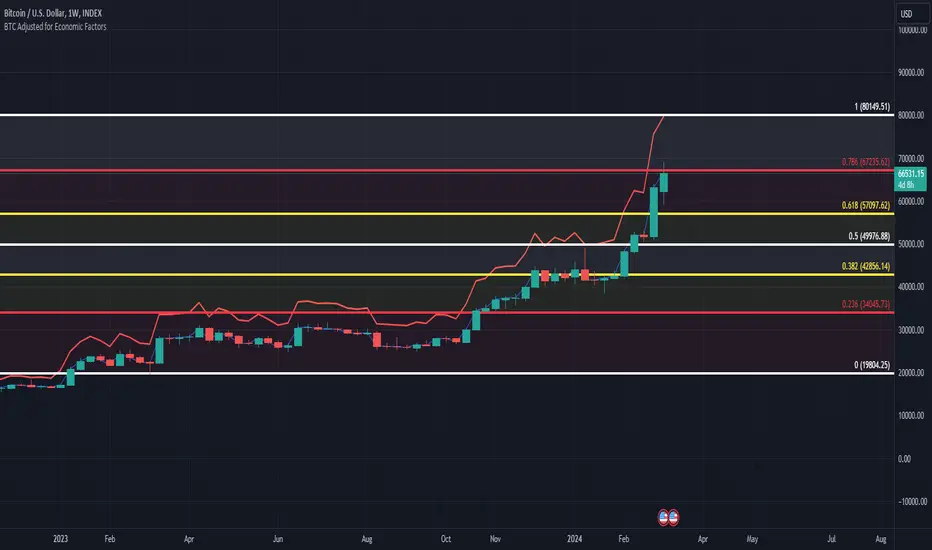
BTC/USD Inflation priced in! ~Period 2009 - 2023 (by TAS)The script creates a custom indicator titled "BTC Adjusted for Economic Factors.
Adjusted BTC Price is plotted in red, making it more prominent. The adjusted price is Bitcoin's historical closing prices adjusted for cumulative inflation over time, based on the Core Consumer Price Index (CPI) annual inflation rates from 2009 onwards.
The script calculates the adjusted price of Bitcoin by taking into account the effect of inflation on its value. It uses annual CPI rates for each year from 2009 to 2022 to calculate a cumulative inflation factor. The script assumes a placeholder inflation rate of 2.5% for 2023, indicating that this value should be updated when the actual rate is available. The script suggests adding CPI rates for additional years as they become available to maintain the accuracy of the adjustment.
Here's a breakdown of how the script works:
Core CPI Annual Inflation Rates: It starts by defining the annual inflation rates for each year from 2009 to 2022, expressed as a percentage divided by 100 to convert to a decimal.
Cumulative Inflation Calculation: The script calculates cumulative inflation starting from the year 2009 up to the current year. For each year that has passed since 2009, it multiplies the cumulative inflation factor by (1 + cpiRate), where cpiRate is the inflation rate for that year. This effectively compounds the inflation rate over time.
Adjusting Bitcoin's Price: The script then adjusts Bitcoin's closing price (close) for the calculated cumulative inflation to get the adjusted price (adjustedPrice).
Plotting the Prices: Finally, it plots both the original and the adjusted Bitcoin prices on the chart, allowing users to visually compare how inflation has theoretically impacted Bitcoin's value over time.
--------------------------------------------------------------------------------------------------
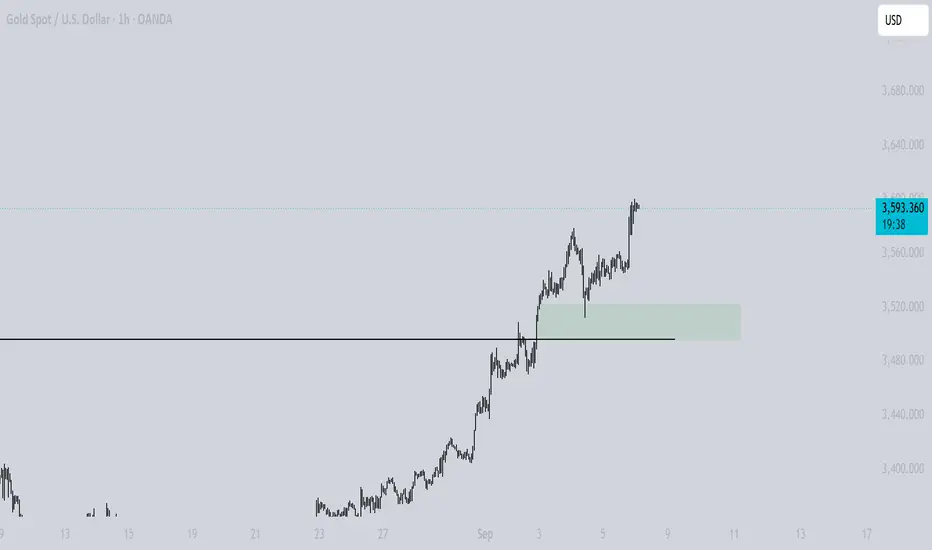
Important to notice, Fib. Retracements from the 2017 cycle top to the recent top (¬80K) doesn't look invalidated.
--------------------------------------------------------------------------------------------------
Inputs and feedback are welcome!
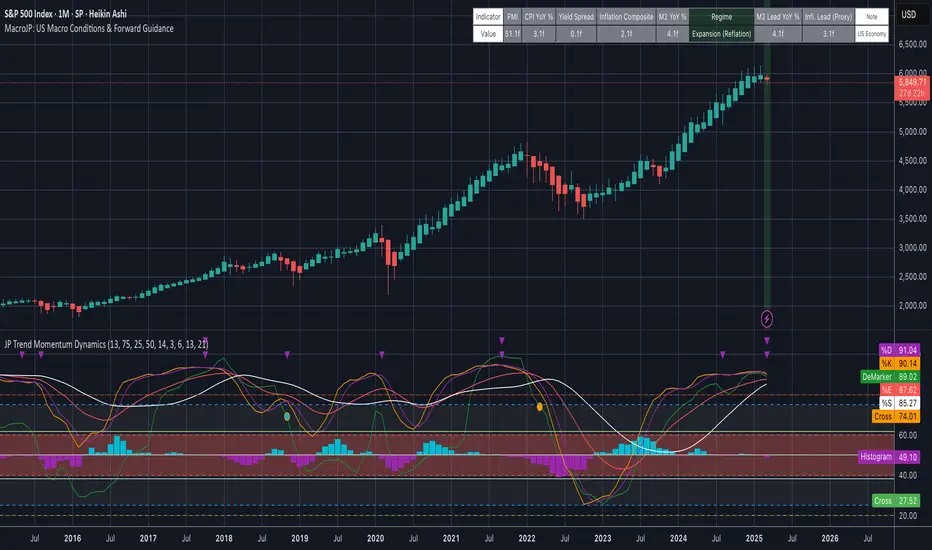
MacroJP: US Macro Conditions & Forward GuidanceMacroJP is a comprehensive, free-to-use TradingView indicator designed to provide a clear snapshot of the US macroeconomic environment. It consolidates key economic metrics into a single, interactive dashboard, allowing traders and investors to quickly assess current conditions and adjust their portfolio biases accordingly.
How It Works:
• Data Aggregation:
The indicator pulls monthly data from reputable free economic sources—specifically, ISM Manufacturing PMI, US CPI YoY, US M2 Money Supply, and US Treasury yields (10-year and 2-year). This robust dataset forms the backbone of the analysis.
• Composite Calculations:
By calculating a Composite Inflation Indicator (the average of CPI YoY and the yield spread) and evaluating the year-over-year change in M2, MacroJP gauges both the inflationary pressures and liquidity trends in the economy. These composite metrics offer a nuanced view that goes beyond single-indicator analysis.
Regime Classification:
The core strength of MacroJP lies in its quadrant classification system. It categorises the macro environment into four distinct regimes based on the direction of economic growth (derived from PMI) and inflation (from the Composite Inflation Indicator):
• Expansion (Reflation): Indicative of a recovering economy with rising production and moderate inflation—ideal for a bullish equity bias.
• Stagflation Risk: A scenario of weak growth coupled with high inflation, where a defensive posture is recommended.
• Slowdown (Deflationary): Characterised by contracting economic activity and falling prices, suggesting a move towards cash or high-quality bonds.
• Disinflationary Boom: Reflects strong growth with stable or falling inflation—an optimal environment for equities with some bond diversification.
Forward Guidance:
To enhance its predictive capability, MacroJP incorporates leading indicators by shifting key data points. For instance, it uses a forward-shifted M2 YoY value and a one-month shifted CPI proxy to offer insights into near-term trends. This approach helps in anticipating changes, providing a sort of “forward guidance” that can inform strategic asset allocation.
User Education:
The indicator features an intuitive table with on-hover tooltips that explain each metric, its relevance, and recommended investment biases. This educational layer is designed to empower users to not only monitor the economic pulse but also to understand the ‘why’ behind each reading, making it a valuable tool for both novice and experienced investors.
MacroJP brings clarity to complex macroeconomic dynamics, allowing users to make more informed decisions in volatile markets. Its seamless integration of free public data and detailed on-chart annotations makes it an indispensable tool for anyone looking to understand the broader economic context impacting their investments.
— Jaroslav
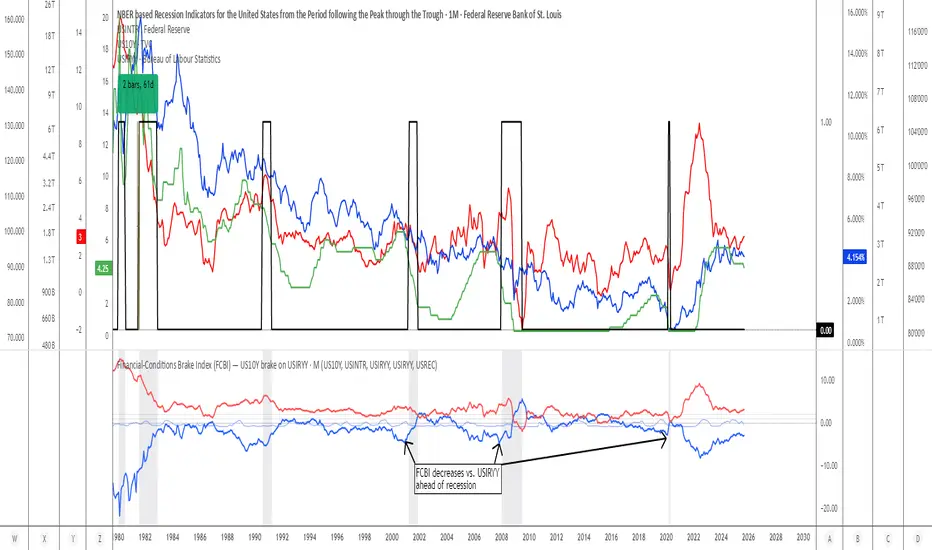
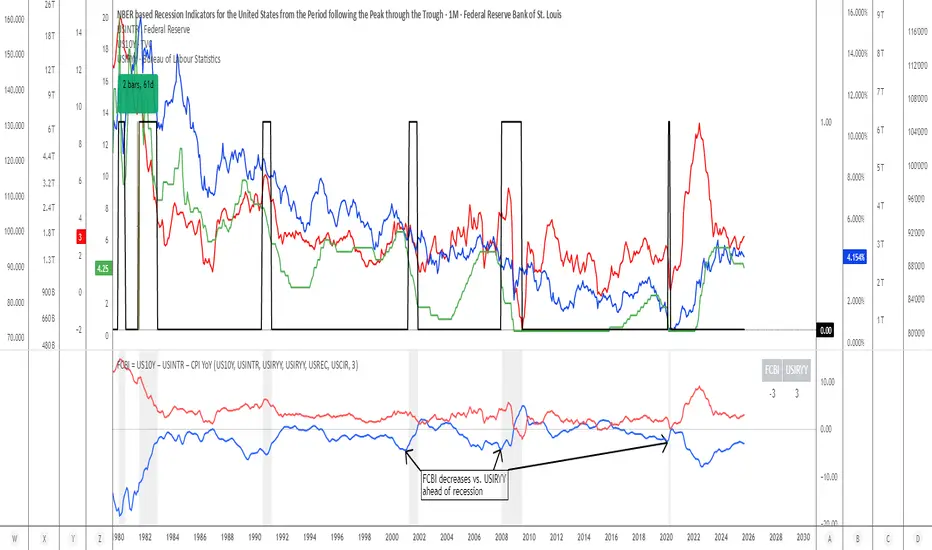
Financial-Conditions Brake Index (FCBI) — US10Y brake on USIRYYFinancial-Conditions Brake Index (FCBI) – US10Y Brake on USIRYY
Concept
The Financial-Conditions Brake Index (FCBI) measures how U.S. long-term yields (US10Y) interact with the Federal Funds Rate (USINTR) and inflation (CPI YoY) to shape real-rate conditions (USIRYY).
It visualizes whether the bond market is tightening or loosening overall financial conditions relative to the Federal Reserve’s policy stance.
Formula
FCBI = (US10Y) − (USINTR) − (CPI YoY)
How It Works
The FCBI expresses the difference between the long-term yield curve and short-term policy rates, adjusted for inflation. It shows whether the long end of the curve is amplifying or counteracting the Fed’s stance.
FCBI > +2 → Strong brake → Long yields remain elevated despite easing → tight conditions → recession delayed.
FCBI +1 to +2 → Mild brake → Financial transmission slower; lag ≈ 12–18 months.
FCBI 0 to +1 → Neutral → Typical early post-cut environment.
FCBI < 0 → Accelerator → Long yields and inflation expectations falling → liquidity flows freely → recession often follows within 6–14 months.
How to Read the Chart
Blue line (FCBI) shows the strength of the financial brake.
Red line (USIRYY) represents the real yield baseline.
Recession shading (gray) marks NBER recessions for comparison.
FCBI < USIRYY → Brake engaged → financial conditions tighter than real-rate baseline.
FCBI > USIRYY → Brake released → long end easing faster than policy → liquidity surge → late-cycle setup.
Historically, U.S. recessions begin on average about 14 months after the first Fed rate cut, and a decline of the FCBI below zero often precedes that window.
Practical Use
Use the FCBI to identify when policy transmission is blocked (brake engaged) or flowing (brake released).
Cross-check with yield-curve inversions, Fed policy shifts, and inflation expectations to estimate macro timing windows.
Current Example (Oct 2025)
FCBI ≈ −3.1, USIRYY ≈ +3.0 → Brake still engaged.
Once FCBI rises above USIRYY and crosses positive, it signals the “brake released” phase — historically the final liquidity surge before a U.S. recession.
Summary
FCBI shows how tight the brake is.
USIRYY shows how fast the car is moving.
When FCBI rises above USIRYY, the brake is released — liquidity accelerates and the historical recession countdown begins.
Signal Stack MeterWhat it is
A lightweight “go or no‑go” meter that combines your manual read of Structure, Location, and Momentum with automatic context from volatility and macro timing. It surfaces a single, tradeable answer on the chart: OK to engage or Standby.
Why traders like it
You keep your discretion and nuance, and the meter adds guardrails. It prevents good trade ideas from being executed in the wrong conditions.
What it measures
Manual buckets you set each day: Structure, Location, Momentum from 0 to 2
Volatility from VIX, term structure, ATR 5 over 60, and session gaps
Time windows for CPI, NFP, and FOMC with ET inputs and an exchange‑offset
Total score and a simple gate: threshold plus a “strong bucket” rule you choose
How to use in 30 seconds
Pick a preset for your market.
Set Structure, Location, Momentum to 0, 1, or 2.
Leave defaults for the auto metrics while you get a feel.
Read the header. When it says OK to engage, you have both your read and the context.
Defaults we recommend
OK threshold: 5
Strong bucket rule: Either Structure or Location equals 2
VIX triggers: 22 and 1.25× the 20‑SMA
Term mode: Diff at 0.00 tolerance. Ratio mode at 1.00+ is available
ATR 5/60 defense: 1.25. Offense cue: 0.85 or lower
ATR smoothing: 1
Gap mode: RTH with 0.60× ATR5 wild gap. ON wild range at 0.80× ATR5
CPI window 08:25 to 08:40 ET. FOMC window 13:50 to 14:30 ET
ET to exchange offset: −60 for CME index futures. Set to 0 for NYSE symbols like SPY
Alert cadence: Once per RTH session. Snooze first 30 minutes optional
New since the last description
Parity with Defense Mode for presets, sessions, ratio vs diff term mode, ATR smoothing, RTH‑key cadence, and snooze options
Event windows in ET with a simple offset to your exchange time
Alternate row backgrounds and full color control for readability
Exposed series for automation: EngageOK(1=yes) plus TotalScore
Debug toggle to see ATR ratio, term, and gap measurements directly
Notes
Dynamic alerts require “Any alert() function call”.
The meter is designed to sit opposite Defense Mode on the chart. Use the position input to avoid overlap.

Boomerang Trading Indicator# Boomerang News Trading Indicator
## Overview
The Boomerang Trading Indicator is designed to identify potential reversal opportunities following major economic news releases. This indicator analyzes the initial market reaction to news events and provides visual cues for potential counter-trend trading opportunities based on Fibonacci retracement levels.
## How It Works
### News Event Detection
- Automatically detects major news release times (NFP, CPI, FOMC, etc.)
- Analyzes the first significant price movement following news releases
- Requires minimum candle size threshold to filter out weak reactions
### First Move Analysis
The indicator employs multiple analytical methods to determine the initial market direction:
**Simple Analysis (High Confidence):**
- When the news candle has ≥70% body-to-total ratio, uses straightforward bullish/bearish classification
**Advanced Analysis (Complex Cases):**
- Volume-weighted direction analysis
- Momentum and wick pattern analysis
- Market structure and gap analysis
- Weighted voting system combining all methods
### Entry Signal Generation
Based on the "boomerang" concept where markets often reverse after initial news reactions:
**For Bullish First Moves (Price Up Initially):**
- Generates SHORT entry signals when price retraces to 1.25-1.5 Fibonacci levels
- Visual: Red triangles above price bars
**For Bearish First Moves (Price Down Initially):**
- Generates LONG entry signals when price retraces to -0.25 to -0.5 Fibonacci levels
- Visual: Green triangles below price bars
## Key Features
### Visual Elements
- **Fibonacci Levels**: Displays key retracement levels based on the initial reaction range
- **Entry Zones**: Clear visual marking of optimal entry areas
- **Direction Arrows**: Shows the initial market reaction direction
- **Target Levels**: Displays profit target zones at 50% and 100% retracement levels
### Information Panel
Real-time display showing:
- Current setup status
- First move direction and body percentage
- Recommended trade direction
- Key price levels (reaction high/low)
- Profit targets with historical success rates
### Alert System
- Pre-news warnings (customizable timing)
- News event notifications
- Setup activation alerts
- Entry signal notifications
### Success Tracking
- Visual "BOOM!" animations when targets are hit
- Target 1 (50% level): ~95% historical success rate
- Target 2 (Main target): ~80% historical success rate
## Configuration Options
### Time Settings
- News release hour and minute (customizable for different events)
- Pre-news alert timing
- Setup duration (default 60 bars after news)
### Fibonacci Levels
- Adjustable retracement percentages
- Customizable target levels
- Mid-level importance weighting
### Risk Management
- Minimum reaction candle size filter
- Maximum risk point setting
- Visual risk/reward display
### Display Options
- Toggle Fibonacci level visibility
- Toggle target level display
- Toggle animation effects
- Customizable alert preferences
## Applicable News Events
This indicator is designed for high-impact economic releases:
- Non-Farm Payrolls (NFP) - First Friday, 8:30 AM ET
- Consumer Price Index (CPI) - Monthly, 8:30 AM ET
- Producer Price Index (PPI) - Monthly, 8:30 AM ET
- Gross Domestic Product (GDP) - Quarterly, 8:30 AM ET
- FOMC Interest Rate Decisions - 8 times yearly, 2:00 PM ET
## Trading Strategy Framework
### Core Principle
Markets often overreact to news initially, then reverse toward more rational price levels. This "boomerang effect" creates short-term trading opportunities.
### Entry Strategy
1. Wait for significant initial reaction (>10 points minimum)
2. Identify the initial direction using multi-factor analysis
3. Trade opposite to the initial reaction when price reaches sweet spot zones
4. Use Fibonacci retracement levels as entry triggers
### Risk Management
- Always use appropriate position sizing
- Set stop losses beyond recent swing levels
- Consider market volatility and news importance
- Monitor for setup invalidation signals
## Important Notes
### Educational Purpose
This indicator is for educational and analytical purposes. Users should:
- Thoroughly test strategies in demo environments
- Understand the risks involved in news trading
- Consider market conditions and volatility
- Use proper risk management techniques
### Market Considerations
- High volatility during news events increases both opportunity and risk
- Spreads may widen significantly during news releases
- Different brokers may have varying execution conditions
- Economic calendar timing may vary between sources
### Limitations
- Past performance does not guarantee future results
- Market conditions can change, affecting strategy effectiveness
- News events may have unexpected outcomes affecting normal patterns
- Technical analysis should be combined with fundamental analysis
## Version Information
- Compatible with TradingView Pine Script v5
- Designed for 1-minute timeframe optimal performance
- Works on major forex pairs, indices, and commodities
- Regular updates based on market condition changes
---
**Disclaimer:** This indicator is provided for educational purposes only. Trading involves substantial risk and is not suitable for all investors. Past performance is not indicative of future results. Users should conduct their own research and consider their financial situation before making trading decisions.

VWAP Adaptive (RelVol-Adjusted)This indicator provides an Adaptive VWAP that adjusts volume weighting using RelVol (Relative Volume at Time), offering a more accurate and context-aware price reference during sessions with irregular volume behavior.
Classic VWAP calculates the average price weighted by raw volume, without considering the time of day. This becomes a serious limitation during major market events such as CPI releases, FOMC announcements, NFP, or large-cap earnings. These events often trigger massive volume spikes within one or two candles. As a result, the classic VWAP gets pulled toward those extreme prices and becomes permanently skewed for the rest of the session.
In such conditions, classic VWAP becomes unreliable. It no longer reflects fair value and often misleads traders relying on it for dynamic support, resistance, or reversion signals.
This Adaptive VWAP improves on that by using RelVol, which compares the current volume to the average volume seen at the same time over previous sessions. It gives more weight to price when volume is typical for that moment, and adjusts the influence when volume is statistically abnormal. This reduces the impact of isolated volume spikes and stabilizes the VWAP path, even in high-volatility environments.
For example, on SPY 1-minute or 5-minute charts during a CPI release, a massive spike in volume and price can occur within a single candle. Classic VWAP will immediately anchor itself to that spike. Adaptive VWAP using RelVol softens that effect and maintains a more realistic trajectory.
Key features:
- Adaptive VWAP weighted by time-adjusted Relative Volume (RelVol)
- Designed to maintain VWAP reliability during macroeconomic events
- Flexible anchoring: Session, Week, Month, Quarter, Earnings, etc.
- Optional display of Classic VWAP for comparison
- Up to 3 customizable deviation bands (standard deviation or percentage)
This tool is ideal for intraday traders who need a VWAP that remains usable and unbiased, even in volatile sessions. It adds robustness to VWAP-based strategies by incorporating time-sensitive volume normalization.

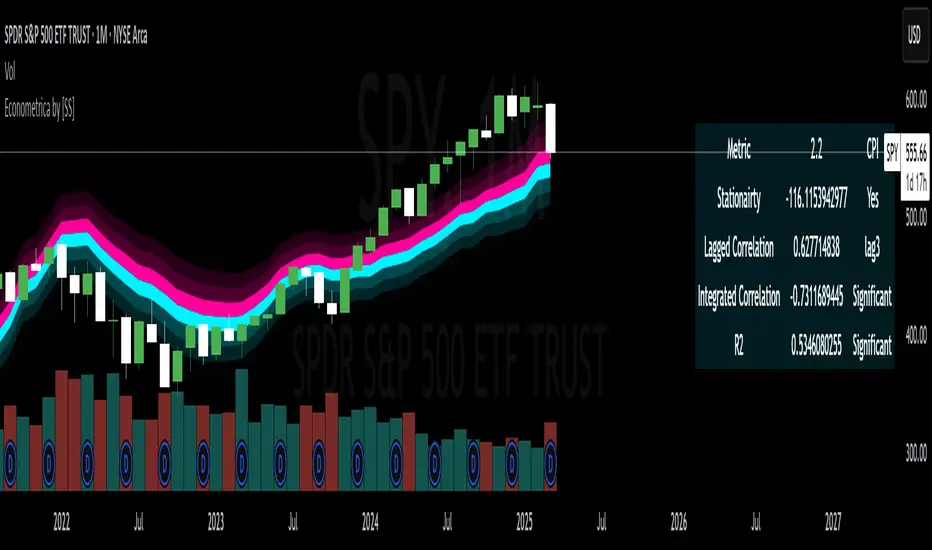
Econometrica by [SS]This is Econometrica, an indicator that aims to bridge a big gap between the resources available for analysis of fundamental data and its impact on tickers and price action.
I have noticed a general dearth of available indicators that offer insight into how fundamentals impact a ticker and provide guidance on how they these economic factors influence ticker behaviour.
Enter Econometrica. Econometrica is a math based indicator that aims to co-integrate and model indicator price action in relation to critical economic metrics.
Econometrica supports the following US based economic data:
CPI
Non-Farm Payroll
Core Inflation
US Money Supply
US Central Bank Balance Sheet
GDP
PCE
Let's go over the functions of Econometrica.
Creating a Regression Cointegrated Model
The first thing Econometrica does is creates a co-integrated regression, as you see in the main chart, predicting ticker value ranges from fundamental economic data.
You can visualize this in the main chart above, but here are some other examples:
SPY vs Core Inflation:
BA vs PCE:
QQQ vs US Balance Sheet:
The band represents the anticipated range the ticker should theoretically fall in based on the underlying economic value. The indicator will breakdown the relationship between the economic indicator and the ticker more precisely. In the images above, you can see how there are some metrics provided, including Stationairty, lagged correlation, Integrated Correlation and R2. Let's discuss these very briefly:
Stationarity: checks to ensure that the relationship between the economic indicator and ticker is stationary. Stationary data is important for making unbiased inferences and projections, so having data that is stationary is valuable.
Lagged Correlation: This is a very interesting metric. Lagged correlation means whether there is a delay in the economic indicator and the response of the ticker. Typically, you will observed a lagged correlation between an economic indicator and price of a ticker, as it can take some time for economic changes to reach the market. This lagged correlation will provide you with how long it takes for the economic indicator to catch up with the ticker in months.
Integrated Correlation: This metric tells you how good of a fit the regression bands are in relation to the ticker price. A higher correlation, means the model is better at consistent and accurate information about the anticipated range for the ticker in relation to the economic indicator.
R2: Provides information on the variance and degree of model fit. A high R2 value means that the model is capable of explaining a large amount of variance between the economic indicator and the ticker price action.
Explaining the Relationship
Owning to the fact that the indicator is a bit on the mathy side (it has to be to do this kind of task), I have included ability for the indicator to explain and make suggestions based on the underlying data. It can assess the model's fit and make suggestions for tweaking. It can also explain the implications of the data being presented in the model.
Here is an example with QQQ and the US Balance Sheet:
This helps to simplify and interpret the results you are looking at.
Forecasting the Economic Indicator
In addition to assessing the economic indicator's impact on the ticker, the indicator is also capable of forecasting out the economic indicator over the next 25 releases.
Here is an example of the CPI forecast:
Overall use of the indicator
The indicator is meant to bridge the gap between Technical Analysis and Fundamental Analysis.
Any trader who is attune to fundamentals would benefit from this, as this provides you with objective data on how and to what extent fundamental and economic data impacts tickers.
It can help affirm hypothesis and dispel myths objectively.
It also omits the need from having to perform these types of analyses outside of Tradingview (i.e. in excel, R or Python), as you can get the data in just a few licks of enabling the indicator.
Conclusion
I have tried to make this indicator as user friendly as possible. Though it uses a lot of math, it is fairly straight forward to interpret.
The band plotted can be considered the fair market value or FMV of the ticker based on the underlying economic data, provided the indicator tells you that the relationship is significant (and it will blatantly give you this information verbatim, you don't have to interpret the math stuff).
This is US economic data only. It does not pull economic data from other countries. You can absolutely see how US economic data impacts other markets like the TSX, BANKNIFTY, NIFTY, DAX etc. but the indicator is only pulling US economic data.
That is it!
I hope you enjoy it and find this helpful!
Thanks everyone and safe trades as always 🚀🚀🚀
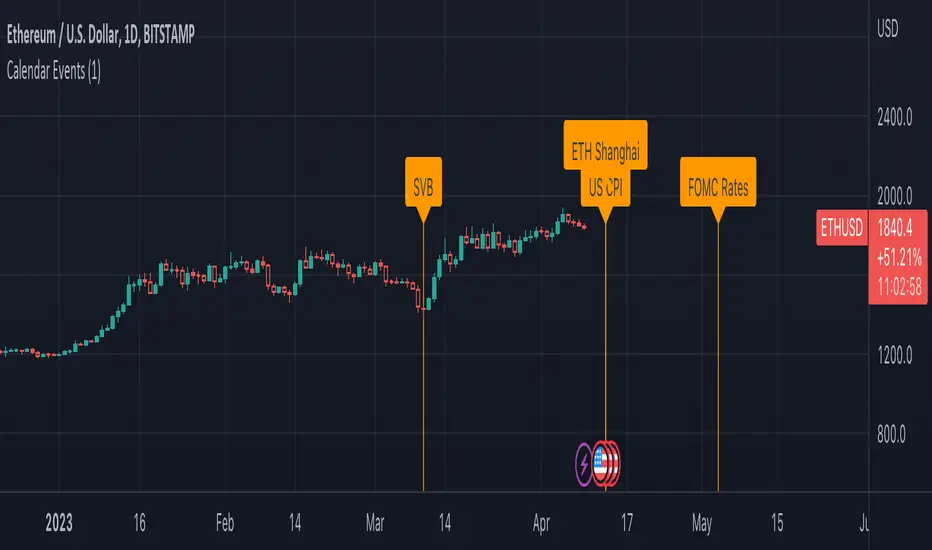
Economic Calendar EventsThis indicator provides an overlay of Events on the main chart, where each Event is visually represented by a Label and vertical Line, placed at the specified time interval for each Event.
Events are defined by user data as an input string on the settings widget panel for the indicator. The event data is a string (semicolon delimited) whose grammar is a representation of a collection of Event records, where each Event record is a comma-separated list of fields, which correspond to:
The name of the event.
The symbol or ticker to which the Event applies (or `*` if it should apply to all ticklers).
The timezone and then the year, month, day, hour, and minute of the event, respectively.
Each Event record is separated by the semicolon ";" character.
As an example , assume `evantData` is the string:
"SVB,*,UTC,2023,03,10,00,00;US CPI,*,UTC,2023,04,12,08,30;ETH Shanghai,ETHUSD,UTC,2023,04,12,08,30"
In the above case, there are 4 Events defined, three of which apply to all tickers and one applies only to ETHUSD, as follows:
The first event is named SVB and applies to all tickers at UTC time on March 10, 2023 at 12:00:00.
The second event is named US CPI and applies to all tickers at UTC time on April 12, 2023 at 08:30:00.
The third event is named ETH Shanghai and applies to the ETHUSD ticker at UTC time on April 12, 2023 at 08:30:00.
The fourth event is named FOMC Rates and applies to all tickers at UTC time on May 3, 2023 at 14:00:00.
The following is a BNF for defining event data:
market-events ::= event-record | event-record ";" market-events
event-record ::= event-name "," ticker ”,” event-timezone "," event-time
event-name ::= string
event-time>::= year "," month "," day "," hour "," minute
event-timezone ::= string
ticker ::= "*" | string
string ::= +
year ::= {4}
month ::= {2}
day ::= {2}
hour ::= {2}
minute ::= {2}
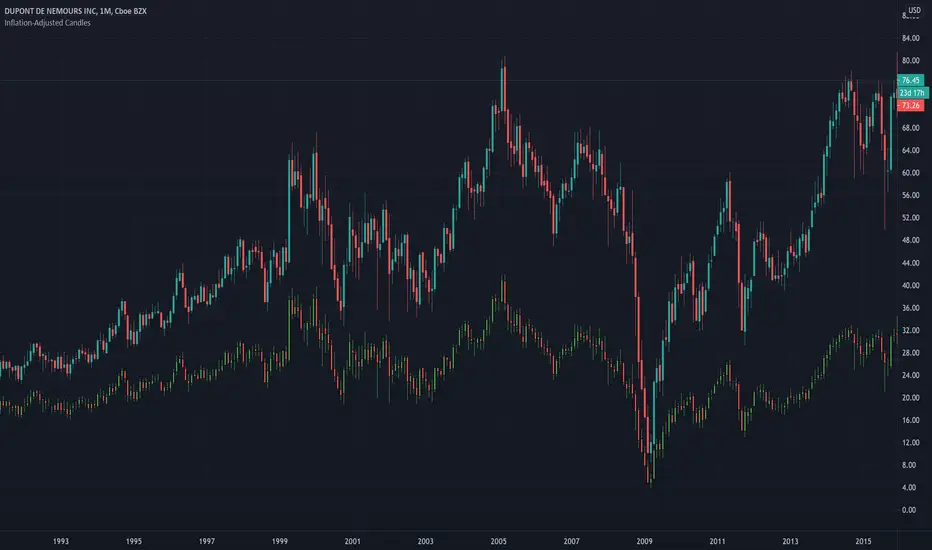
Inflation-Adjusted CandlesDeflates time series of historical open, close, high, low prices. This adjusts price data for inflation and removes the effect of price inflation.
inflation-adjusted price for period 't' = (price / cpi ) * 100
Historical CPI is pulled from Quandl.
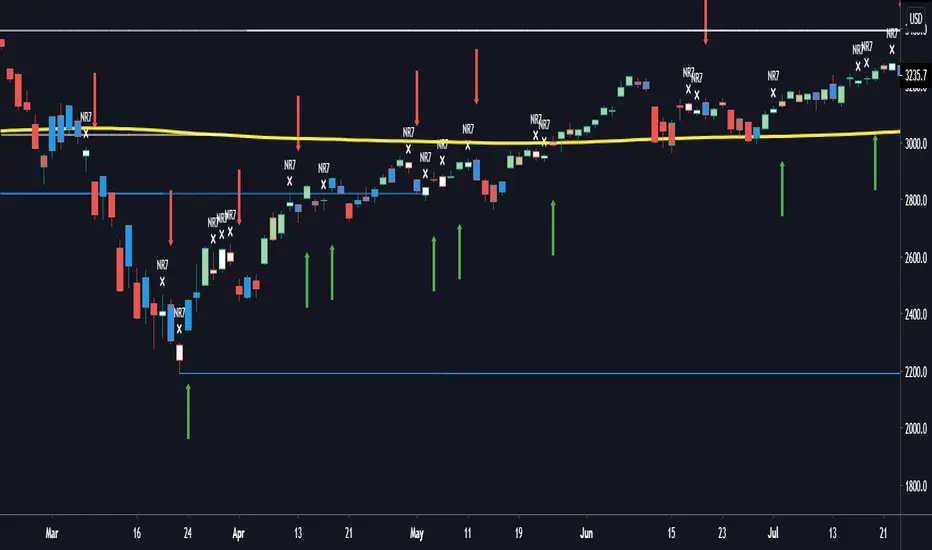
NR7 Indicator Based on Thomas Bulkowski's TheoriesThis NR7 indicator was built on the concept by Thomas Bulkowski and his ThePatternSite. NR7 is based on high to low price range (true range) that is the smallest of the prior 6 days (7 days total), when one NR7 shows, it means that today's candle body (low to high) is the narrowest of the past 7 days. Then if the current close is higher than the NR7's high, we call it a bullish breakout; and if the current close is lower than the NR7's low, we call it a bearish breakout. Regardless the direction, once the current close price goes above or below the high or low of the NR7 candle, we call it a "breakout" in this strategy. Bulkowski suggested on his website that only gave 7 calendar days (NOT trading days) for the symbol to breakout after NR7 occurs, and if the underlying asset does not breakout within 7 calendar days after one NR7 occurs, we would abandon this NR7 signal and start recounting again.
Since most securities/indexes do not trade on the weekends and have no data available, I switched 7 calendar days breakout limit to 5 trading days breakout limit, which will work on most assets. However, if you are trading cryptocurrencies or forex which have data on the weekends, feel free to add 2 more days to finish the NR7 count, all you have to do is to add "Buy6", "Buy7", "Sell6" and "Sell7" under line 11 and line 17, then add the senarioes under those "if" statements.
Every "NR7" will show up on the chart with a cross symbol and text next to it, then green arrowups show bullish signals and red arrowdowns show bearish signals. Bulkowski also added a "CPI" index on his NR7 strategy, this indicator does not include that "CPI equation" for simplicity purposes and other time frame tradings other than just weekly signals. Please like and share this script, let me know if any questions, thanks!
FCBI Brake PressureBrake Pressure (FCBI − USIRYY)
Concept
The Brake Pressure indicator quantifies whether the bond market is braking or releasing liquidity relative to real yields (USIRYY).
It is derived from the Financial-Conditions Brake Index (FCBI) and expresses the balance between long-term yield pressure and real-rate dynamics.
Formula
Brake Pressure = FCBI − USIRYY
where FCBI = (US10Y) − (USINTR) − (CPI YoY)
Purpose
While FCBI measures the intensity of financial-condition pressure, Brake Pressure shows when that brake is being applied or released.
It captures the turning point of liquidity transmission in the financial system.
How to Read
Brake Pressure < 0 (orange) → Brake engaged → financial conditions tighter than real-rate baseline; liquidity constrained.
Brake Pressure ≈ 0 → Neutral zone → transition phase between tightening and easing.
Brake Pressure > 0 (teal) → Brake released → financial conditions looser than real-rate baseline; liquidity flows freely → late-cycle setup before recession.
Zero-Cross Logic
Cross ↑ above 0 → FCBI > USIRYY → brake released → liquidity acceleration → typically 6–18 months before recession.
Cross ↓ below 0 → FCBI < USIRYY → brake re-engaged → tightening resumes.
Historical Behavior
Each major U.S. recession (2001, 2008, 2020) was preceded by a Brake Pressure cross above zero after a negative phase, signaling that long yields had stopped resisting Fed cuts and liquidity was expanding.
Practical Use
• Identify late-cycle turning points and liquidity inflection phases.
• Combine with FCBI for a complete macro transmission picture.
• Watch for sustained positive readings as early macro-recession warnings.
Current Example (Oct 2025)
FCBI ≈ −3.1, USIRYY ≈ +3.0 → Brake Pressure ≈ −6.1 → Brake still engaged. When this crosses above 0, it signals that liquidity is free flowing and the recession countdown has begun.
Summary
FCBI shows how tight the brake is. Brake Pressure shows when the brake releases.
When Brake Pressure > 0, the system has entered the liquidity-expansion phase that historically precedes a U.S. recession.
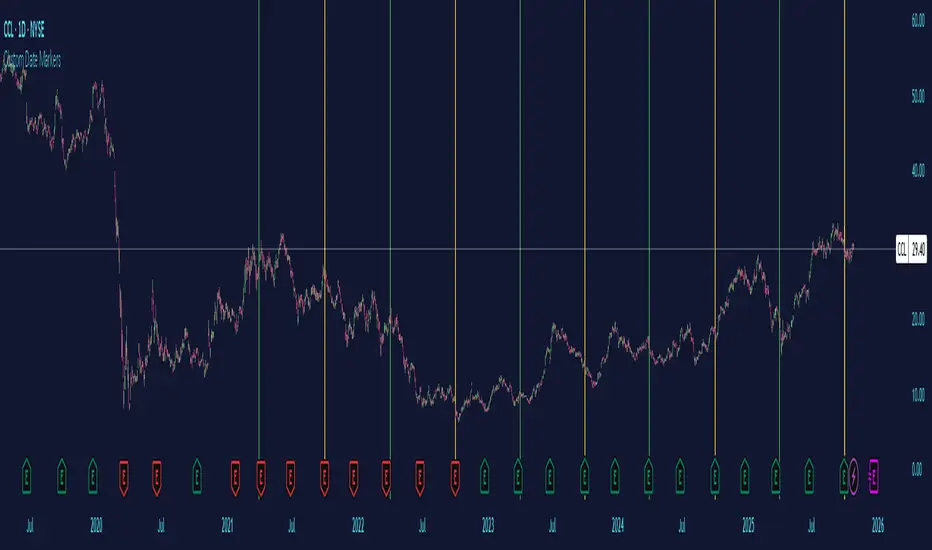
Custom Date MarkersCustom Date Markers - Pine Script Indicator
This indicator provides a powerful visual tool for technical and pattern analysis by allowing traders to mark up to 10 specific historical dates with customizable vertical lines on any chart. Each date can be assigned its own unique color, making it easy to categorize and distinguish between different types of events or market catalysts.
Primary Use Cases:
The indicator excels at identifying cyclical patterns and recurring market behavior. By marking significant dates such as earnings announcements, Federal Reserve meetings, dividend ex-dates, or seasonal events, traders can quickly visualize whether stocks consistently react in similar ways around these recurring dates. This is particularly valuable for discovering hidden patterns that might not be obvious from price action alone.
Practical Applications:
Earnings Analysis: Mark historical earnings dates to see if a stock tends to rally or sell-off before/after announcements
Macro Events: Identify how assets respond to FOMC meetings, CPI releases, or other economic data
Seasonal Patterns: Track dates that show recurring volatility or directional moves (like tax deadline periods, end-of-quarter re balancing, etc.)
Event Studies: Analyze the impact of company-specific events like product launches, FDA approvals, or leadership changes
Advanced Insights:
What makes this tool particularly interesting is its ability to reveal non-obvious correlations. For example, you might discover that a retail stock consistently experiences volume spikes 2-3 weeks before Black Friday across multiple years, or that certain tech stocks show weakness during specific conference dates. The color-coding feature allows you to layer multiple event types simultaneously—perhaps using red for bearish catalysts and green for bullish ones—creating a visual heat map of historical market reactions.
The indicator's 6-month default spacing (covering 4.5 years) is strategically designed to capture multiple business cycles while maintaining clarity on the chart. This timeframe is long enough to identify genuine patterns rather than coincidences, yet focused enough to remain relevant to current market conditions.
Pro Tip: Combine this indicator with volume analysis or other technical indicators to validate whether the patterns you observe are accompanied by meaningful market participation or if they're statistical noise.
10Y–2Y Treasury Yield Curve Spread & MES % Change📝 Description:
This indicator tracks the U.S. 10-Year minus 2-Year Treasury yield spread — a powerful macroeconomic signal often used by professional traders to gauge market sentiment and recession risk — and overlays an optional MES % change line to help intraday futures traders spot macro–price divergences in real time.
Features:
🏦 Plots the 10Y–2Y spread, with optional EMA smoothing.
📉 Highlights yield curve inversion (background turns red when spread < 0).
📊 Optional MES % change line from daily or RTH open for directional bias.
🔔 Alert conditions for:
Yield curve inversion / un-inversion.
Sudden spread spikes in basis points (customizable).
🧮 Optional correlation plot to visualize relationship strength between MES and the yield curve.
🧭 Z-score normalization allows both series to be viewed in one pane without scaling issues.
Why it matters:
A falling or inverted 2s10s spread often signals risk-off behavior and pressure on equities.
A steepening curve tends to support risk-on rallies.
Divergences between MES price action and the spread can provide early warning signals of reversals or fakeouts.
Best used with:
MES (MES1!) or MYM charts for intraday & swing bias.
Fed event days, CPI/NFP, or any macro-sensitive sessions.
VWAP or structure-based intraday trading strategies.
⚠️ Note: This indicator is for informational purposes only and does not constitute financial advice. Always combine macro context with your own trade plan and risk management.

Macro & Earnings Dashboard — NY Fed CalendarMacro & Earnings Dashboard — NY Fed Calendar
This is an overlay indicator designed to provide a quick, real-time overview of the most critical upcoming US economic data releases and corporate earnings reports directly on your TradingView chart. It functions as a dynamic dashboard, removing the need to constantly check external calendars.
Key Features
1. Real-Time Economic Calendar (Bottom-Right Table)
The dashboard tracks the time remaining until the next release of five major, high-impact economic indicators. The data for these dates is pre-loaded directly from the New York Fed Economic Indicators Calendar (currently loaded for October through December 2025).
The tracked events include:
CPI (Consumer Price Index)
PPI (Producer Price Index)
Employment Situation (Non-Farm Payrolls / Unemployment Rate)
Interest Rate Decision (FOMC Meetings)
Consumer Sentiment (University of Michigan Survey)
2. Corporate Earnings Tracker (Top-Right Table)
This table uses TradingView's built-in data to calculate the estimated days remaining until the next Earnings Per Share (EPS) report for a curated list of high-profile NASDAQ tickers:
AAPL, NVDA, GOOG, TSLA, MSFT, AMZN, META
3. Color-Coded Urgency
The "Days" column for both macro and earnings tables uses a traffic light system to instantly communicate how soon the event is:
Red: The event is scheduled for Today or Tomorrow (0–1 day away).
Orange: The event is scheduled for the current week (within 6 days).
Teal: The event is more than a week away.
Gray: The date is currently unavailable or outside the loaded calendar range.

ARO Pro — Adaptive Regime OscillatorARO Pro — Adaptive Regime Oscillator (v6)
ARO Pro turns your chart into a context-aware decision system. It classifies every bar as Trending (up or down) or Ranging in real time, then switches its math to match the regime: trend strength is measured with an ATR-normalized EMA spread, while range behavior is tracked with a center-based RSI oscillator. The result is cleaner entries, fewer false signals, and faster reads on regime shifts—without repainting.
⸻
How it works (under the hood)
1. Regime Detection (Kaufman ER):
ARO computes Kaufman’s Efficiency Ratio (ER) over a user-defined length.
- ER > threshold → Trending (direction from EMA fast vs. EMA slow)
- ER ≤ threshold → Ranging
2. Adaptive Oscillator Core:
- Trend mode: (EMA(fast) − EMA(slow)) / ATR * 100 → momentum normalized by volatility.
- Range mode: RSI(length) − 50 → mean-reversion pressure around zero.
3. Volatility Filter (optional):
Blocks signals if ATR as % of price is below a floor you set. This reduces noise in thin or quiet markets.
4. MTF Trend Filter (optional & non-repainting):
Confirms signals only if a higher timeframe EMA(fast) > EMA(slow) for longs (or < for shorts). Implemented with lookahead_off and gaps_on.
5. Confirmation & Alerts:
Signals are locked only on bar close (barstate.isconfirmed) and offered via three alert types: ARO Long, ARO Short, ARO Regime Shift.
⸻
What you see on the chart
• Background heat:
• Green = Trending Up, Red = Trending Down, Gray = Range.
• ARO line (panel): Adaptive oscillator (trend/value colors).
• Signal markers: ▲ Long / ▼ Short on confirmed bars.
• Guide lines: Upper/Lower thresholds (±K) and zero line.
• Info Panel (table): Regime, ER, ATR %, ARO, HTF status (OK/BLOCK/OFF), and a Confidence light.
• Debug Overlay (optional): Quick view of thresholds and raw conditions for tuning.
⸻
Inputs (quick reference)
• Signals: Fast/Slow EMA, RSI length, ER length & threshold, oscillator smoothing, signal threshold.
• Filters: ATR length, minimum ATR% (volatility floor), toggle for volatility filter.
• Visuals: Background on/off, Info Panel on/off, Debug overlay on/off.
• MTF (safe): Toggle + HTF timeframe (e.g., 240, D, W).
⸻
Interpreting signals
• Long: Trend regime AND fast EMA > slow EMA AND ARO ≥ +threshold (confirmed bar, filters passing).
• Short: Trend regime AND fast EMA < slow EMA AND ARO ≤ −threshold (confirmed bar, filters passing).
• Regime Shift: Alert when ER moves the market from Range → Trend or flips trend direction.
⸻
Practical use cases & examples
1) Intraday momentum alignment (scalps to day trades)
• Timeframes: 5–15m with HTF filter = 4H.
• Flow:
1. Wait for Trend Up background + HTF OK.
2. Enter on ▲ Long when ARO crosses above +threshold.
3. Stops: 1–1.5× ATR(14) below trigger bar or below last micro swing.
4. Exits: Partial at 1× ATR, trail remainder with an ATR stop or when ARO reverts to zero/Regime Shift.
• Why it works: You’re trading with the dominant higher-timeframe structure while avoiding low-volatility fakeouts.
2) Swing trend following (cleaner trend legs)
• Timeframes: 1H–4H with HTF filter = 1D.
• Flow:
1. Only act in Trend background aligned with HTF.
2. Add on subsequent ▲ signals as ARO maintains positive (or negative) territory.
3. Reduce or exit on Regime Shift (Trend → Range or direction flip) or when ARO crosses back through zero.
• Stops/targets: Initial 1.5–2× ATR; move to breakeven once the trade gains 1× ATR; trail with a multiple-ATR or structure lows/highs.
3) Range tactics (fade the extremes)
• Timeframes: 15m–1H or 1D on mean-reverting names.
• Flow:
1. Act only when background = Range.
2. Fade moves when ARO swings from ±extremes back toward zero near well-defined S/R.
3. Exit at the opposite band or zero line; abort if a Regime Shift to Trend occurs.
• Tip: Increase ER threshold (e.g., 0.35–0.40) to label more bars as Range on choppy instruments.
4) Event days & macro filters
• Approach: Raise the volatility floor (Min ATR%) on macro days (FOMC, CPI).
• Effect: You’ll ignore “fake” micro swings in the minutes leading up to releases and catch only post-event confirmed momentum.
⸻
Parameter tuning guide
• ER Threshold:
• Lower (0.20–0.30) = more Trend bars, more signals, higher noise.
• Higher (0.35–0.45) = stricter trend confirmation, fewer but cleaner signals.
• Signal Threshold (±K):
• Raise to reduce whipsaws; lower for earlier but noisier triggers.
• Volatility Floor (ATR%):
• Thin/quiet assets benefit from a higher floor (e.g., 0.3–0.6).
• Highly liquid futures/forex can work with lower floors.
• HTF Filter:
• Keep it ON when you want higher win consistency; turn OFF for tactical counter-trend plays.
⸻
Alerts (recommended setup)
• “ARO Long” / “ARO Short”: Entry-style alerts on confirmed signals.
• “ARO Regime Shift”: Context alert to scale in/out or switch playbooks (trend vs. range).
All alerts are non-repainting and fire only when the bar closes.
⸻
Best practices & combinations
• Price action & S/R: Use ARO to define when to engage, and price structure to define where (breakout levels, pullback zones).
• VWAP/Session tools: In intraday trends, ▲ signals above VWAP tend to carry; avoid shorts below session VWAP in strong downtrends.
• Risk first: Size by ATR; never let a single ARO event override your max risk per trade.
• Portfolio filter: On indices/ETFs, enable HTF filter and a stricter ER threshold to ride regime legs.
⸻
Non-repaint and implementation notes
• The script does not repaint:
• Signals are computed and locked on bar close (barstate.isconfirmed).
• All higher-timeframe data uses request.security(..., lookahead_off, gaps_on).
• No future indexing or negative offsets are used.
• The Info Panel and Debug overlay are purely visual aids and do not change signal logic.
⸻
Limitations & tips
• Chop sensitivity: In hyper-choppy symbols, consider raising ER threshold and the signal threshold, and enable HTF filter.
• Instrument personality: EMAs/RSI lengths and volatility floor often need a quick 2–3 minute tune per asset class (FX vs. crypto vs. equities).
• No guarantees: ARO improves context and timing, but it is not a promise of profitability—always combine with risk management.
⸻
Quick start (TL;DR)
1. Timeframes: 5–15m intraday (HTF = 4H); 1H–4H swing (HTF = 1D).
2. Use defaults, then tune ER threshold (0.25–0.40) and Signal threshold (±20).
3. Enable Volatility Floor (e.g., 0.2–0.5 ATR%) on quiet assets.
4. Trade ▲ / ▼ only in matching Trend background; fade extremes only in Range background.
5. Set alerts for Long, Short, and Regime Shift; manage risk with ATR stops.
⸻
Author’s note: ARO Pro is designed to be clear, adaptive, and operational out of the box. If you publish variants (e.g., different ER logic, alternative trend cores), please credit the original and document any changes so users can compare behavior reliably.

ORB Pro w/ Filters + Debug Overlay Update with Reason box fixThis indicator is designed to highlight high-probability reversal setups for intraday traders.
It focuses on the cleanest, most reliable candlestick reversal patterns and combines them with trend, VWAP/EMA confluence, and a time-based filter to reduce noise.
🛠️ How It Works
The script scans each bar for well-known reversal signals:
Doji Reversal – small body, long wicks showing indecision.
Hammer / Shooting Star – long wick ≥ 2× body, showing exhaustion.
Engulfing Reversal – full body engulf of the prior candle.
Additional filters include:
✅ VWAP/EMA Confluence (optional) – confirms reversals near key intraday levels.
✅ Time Window (default 9:30–10:30 NY) – avoids false signals later in the session.
✅ Trend Exhaustion Check – requires a short-term directional push before reversal.
✅ Signal Cooldown – limits to one clean signal per move.
When conditions align, the script plots:
🟢 “Bull Rev” label below the bar for bullish reversals.
🔴 “Bear Rev” label above the bar for bearish reversals.
⚙️ Recommended Settings
For the tightest, most reliable signals:
Doji Body % → 25–30
Hammer Wick Multiple → 2.0
Confluence Tolerance % → 0.2–0.3
Time Filter → ON (9:30–10:30 NY)
VWAP/EMA Filter → ON
Cooldown Bars → 10–15
These settings minimize false positives and focus on the strongest reversals.
📈 Use Case
This tool is best for:
Intraday traders (stocks, ETFs, futures, crypto).
Traders who use Opening Range Breakout (ORB) or similar systems but want a secondary tool for catching reversals.
Anyone looking to filter out weak reversal patterns and focus on textbook setups.
⚠️ Disclaimer
This script is for educational purposes only and should not be considered financial advice. Always test in simulation/paper trading before applying live
🚀 Catch textbook reversals with confidence.
This indicator filters out noise and only plots high-probability reversal signals based on proven candlestick patterns + VWAP/EMA confluence.
🔥 Key Features:
✅ Detects Doji, Hammer/Shooting Star, and Engulfing Reversals
✅ VWAP & EMA confluence filter (optional)
✅ Time window filter (default 9:30–10:30 NY for max edge)
✅ Signal cooldown to avoid clutter
✅ Clean chart labels + alert conditions
🎯 Who’s It For?
Day traders who want precision reversal entries
ORB traders looking for secondary setups
Intraday scalpers who value quality over quantity
👉 Designed for traders who want fewer, cleaner, higher-probability signals.
⚠️ Not financial advice. For educational use only
_____
🎯 ORB SET-UP DESCRIPTIONS:
🔧 Exact settings I’d recommend (to avoid that mess):
requireClose = true
requireRetest = true with retestPct = 0.2%
minRangePct = 0.3%, maxRangePct = 1.5%
volumeFilter = true, volumeLength = 20
trendFilter = true, emaLength = 20
cooldownBars = 6 (on 5m chart → 30 minutes)
🔑 ORB Range Settings
Default sweet spot: 0.2% – 0.3%
→ This usually balances enough signals with reduced false breakouts.
High volatility days (CPI, FOMC, big gaps): 0.3% – 0.5%
→ Prevents fake outs.
Low volatility days (tight overnight range, slow open): 0.15% – 0.2%
→ Keeps you from sitting on hands all day.
📌 Filters you already added help you avoid noise
EMA alignment
Volume confirmation
Optional stop/target logic
This means you don’t have to shrink the box to 0.1% — the filters will keep you in higher-probability trades
✅ Why You Might NOT See a Signal
Check box for reason signal to turn it off, updated coloring so that candles are more visable.
ORB Box Too Wide
If the opening range is large, price has to move much further to trigger a clean breakout.
Wide box = fewer signals (but higher quality).
No Clean Break + Hold
Script waits for a candle to break above/below ORB and close strong enough.
A wick poke doesn’t count.
VWAP / EMA Filter Not Aligned
If price breaks but VWAP/EMA trend filter disagrees → no signal.
Keeps you out of fake moves against the trend.
Confirmation Candle Missing (if enabled)
Even if price breaks, the script may want the next bar to confirm direction before signaling.
Cooldown / One-Signal-Per-Break Rule
Some filters prevent back-to-back spam signals.
Only the first clean setup is alerted.

RSI MA Cross + Divergence Signal (V2) Core Logic
RSI + Moving Average
The script calculates a standard RSI (default 14).
It then overlays a moving average (SMA/EMA/WMA, default 9).
When RSI crosses above its MA → bullish momentum.
When RSI crosses below its MA → bearish momentum.
Divergence Filter
Signals are only valid if there’s confirmed divergence:
Bullish divergence: Price makes a lower low, RSI makes a higher low.
Bearish divergence: Price makes a higher high, RSI makes a lower high.
Overbought / Oversold Filter
Optional extra:
Bullish signals only valid if RSI ≤ 30 (oversold).
Bearish signals only valid if RSI ≥ 70 (overbought).
This ensures signals happen in “stretched” conditions.
Risk & Trade Management
Entries taken only when all conditions align.
Exits can be managed with ATR stops, partial take-profits, breakeven moves, and trailing stops (we coded these in the strategy version).
Cooldown, session filters, and daily loss guard to keep risk tight.
🔹 Strengths
✅ High selectivity: Combining RSI cross + divergence + OB/OS means signals are rare but higher quality.
✅ Great at catching reversals: Divergence highlights where price may be running out of steam.
✅ Risk management baked in: ATR stops + partial exits smooth out equity curve.
✅ Works across markets: ES, FX, crypto — anywhere RSI divergences are respected.
✅ Flexible: You can loosen/tighten filters depending on aggressiveness.
🔹 Weaknesses
❌ Lag from pivots: Divergence only confirms after a few bars → you enter late sometimes.
❌ Choppy in ranges: In sideways markets, RSI divergences appear often and whipsaw.
❌ Filters reduce signals: With all filters ON (divergence + OB/OS + trend + session), signals can be very rare — may under-trade.
❌ Not standalone: Needs higher-timeframe context (trend, liquidity pools) to avoid counter-trend entries.
🔹 Best Ways to Trade It
Use Higher Timeframe Bias
Run the strategy on 15m/1H, but only trade in direction of higher timeframe trend (e.g., 4H EMA).
Example: If daily is bullish → only take bullish divergences.
Pair With Structure
Look for signals at key zones: HTF support/resistance, VWAP, or FVGs.
Divergence + RSI cross inside an FVG is a strong entry trigger.
Adjust OB/OS for Volatility
For crypto/FX: use 35/65 instead of 30/70 (markets trend harder).
For ES/S&P: 30/70 works fine.
Risk Management Is King
Use partial exits: take profit at 1R, trail rest.
Size by % of equity (we coded this into the strategy).
Avoid News Spikes
Divergences break down around CPI, NFP, Fed announcements — stay flat.
🔹 When It Shines
Trending markets that make extended pushes → clean divergences.
Reversal zones (oversold → bullish bounce, overbought → bearish fade).
Swing trading (15m–4H) — less noise than 1m/5m scalping.
🔹 When to Avoid
Low volatility chop → lots of false divergences.
During high-impact news → RSI swings wildly.
In strong one-way trends without pullbacks — divergence keeps calling tops/bottoms too early.
✅ Summary:
This is a reversal-focused RSI divergence strategy with strict filters. It’s powerful when combined with higher-timeframe bias + structure confluence, but weak if traded blindly in choppy or news-driven conditions. Best to treat it as a precision entry trigger, not a full system — layer it on top of your FVG/ORB framework for maximum edge.

Bias + VWAP Pullback — v4 (PA + BOS/CHOCH)Simple idea: I identify the trend (bias) from the larger timeframe, and only trade pullbacks to the VWAP/EMA during liquidity (London/New York). When the trend is clear, gold moves strongly, and its pullbacks to the balance lines provide clear opportunities.
Timeframe and Sessions (Cairo Time)
Analysis: H1 to determine the trend.
Implementation: 5m (or 1m if professional).
Trading window:
London Opening: 10:00–12:30
New York Opening: 16:30–19:00
(avoid the rest of the day unless there is exceptional traffic).
Direction determination (BIAS)
On H1:
If the price is above the 200 EMA and the daily VWAP is bullish and the price is above it → uptrend (long-only).
If the price is below the 200 EMA and the daily VWAP is bearish and the price is below it → bearish trend (short-only).
Determine your levels: yesterday's high/low (PDH/PDL) + approximate Asia range (03:00–09:30).
Entry Rules (Setup A: Trend Continuation)
Asia range breakout towards Bias during liquidity window.
Wait for a withdrawal to:
Daily VWAP, or
EMA50 on 5m frame (best if both cross).
Confirmation: Confirmation low/high on 5m (HL buy/LH sell) + clear impulse candle (Body is greater than average of last 10 candles).
Entry:
Buy: When the price returns above VWAP/EMA50 with a confirmation candle close.
Sell: The exact opposite.
Stop Loss (SL): Below/above the last confirmation low/high or ATR(14, 5m) x 1.5 (largest).
Objectives:
TP1 = 1R (Close 50% and move the rest Break-even).
TP2 = 2.5R to 3R or at an important HTF level (PDH/PDL/Bid/Demand Zone).
Entry Rules (Setup B: Reversion to VWAP – “Mean Reversion”)
Use with extreme caution, once daily maximum:
Price deviation from VWAP by more than ~1.5 x ATR(14, 5m) with rejection candles appearing near PDH/PDL.
Reverse entry towards the return of VWAP.
SL small behind rejection top/bottom.
Main target: VWAP. (Don't get greedy — this scenario is for extended periods only.)
News Filtering and Risk Management
Avoid trading 15–30 minutes before/after strong US news (CPI, NFP, FOMC).
Maximum daily loss: 1.5–2% of account balance.
Risk per trade: 0.25–0.5% (if you are learning) or 0.5–1% (if you are experienced).
Do not exceed two consecutive losing trades per day.
Don't chase the market after the opportunity has passed — wait for the next pullback.
Smart Deal Management
After TP1: Move stop to entry point + trail the rest with EMA20 on 5m or ATR Trailing = ATR(14)×1.0.
If the price touches a strong daily level (PDH/PDL) and fails to break, consider taking additional profit.
If VWAP starts to flatten and breaks against the trend on H1, stop trading for the day.
Quick Checklist (Before Entry)
H1 trend is clear and consistent with 200EMA + VWAP.
Penetrating the Asia range towards Bias.
Clean pull to VWAP/EMA50 on 5m.
Confirmation candle and real push.
SL is logical (behind swing/ATR×1.5) and R :R ≥ 1:2.
No red news coming soon.
Example of "ready-made" settings
EMA: 20, 50, 200 on 5m, 200 only on H1.
VWAP: Daily (reset daily).
ATR: 14 on 5m.
Levels: PDH/PDL + Asia Band (03:00–09:30 Cairo).
Gold Notes
Gold is fast and sharp at the open; don't get in early — wait for the draw.
Fakeouts are common before news: it is best to call with the trend after the price returns above/below VWAP.
Don't expect 80% consistent wins every day — the advantage comes from discipline, filtering out bad days, and only withdrawing when you're on the right track.
تعتبر شركة الماسة الألمانية أحد المؤسسات العاملة بالمملكة العربية السعودية ولها تاريخ طويل من الخدمات الكثيرة والمتنوعة التى مازالت تقدمها للكثير من العملاء داخل جميع مدن وأحياء المملكة حيث نقدم أفضل ما لدينا من خلال مجموعة الشركات التالية والتي من خلالها ستتلقي كل ما تحتاج إلية في كل المجال المختلفة فنحن نعمل منذ عام 2015 ولنا سابقات اعمال فى مختلف المجالات الحيوية التى نخدم من خلالها عملائنا ونوفر لهم أرخص الأسعار وبأعلى جودة من الممكن توفرها فى المجالات التالية :-
خدمات تنظيف المنازل والفلل والشقق
خدمات عزل الخزانات تنظيف غسيل صيانة اصلاح
خدمات جلي البلاط والرخام والسيراميك
خدمات نقل العفش عمالة فلبينية مدربة
خدمات مكافحة الحشرات بجدة
كل هذة الخدمات وأكثر نوفرها لكل المتعاقدين بأفضل الطرق مع توفير خطط وبرامج متنوعة لأتمام العمل المسنود إلينا بأفضل وأحدث الطرق الحديثة والعصرية سواء فى شركات النظافة بجدة ومكة المكرمة أو شركات نقل العفش بجدة عمالة فلبينية وباقى الخدمات مثل جلي وتلميع الرخام بمكة وجدة ولا ننسي شركة مكافحة حشرات بجدة التى ساعدت آلاف المواطنين على تنظيف منازلهم من الحشرات بأفضل مبيدات حشرية.

ICT 00:00, 08:30, 09:30 & 13:30 Opens (NY) — Prior-Day HistoryICT 00:00, 08:30, 09:30 & 13:30 Opens (NY)
This is a derivative of ALPHAICTRADER’s open-source script, republished under the MPL-2.0 with clear attribution and documented changes. It plots four New-York–anchored intraday reference levels—0000, 0830, 0930, 1330—as short, right-padded stubs with clean side labels. Use these time anchors (ICT-style midnight + key US windows) to frame bias, volatility pockets, and intraday trade locations.
What’s original in this version (changes)
Right-padded stubs instead of chart-wide rays — each level ends N bars past the latest candle (configurable).
Side labels at the line tip — text-only labels (0000, 0830, 0930, 1330) that sit at the right end of each stub and update every bar.
Optional prior-day history — show Today only or Today + Prior Day; older lines/labels auto-pruned.
Per-anchor controls — Display, Style, Color, Width, and Show Label for each time.
What it plots (and why)
0000 (NY Midnight): daily session anchor for bias/liquidity context.
0830 (NY): macro data window (CPI/NFP/claims) where volatility often concentrates.
0930 (NY): US cash equity market open; opening-drive structure/acceptance tests.
1330 (NY): early-afternoon anchor for continuation vs. fade.
How it works (under the hood)
Session detection: time("1", session, "America/New_York"); first bar flagged via not na(ts) and na(ts ).
Anchor price: open of that first bar per session/day.
Rendering: lines drawn with xloc=bar_index from start bar to bar_index + Right Pad; x2 updates every bar (no extend.right).
Labels: placed at line.get_x2(line) + Label Pad, soft color variant; updated per bar to stay on the tip.
History: arrays keep either today only or today + yesterday and delete anything older immediately.
How to use
Add to any intraday chart (futures/FX/indices). Anchors are always NY-time; TradingView handles DST.
Inputs
00:00 / 08:30 / 09:30 / 13:30 (NY): Display, Line Style, Color, Width, Show Label
Right Edge: Right Pad (bars) · Label Pad (bars)
History: Show Prior Day (History) — off = today only; on = today + yesterday
Suggested pads: Right Pad 2–5 bars; Label Pad 0–2.
These are context anchors, not signals. Combine with your execution model (market structure, liquidity, FVG/OBs, etc.).
Attribution & License (MPL-2.0)
Original work: “ICT NEW YORK MIDNIGHT OPEN AND 8.30 AM OPEN” by ALPHAICTRADER (MPL-2.0).
This derivative: modifications listed above; source published and kept under MPL-2.0 per license terms.
If you distribute a modified version of this Pine file, you must keep MPL-2.0, retain the copyright/licensing header, publish your modified source, and document your changes.
Notes: Pine v5. Minimalist (no day dividers). Educational tool; not financial advice.
Copyright: © ALPHAICTRADER 2022 · © Funk 2025
License: MPL-2.0

🟥 Synthetic 10Y Real Yield (US10Y - Breakeven)This script calculates and plots a synthetic U.S. 10-Year Real Yield by subtracting the 10-Year Breakeven Inflation Rate (USGGBE10) from the nominal 10-Year Treasury Yield (US10Y).
Real yields are a core macro driver for gold, crypto, growth stocks, and bond pricing, and are closely monitored by institutional traders.
The script includes key reference lines:
0% = Below zero = deeply accommodative regime
1.5% = Common threshold used by macro desks to evaluate gold upside breakout conditions
📈 Use this to monitor macro shifts in real-time and front-run capital flows during major CPI, NFP, and Fed events.
Update Frequency: Daily (based on Treasury market data)