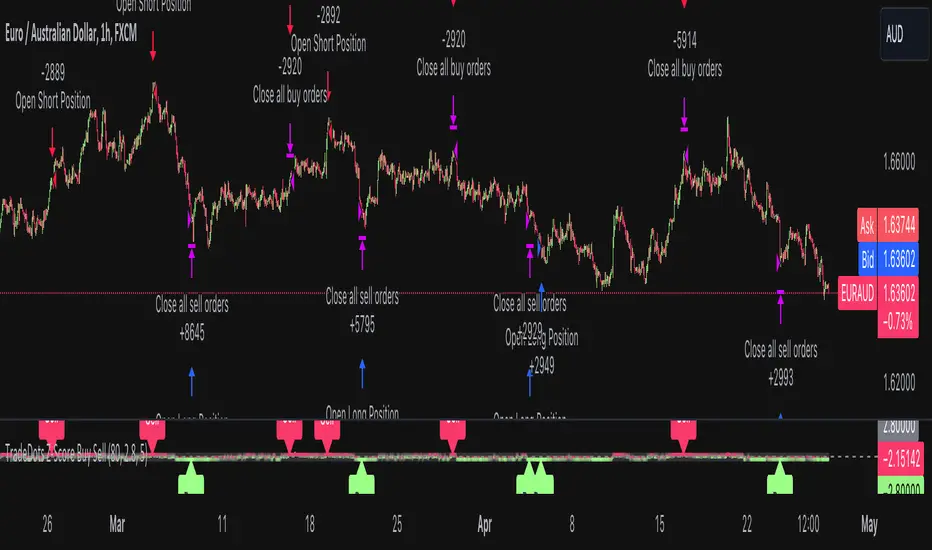
Buy Sell Strategy With Z-Score [TradeDots]The "Buy Sell Strategy With Z-Score" is a trading strategy that harnesses Z-Score statistical metrics to identify potential pricing reversals, for opportunistic buying and selling opportunities.
HOW DOES IT WORK
The strategy operates by calculating the Z-Score of the closing price for each candlestick. This allows us to evaluate how significantly the current price deviates from its typical volatility level.
The strategy first takes the scope of a rolling window, adjusted to the user's preference. This window is used to compute both the standard deviation and mean value. With these values, the strategic model finalizes the Z-Score. This determination is accomplished by subtracting the mean from the closing price and dividing the resulting value by the standard deviation.
This approach provides an estimation of the price's departure from its traditional trajectory, thereby identifying market conditions conducive to an asset being overpriced or underpriced.
APPLICATION
Firstly, it is better to identify a stable trading pair for this technique, such as two stocks with considerable correlation. This is to ensure conformance with the statistical model's assumption of a normal Gaussian distribution model. The ideal performance is theoretically situated within a sideways market devoid of skewness.
Following pair selection, the user should refine the span of the rolling window. A broader window smoothens the mean, more accurately capturing long-term market trends, while potentially enhancing volatility. This refinement results in fewer, yet precise trading signals.
Finally, the user must settle on an optimal Z-Score threshold, which essentially dictates the timing for buy/sell actions when the Z-Score exceeds with thresholds. A positive threshold signifies the price veering away from its mean, triggering a sell signal. Conversely, a negative threshold denotes the price falling below its mean, illustrating an underpriced condition that prompts a buy signal.
Within a normal distribution, a Z-Score of 1 records about 68% of occurrences centered at the mean, while a Z-Score of 2 captures approximately 95% of occurrences.
The 'cool down period' is essentially the number of bars that await before the next signal generation. This feature is employed to dodge the occurrence of multiple signals in a short period.
DEFAULT SETUP
The following is the default setup on EURUSD 1h timeframe
Rolling Window: 80
Z-Score Threshold: 2.8
Signal Cool Down Period: 5
Commission: 0.03%
Initial Capital: $10,000
Equity per Trade: 30%
RISK DISCLAIMER
Trading entails substantial risk, and most day traders incur losses. All content, tools, scripts, articles, and education provided by TradeDots serve purely informational and educational purposes. Past performances are not definitive predictors of future results.
Cerca negli script per "股价在8元左右净利润为正市值小于80亿的热门股票有哪些"
RSI and ATR Trend Reversal SL/TPQuick History:
I was frustrated with a standard fixed percent TP/SL as they often were not receptive to quick market rallies/reversals. I developed this TP/SL and eventually made it into a full fledge strategy and found it did well enough to publish. This strategy can be used as a standalone or tacked onto another strategy as a TP/SL. It does function as both with a single line. This strategy has been tested with TSLA , AAPL, NVDA, on the 15 minutes timeframe.
HOW IT WORKS:
Inputs:
Length: Simple enough, it determines the length of the RSI and ATR used.
Multiplier: This multiplies the RSI and ATR calculation, more on this later.
Delay to prevent Idealization: TradingView will use the open of the bar the strategy triggers on when calculating the backtest. This can produce unrealistic results depending on the source. If your source is open, set to 0, if anything else, set to 1.
Minimum Difference: This is essentially a traditional SL/TP, it is borderline unnecessary, but if the other parameters are wacky this can be used to ensure the SL/TP. It multiplies the source by the percent, so if it is set to 10, the SL/TP is initialized at src +- 10%.
Source input: Self Explanatory, be sure to update the Delay if you use open.
CALCULATION:
Parameters Initialization:
The strategy uses Heikinashi values for calculations, this is not toggleable in parameters, but can be easily changed by changing hclose to equal src.
FUNCTION INITIALIZATION:
highest_custom and lowest_custom do the same thing as ta.highest and ta.lowest, however the built in ta library does not allow for var int input, so I had to create my own functions to be used here. I actually developed these years ago and have used them in almost every strategy since. Feel especially free to use these in your own scripts.
The rsilev is where the magic happens.
SL/TP min/max are initially calculated to be used later.
Then we begin by establishing variables.
BullGuy is used to determine the length since the last crossup or crossdown, until one happens, it returns na, breaking the function. BearGuy is used in all the calculations, and is the same as BullGuy, unless BullGuy is na, where BearGuy counts up from 1 on each bar from 0.
We create our rsi and have to modify the second one to suit the function. In the case of the upper band, we mirror the lower one. So if the RSI is 80, we want it to be 20 on the upper band.
the upper band and lower band are calculated the exact same way, but mirrored. For the purpose of writing, I'm going to talk about the lower band. Assume everything is mirrored for the upper one. It finds the highest source since the last crossup or crossdown. It then multiplies from 1 / the RSI, this means that a rapid RSI increase will increase the band dramatically, so it is able to capture quick rally/reversals. We add this to the atr to source ratio, as the general volatility is a massive factor to be included. We then multiply this number by our chosen amount, and subtract it from the highest source, creating the band.
We do this same process but mirrored with both bands and compared it to the source. If the source is above the lower band, it suggests an uptrend, so the lower band is outputted, and vice versa for the upper one.
PLOTTING:
We also determine the line color in the same manner as we do the trend direction.
STRATEGY:
We then use the source again, and if it crosses up or down relative to the selected band, we enter a long or short respectively.
This may not be the most superb independent strategy, but it can be very useful as a TP/SL for your chosen entry conditions, especially in volatile markets or tickers.
Thank you for taking the time to read, and please enjoy.

RSI Confirm Trend with Williams (W%R)RSI Confirm Trend with Williams (W%R)
This is the "RSI Confirm Trend with Williams (W%R)" indicator
This is a modification of the "RSI Trends" indicator by zzzcrypto123.
What Is the Relative Strength Index (RSI)?
The relative strength index (RSI) is a momentum indicator used in technical analysis. RSI measures the speed and magnitude of a security's recent price changes to evaluate overvalued or undervalued conditions in the price of that security.
What is Williams %R?
Williams %R, also known as the Williams Percent Range, is a type of momentum indicator that moves between 0 and -100 and measures overbought and oversold levels. The Williams %R may be used to find entry and exit points in the market. The indicator is very similar to the Stochastic oscillator and is used in the same way. It was developed by Larry Williams and it compares a stock’s closing price to the high-low range over a specific period, typically 14 days or periods.
How Does "RSI Confirm Trend with Williams (W%R)" work?
This indicator combines the momentum of both RSI and Williams %R by adding upper and lower thresholds. When the thresholds are broken, this indicator changes color from gray to either green or red.
What Are The Thresholds?
The default RSI thresholds are 55 and 45. These values are configurable.
The default Williams %R thresholds are 80 and 20. These values are configurable and made positive so it can be plotted against the RSI line.
How To Use?
When the RSI exceeded the upper/lower thresholds, the RSI line color will change from gray to lighter green/red color.
When the Williams %R exceeded the upper/lower thresholds, the RSI color will change to darker green/red color signifying a strong momentum in that direction.
When the RSI color is gray, this means the RSI and Williams %R thresholds are not broken which can also signify as no trend or consolidation.
The Williams %R line is not displayed by default but can be enabled using the checkbox provided in the Style tab.
This "RSI Confirm Trend with Williams (W%R)" indicator can be combined with other technical indicators to verify the idea behind this theory.
-----------------
Disclaimer
The information contained in this indicator does not constitute any financial advice or a solicitation to buy or sell any securities of any type.
My scripts/indicators/ideas are for educational purposes only!

Hurst Future Lines of Demarcation StrategyJ. M. Hurst introduced a concept in technical analysis known as the Future Line of Demarcation (FLD), which serves as a forward-looking tool by incorporating a simple yet profound line into future projections on a financial chart. Specifically, the FLD is constructed by offsetting the price half a cycle ahead into the future on the time axis, relative to the Hurst Cycle of interest. For instance, in the context of a 40 Day Cycle, the FLD would be represented by shifting the current price data 20 days forward on the chart, offering an idea of future price movement anticipations.
The utility of FLDs extends into three critical areas of insight, which form the backbone of the FLD Trading Strategy:
A price crossing the FLD signifies the confirmation of either a peak or trough formation, indicating pivotal moments in price action.
Such crossings also help determine precise price targets for the upcoming peak or trough, aligned with the cycle of examination.
Additionally, the occurrence of a peak in the FLD itself signals a probable zone where the price might experience a trough, helping to anticipate of future price movements.
These insights by Hurst in his "Cycles Trading Course" during the 1970s, are instrumental for traders aiming to determine entry and exit points, and to forecast potential price movements within the market.
To use the FLD Trading Strategy, for example when focusing on the 40 Day Cycle, a trader should primarily concentrate on the interplay between three Hurst Cycles:
The 20 Day FLD (Signal) - Half the length of the Trade Cycle
The 40 Day FLD (Trade) - The Cycle you want to trade
The 80 Day FLD (Trend) - Twice the length of the Trade Cycle
Traders can gauge trend or consolidation by watching for two critical patterns:
Cascading patterns, characterized by several FLDs running parallel with a consistent separation, typically emerge during pronounced market trends, indicating strong directional momentum.
Consolidation patterns, on the other hand, occur when multiple FLDs intersect and navigate within the same price bandwidth, often reversing direction to traverse this range multiple times. This tangled scenario results in the formation of Pause Zones, areas where price momentum is likely to temporarily stall or where the emergence of a significant trend might be delayed.
This simple FLD indicator provides 3 FLDs with optional source input and smoothing, A-through-H FLD interaction background, adjustable “Close the Trade” triggers, and a simple strategy for backtesting it all.
The A-through-H FLD interactions are a framework designed to classify the different types of price movements as they intersect with or diverge from the Future Line of Demarcation (FLD). Each interaction (designated A through H by color) represents a specific phase or characteristic within the cycle, and understanding these can help traders anticipate future price movements and make informed decisions.
The adjustable “Close the Trade” triggers are for setting the crossover/under that determines the trade exits. The options include: Price, Signal FLD, Trade FLD, or Trend FLD. For example, a trader may want to exit trades only when price finally crosses the Trade FLD line.
Shoutouts & Credits for all the raw code, helpful information, ideas & collaboration, conversations together, introductions, indicator feedback, and genuine/selfless help:
🏆 @TerryPascoe
🏅 @Hpotter
👏 @parisboy

Relative Strength Index(RSI)- Range (60-40)Custom RSI Indicator:
The Custom RSI Indicator is a technical analysis tool designed to assess the momentum of a financial instrument's price movements within a specified range. Unlike the traditional RSI, which typically operates within a range of 0 to 100, this customized version focuses on a narrower spectrum between 40 and 60, providing clearer signals for traders.
Key Features:
Bullish and Bearish Zones: The indicator delineates between bullish and bearish sentiment. When the RSI value climbs above 60, it signals bullish momentum, indicating potential uptrends in the price. Conversely, when the RSI dips below 40, it suggests bearish sentiment, signaling potential downtrends.
Overbought and Oversold Conditions: Additionally, the Custom RSI Indicator identifies extreme market conditions. When the RSI surpasses 80 , it denotes overbought territory, suggesting that the asset may be overvalued and prone to a reversal or correction. Conversely, when the RSI falls below 30 , it indicates oversold conditions, suggesting that the asset may be undervalued and ripe for a potential rebound.
Default RSI Comparison: The Custom RSI Indicator can be compared against the traditional RSI for added context. While the customized range provides more precise signals within the 60-40 spectrum, referencing the default RSI can offer broader insights into market dynamics.
Usage:
Trend Identification: Traders can utilize the Custom RSI Indicator to identify potential trend reversals or continuations based on shifts in momentum within the specified range.
Confirmation Tool: It can serve as a confirmation tool alongside other technical indicators or price action analysis, enhancing the overall reliability of trading decisions.
Risk Management: By recognizing overbought and oversold conditions, traders can implement risk management strategies such as setting stop-loss orders or adjusting position sizes to mitigate potential losses.
Conclusion:
The Custom RSI Indicator offers traders a focused perspective on market momentum within the 60-40 range, facilitating more accurate assessments of bullish and bearish sentiment as well as identifying extreme market conditions. By incorporating this tool into their analysis, traders can make informed decisions and potentially improve their trading outcomes.

Statistics • Chi Square • P-value • SignificanceThe Statistics • Chi Square • P-value • Significance publication aims to provide a tool for combining different conditions and checking whether the outcome is significant using the Chi-Square Test and P-value.
🔶 USAGE
The basic principle is to compare two or more groups and check the results of a query test, such as asking men and women whether they want to see a romantic or non-romantic movie.
–––––––––––––––––––––––––––––––––––––––––––––
| | ROMANTIC | NON-ROMANTIC | ⬅︎ MOVIE |
–––––––––––––––––––––––––––––––––––––––––––––
| MEN | 2 | 8 | 10 |
–––––––––––––––––––––––––––––––––––––––––––––
| WOMEN | 7 | 3 | 10 |
–––––––––––––––––––––––––––––––––––––––––––––
|⬆︎ SEX | 10 | 10 | 20 |
–––––––––––––––––––––––––––––––––––––––––––––
We calculate the Chi-Square Formula, which is:
Χ² = Σ ( (Observed Value − Expected Value)² / Expected Value )
In this publication, this is:
chiSquare = 0.
for i = 0 to rows -1
for j = 0 to colums -1
observedValue = aBin.get(i).aFloat.get(j)
expectedValue = math.max(1e-12, aBin.get(i).aFloat.get(colums) * aBin.get(rows).aFloat.get(j) / sumT) //Division by 0 protection
chiSquare += math.pow(observedValue - expectedValue, 2) / expectedValue
Together with the 'Degree of Freedom', which is (rows − 1) × (columns − 1) , the P-value can be calculated.
In this case it is P-value: 0.02462
A P-value lower than 0.05 is considered to be significant. Statistically, women tend to choose a romantic movie more, while men prefer a non-romantic one.
Users have the option to choose a P-value, calculated from a standard table or through a math.ucla.edu - Javascript-based function (see references below).
Note that the population (10 men + 10 women = 20) is small, something to consider.
Either way, this principle is applied in the script, where conditions can be chosen like rsi, close, high, ...
🔹 CONDITION
Conditions are added to the left column ('CONDITION')
For example, previous rsi values (rsi ) between 0-100, divided in separate groups
🔹 CLOSE
Then, the movement of the last close is evaluated
UP when close is higher then previous close (close )
DOWN when close is lower then previous close
EQUAL when close is equal then previous close
It is also possible to use only 2 columns by adding EQUAL to UP or DOWN
UP
DOWN/EQUAL
or
UP/EQUAL
DOWN
In other words, when previous rsi value was between 80 and 90, this resulted in:
19 times a current close higher than previous close
14 times a current close lower than previous close
0 times a current close equal than previous close
However, the P-value tells us it is not statistical significant.
NOTE: Always keep in mind that past behaviour gives no certainty about future behaviour.
A vertical line is drawn at the beginning of the chosen population (max 4990)
Here, the results seem significant.
🔹 GROUPS
It is important to ensure that the groups are formed correctly. All possibilities should be present, and conditions should only be part of 1 group.
In the example above, the two top situations are acceptable; close against close can only be higher, lower or equal.
The two examples at the bottom, however, are very poorly constructed.
Several conditions can be placed in more than 1 group, and some conditions are not integrated into a group. Even if the results are significant, they are useless because of the group formation.
A population count is added as an aid to spot errors in group formation.
In this example, there is a discrepancy between the population and total count due to the absence of a condition.
The results when rsi was between 5-25 are not included, resulting in unreliable results.
🔹 PRACTICAL EXAMPLES
In this example, we have specific groups where the condition only applies to that group.
For example, the condition rsi > 55 and rsi <= 65 isn't true in another group.
Also, every possible rsi value (0 - 100) is present in 1 of the groups.
rsi > 15 and rsi <= 25 28 times UP, 19 times DOWN and 2 times EQUAL. P-value: 0.01171
When looking in detail and examining the area 15-25 RSI, we see this:
The population is now not representative (only checking for RSI between 15-25; all other RSI values are not included), so we can ignore the P-value in this case. It is merely to check in detail. In this case, the RSI values 23 and 24 seem promising.
NOTE: We should check what the close price did without any condition.
If, for example, the close price had risen 100 times out of 100, this would make things very relative.
In this case (at least two conditions need to be present), we set 1 condition at 'always true' and another at 'always false' so we'll get only the close values without any condition:
Changing the population or the conditions will change the P-value.
In the following example, the outcome is evaluated when:
close value from 1 bar back is higher than the close value from 2 bars back
close value from 1 bar back is lower/equal than the close value from 2 bars back
Or:
close value from 1 bar back is higher than the close value from 2 bars back
close value from 1 bar back is equal than the close value from 2 bars back
close value from 1 bar back is lower than the close value from 2 bars back
In both examples, all possibilities of close against close are included in the calculations. close can only by higher, equal or lower than close
Both examples have the results without a condition included (5 = 5 and 5 < 5) so one can compare the direction of current close.
🔶 NOTES
• Always keep in mind that:
Past behaviour gives no certainty about future behaviour.
Everything depends on time, cycles, events, fundamentals, technicals, ...
• This test only works for categorical data (data in categories), such as Gender {Men, Women} or color {Red, Yellow, Green, Blue} etc., but not numerical data such as height or weight. One might argue that such tests shouldn't use rsi, close, ... values.
• Consider what you're measuring
For example rsi of the current bar will always lead to a close higher than the previous close, since this is inherent to the rsi calculations.
• Be careful; often, there are na -values at the beginning of the series, which are not included in the calculations!
• Always keep in mind considering what the close price did without any condition
• The numbers must be large enough. Each entry must be five or more. In other words, it is vital to make the 'population' large enough.
• The code can be developed further, for example, by splitting UP, DOWN in close UP 1-2%, close UP 2-3%, close UP 3-4%, ...
• rsi can be supplemented with stochRSI, MFI, sma, ema, ...
🔶 SETTINGS
🔹 Population
• Choose the population size; in other words, how many bars you want to go back to. If fewer bars are available than set, this will be automatically adjusted.
🔹 Inputs
At least two conditions need to be chosen.
• Users can add up to 11 conditions, where each condition can contain two different conditions.
🔹 RSI
• Length
🔹 Levels
• Set the used levels as desired.
🔹 Levels
• P-value: P-value retrieved using a standard table method or a function.
• Used function, derived from Chi-Square Distribution Function; JavaScript
LogGamma(Z) =>
S = 1
+ 76.18009173 / Z
- 86.50532033 / (Z+1)
+ 24.01409822 / (Z+2)
- 1.231739516 / (Z+3)
+ 0.00120858003 / (Z+4)
- 0.00000536382 / (Z+5)
(Z-.5) * math.log(Z+4.5) - (Z+4.5) + math.log(S * 2.50662827465)
Gcf(float X, A) => // Good for X > A +1
A0=0., B0=1., A1=1., B1=X, AOLD=0., N=0
while (math.abs((A1-AOLD)/A1) > .00001)
AOLD := A1
N += 1
A0 := A1+(N-A)*A0
B0 := B1+(N-A)*B0
A1 := X*A0+N*A1
B1 := X*B0+N*B1
A0 := A0/B1
B0 := B0/B1
A1 := A1/B1
B1 := 1
Prob = math.exp(A * math.log(X) - X - LogGamma(A)) * A1
1 - Prob
Gser(X, A) => // Good for X < A +1
T9 = 1. / A
G = T9
I = 1
while (T9 > G* 0.00001)
T9 := T9 * X / (A + I)
G := G + T9
I += 1
G *= math.exp(A * math.log(X) - X - LogGamma(A))
Gammacdf(x, a) =>
GI = 0.
if (x<=0)
GI := 0
else if (x
Chisqcdf = Gammacdf(Z/2, DF/2)
Chisqcdf := math.round(Chisqcdf * 100000) / 100000
pValue = 1 - Chisqcdf
🔶 REFERENCES
mathsisfun.com, Chi-Square Test
Chi-Square Distribution Function

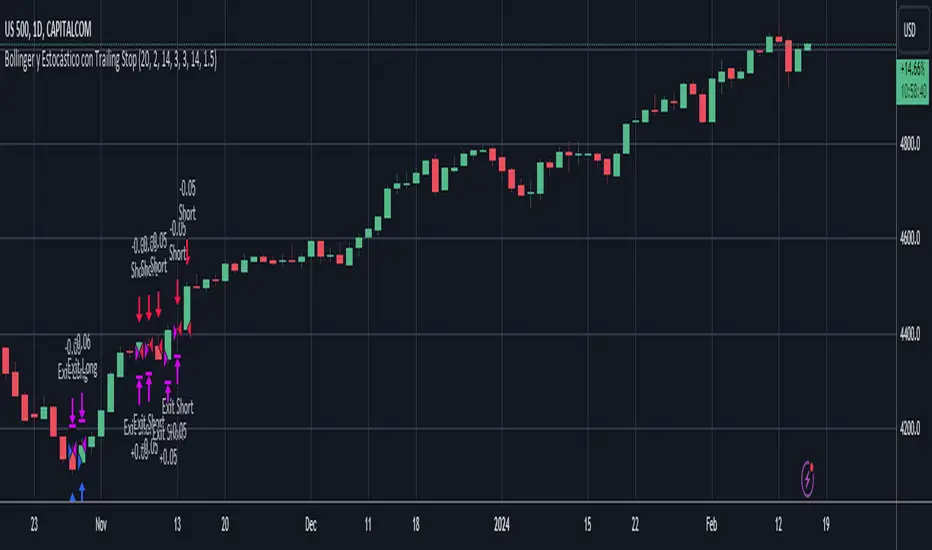
Bollinger and Stochastic with Trailing Stop - D.M.P.This trading strategy combines Bollinger Bands and the Stochastic indicator to identify entry opportunities in oversold and overbought conditions in the market. The aim is to capitalize on price rebounds from the extremes defined by the Bollinger Bands, with the confirmation of the Stochastic to maximize the probability of success of the operations.
Indicators Used
- Bollinger Bands Used to measure volatility and define oversold and overbought levels. When the price touches or breaks through the lower band, it indicates a possible oversold condition. Similarly, when it touches or breaks through the upper band, it indicates a possible overbought condition.
- Stochastic: A momentum oscillator that compares the closing price of an asset with its price range over a certain period. Values below 20 indicate oversold, while values above 80 indicate overbought.
Strategy Logic
- Long Entry (Buy): A purchase operation is executed when the price closes below the lower Bollinger band (indicating oversold) and the Stochastic is also in the oversold zone.
- Short Entry (Sell): A sell operation is executed when the price closes above the upper Bollinger band (indicating overbought) and the Stochastic is in the overbought zone.
RSI Divergence AlertsIndicator Description: RSI Divergence Alerts
The RSI Divergence indicator is a technical analysis tool that identifies divergences between the Relative Strength Index (RSI) and the price of an asset. The RSI is a momentum indicator that measures the speed and magnitude of recent changes in an asset's price, while divergences occur when there is a disparity between price movements and the RSI.
Indicator Customization:
Overbought and Oversold: The indicator allows you to customize the overbought and oversold levels of the RSI. This allows traders to adjust parameters according to their preferences and the historical behavior of the asset in question.
Indicator Settings and Recommended Adjustments:
Max Bar Distance: This parameter determines the maximum distance allowed between two low or high points for a divergence to be recognized. A higher value may result in more signals, but may also increase the number of false signals. It is recommended to adjust this value based on the volatility of the asset and the time period in which it is being traded.
RSI Length: This is the time period used to calculate the RSI. A longer period smoothes the indicator, while a shorter period makes it more sensitive to price changes. The default value is 14, but traders can adjust it based on their trading strategy and the asset's volatility.
RSI Overbought and Oversold: These values determine the levels at which the RSI is considered overbought and oversold, respectively. The default value for overbought is 75 and for oversold is 35. Traders can adjust these values according to the asset's volatility and its historical analysis. For example, in more volatile assets, it may be useful to use more extreme levels, such as 80 for overbought and 20 for oversold.
When adjusting indicator settings, traders must consider the balance between sensitivity and accuracy. Careful tuning of these parameters can help filter out false signals and identify more reliable trading opportunities.
The alerts functionality in this RSI Divergence indicator is designed to notify traders when a bearish divergence or a bullish divergence is detected. Here's how it works:
Conditionally Triggered Alerts:
Alerts are triggered based on the boolean variables bearishDivergence and bullishDivergence.
If bearishDivergence is true, it indicates that a bearish divergence has been detected.
If bullishDivergence is true, it indicates that a bullish divergence has been detected.
Alert Message:
When a divergence is detected, an alert message is generated to inform the trader about the event.
The message includes details about the divergence, such as the difference in the RSI value between the two points forming the divergence.
For example, for a bearish divergence, the message will include the phrase "Bearish RSI Divergence Detected" and the RSI difference between the high and low points of the divergence.
Alert Frequency:
Alerts are configured to be triggered once per bar close (alert.freq_once_per_bar_close), which means the alert will only be sent once at the close of each bar.
This helps to avoid multiple alerts for the same divergence during the same time period.
Additional Alert Conditions:
In addition to conditionally triggered alert messages, alert conditions are defined for both bearish and bullish divergences.
These alert conditions are useful for configuring custom alerts on trading platforms that support running Pine Script code.
Overall, this alert functionality allows traders to stay informed about potential trading opportunities based on divergences detected by the indicator. This can help traders make faster and more informed decisions in their trading processes.

DOUBLE RSI+MA ALERTS SETUPThis is an indicator that provides two verses of relative force indices (RSI) - an RSI Rapid and an RSI Normal, but as moving media (MA) applied with an RSI Rapid for suavização.
Rapid RSI and Normal RSI:
Or RSI is a momentum indicator that mediates the speed and alteração of preço movements of an ativo. No script, we calculate the RSI variations:
O RSI Rápido, com um período configurável que por padrão é but curto (5 períodos), para reactor but quickly to these mudanças no preço.
Or RSI Normal, with a configured period, but with a maximum value (14 periods), proportionate to an analysis but correct.
Media Móvel do RSI Rápido:
We have a simple mobile media (SMA) application with RSI Rapido, using the same number of times as RSI to monitor variations and facilitate viewing of the direction of the trend.
Levels of Overbought and Oversold:
These are the levels of overbought (sobrevendido) and oversold (sobrecomprado). Therefore, the overbought level is set at 80 and the overbought level is 20, depending on the classic RSI settings.
Alert Conditions:
Criamos alert conditions to inform you when the RSI of each type is ultrapassed or they are not defined as overbought and oversold. Assim, we can be notified of potential entry points or conditions based on these extreme market conditions. These messages are personalized to ensure that you quickly identify when the RSI has disappeared or alerted you if it is an overbought or oversold condition.
Visualization Graphic:
The indicator plots as RSI Rapid and RSI Normal lines not graphically for visual analysis, but with horizontal lines indicating the level of overbought and oversold. A cor dessas linehas éjustável para clareza.
Informative Table:
The tab is added to the lower side of the graphic fornecendo values at the real time of the RSI Fast as the RSI Normal, making it easier to visualize quickly and to compare unless it is necessary to print directly for the graphic.
This script has a powerful ferrament for operators that provides integrated analysis of RSI into its strategies, offering flexibility to monitor the dynamics of the preço and different tempo scales. Personal alerts are particularly important to be aware of marketing conditions without the need for constant monitoring. Algum additional functionality that you find useful or extra personalization that you want?

AI SuperTrend x Pivot Percentile - Strategy [PresentTrading]█ Introduction and How it is Different
The AI SuperTrend x Pivot Percentile strategy is a sophisticated trading approach that integrates AI-driven analysis with traditional technical indicators. Combining the AI SuperTrend with the Pivot Percentile strategy highlights several key advantages:
1. Enhanced Accuracy in Trend Prediction: The AI SuperTrend utilizes K-Nearest Neighbors (KNN) algorithm for trend prediction, improving accuracy by considering historical data patterns. This is complemented by the Pivot Percentile analysis which provides additional context on trend strength.
2. Comprehensive Market Analysis: The integration offers a multi-faceted approach to market analysis, combining AI insights with traditional technical indicators. This dual approach captures a broader range of market dynamics.
BTC 6H L/S Performance
Local
█ Strategy: How it Works - Detailed Explanation
🔶 AI-Enhanced SuperTrend Indicators
1. SuperTrend Calculation:
- The SuperTrend indicator is calculated using a moving average and the Average True Range (ATR). The basic formula is:
- Upper Band = Moving Average + (Multiplier × ATR)
- Lower Band = Moving Average - (Multiplier × ATR)
- The moving average type (SMA, EMA, WMA, RMA, VWMA) and the length of the moving average and ATR are adjustable parameters.
- The direction of the trend is determined based on the position of the closing price in relation to these bands.
2. AI Integration with K-Nearest Neighbors (KNN):
- The KNN algorithm is applied to predict trend direction. It uses historical price data and SuperTrend values to classify the current trend as bullish or bearish.
- The algorithm calculates the 'distance' between the current data point and historical points. The 'k' nearest data points (neighbors) are identified based on this distance.
- A weighted average of these neighbors' trends (bullish or bearish) is calculated to predict the current trend.
For more please check: Multi-TF AI SuperTrend with ADX - Strategy
🔶 Pivot Percentile Analysis
1. Percentile Calculation:
- This involves calculating the percentile ranks for high and low prices over a set of predefined lengths.
- The percentile function is typically defined as:
- Percentile = Value at (P/100) × (N + 1)th position
- Where P is the desired percentile, and N is the number of data points.
2. Trend Strength Evaluation:
- The calculated percentiles for highs and lows are used to determine the strength of bullish and bearish trends.
- For instance, a high percentile rank in the high prices may indicate a strong bullish trend, and vice versa for bearish trends.
For more please check: Pivot Percentile Trend - Strategy
🔶 Strategy Integration
1. Combining SuperTrend and Pivot Percentile:
- The strategy synthesizes the insights from both AI-enhanced SuperTrend and Pivot Percentile analysis.
- It compares the trend direction indicated by the SuperTrend with the strength of the trend as suggested by the Pivot Percentile analysis.
2. Signal Generation:
- A trading signal is generated when both the AI-enhanced SuperTrend and the Pivot Percentile analysis agree on the trend direction.
- For instance, a bullish signal is generated when both the SuperTrend is bullish, and the Pivot Percentile analysis shows strength in bullish trends.
🔶 Risk Management and Filters
- ADX and DMI Filter: The strategy uses the Average Directional Index (ADX) and the Directional Movement Index (DMI) as filters to assess the trend's strength and direction.
- Dynamic Trailing Stop Loss: Based on the SuperTrend indicator, the strategy dynamically adjusts stop-loss levels to manage risk effectively.
This strategy stands out for its ability to combine real-time AI analysis with established technical indicators, offering traders a nuanced and responsive tool for navigating complex market conditions. The equations and algorithms involved are pivotal in accurately identifying market trends and potential trade opportunities.
█ Usage
To effectively use this strategy, traders should:
1. Understand the AI and Pivot Percentile Indicators: A clear grasp of how these indicators work will enable traders to make informed decisions.
2. Interpret the Signals Accurately: The strategy provides bullish, bearish, and neutral signals. Traders should align these signals with their market analysis and trading goals.
3. Monitor Market Conditions: Given that this strategy is sensitive to market dynamics, continuous monitoring is crucial for timely decision-making.
4. Adjust Settings as Needed: Traders should feel free to tweak the input parameters to suit their trading preferences and to respond to changing market conditions.
█Default Settings and Their Impact on Performance
1. Trading Direction (Default: "Both")
Effect: Determines whether the strategy will take long positions, short positions, or both. Adjusting this setting can align the strategy with the trader's market outlook or risk preference.
2. AI Settings (Neighbors: 3, Data Points: 24)
Neighbors: The number of nearest neighbors in the KNN algorithm. A higher number might smooth out noise but could miss subtle, recent changes. A lower number makes the model more sensitive to recent data but may increase noise.
Data Points: Defines the amount of historical data considered. More data points provide a broader context but may dilute recent trends' impact.
3. SuperTrend Settings (Length: 10, Factor: 3.0, MA Source: "WMA")
Length: Affects the sensitivity of the SuperTrend indicator. A longer length results in a smoother, less sensitive indicator, ideal for long-term trends.
Factor: Determines the bandwidth of the SuperTrend. A higher factor creates wider bands, capturing larger price movements but potentially missing short-term signals.
MA Source: The type of moving average used (e.g., WMA - Weighted Moving Average). Different MA types can affect the trend indicator's responsiveness and smoothness.
4. AI Trend Prediction Settings (Price Trend: 10, Prediction Trend: 80)
Price Trend and Prediction Trend Lengths: These settings define the lengths of weighted moving averages for price and SuperTrend, impacting the responsiveness and smoothness of the AI's trend predictions.
5. Pivot Percentile Settings (Length: 10)
Length: Influences the calculation of pivot percentiles. A shorter length makes the percentile more responsive to recent price changes, while a longer length offers a broader view of price trends.
6. ADX and DMI Settings (ADX Length: 14, Time Frame: 'D')
ADX Length: Defines the period for the Average Directional Index calculation. A longer period results in a smoother ADX line.
Time Frame: Sets the time frame for the ADX and DMI calculations, affecting the sensitivity to market changes.
7. Commission, Slippage, and Initial Capital
These settings relate to transaction costs and initial investment, directly impacting net profitability and strategy feasibility.

Stochastic Levels on Chart [MisterMoTA]The values of the Stochastic Levels on Chart indicator are calculated using Reverse Engineering calculations starting from default Stochastic formula : 100 * (close - lowest(low, length)) / (highest(high, length) - lowest(low, length)).
I added options for users to define the Extreme Overbought and Oversold values, also simple Oversold and Overbought values of the stochastic, default Extreme Overbought at 100, Extreme Oversold at 0, the 20 for Oversold and 80 as Overbought, plus the middle stochastic level = 50.
The script has included a color coded 20 SMA that will turn red when the 20 SMA is falling and green when it is rising, also there are bollinger bands using 2 standard deviation plus an extra top and bottom bollinger bands with a 2.5 standard deviation.
The users can use Stochastic Levels on Chart along with a simple Stochastic or a Stochastic Rsi indicator, when the price on chart touching extreme levels and Stochastic or Stochastic Rsi K line crossing above or bellow D line users can see on chart the levels where price need to close for getting stochastic overbought or oversold.
In the demo chart we can see at daily stochastic crossed down and the price crossed down all the levels displayed on chart, and same before stochastic was crossing up from oversold and price crossed up the stochastic levels displayed on chart.
In strong bullish moves the Extreme level 100 of the stochastic will be pushed higher, same in a strong bearish move the Extreme Oversold 0 level will be pushed lower, so users need to wait for confirmation of a crossover between K and D lines of stochastic that will signalize a pullback or a reverse of the trend.
For better results you will need to add a dmi or an adx or other indicator that will show you trend strength.
If you have any questions or suggestions to improve the script please send me a PM.

Donchian Channels StrengthTL;DR - A different approach calculating strength based on Donchain channels
My approach calculating strength by using the difference between price and donchain average. It is possible to use the highest/lowest value of a given source (like close) or to use the highest high/lowest low (by using the option 'include wicks') for the strength calculation
I added multiple moving averages which can be used in the calculations incl. SMMA (RMA) which is used in RSI calculation and works best for me.
Usage is similar to RSI: DC Strength oscillates between 0 and 100. Low values (<20) indicate a bearish situation while high values (>80) indicate bullish ones. Center line (50) crossings can also indicate a possible trend change.

Best scalping toolExplanation:
This script is a comprehensive indicator that combines three essential technical analysis tools: Money Flow Index (MFI), Relative Strength Index (RSI), and Bollinger Bands (Bollinger %B). It provides insights into market conditions related to cross points of mfi,rsi and B%B.
A buy condition is created when the last candle RSI and MFI are under the bollinger bands, and then in the actual candle the RSI cross up the bollinger low band.
A sell condition is created when the last candle RSI and MFI are above the bollinger bands, and then in the actual candle the RSI cross down the bollinger high band.
Key Components:
MFI (Money Flow Index):
Utilizes the MFI indicator based on a specified length.
Overbought and oversold levels (80 and 20, respectively).
RSI (Relative Strength Index): (Adapted to the mfi chart)
Allows selection of different moving average types (SMA, EMA, etc.) for the RSI calculation.
RSI along with upper and lower bands (70 and 30).
Bollinger Bands:
Provides upper and lower Bollinger Bands based on the RSI's standard deviation.
Visualization Options:
Allows the user to choose between show the buy (green arrow) and the sell (red arrow) .
How It Works:
The indicator amalgamates these three powerful technical indicators to help traders identify potential entry or exit points. The green arrow its a buy signal and the red arrow is a sell signal.
By offering configurable settings and clear visual cues, this indicator assists traders in recognizing critical market conditions and potential trading opportunities.
Disclaimer: This indicator should be used as a tool in a broader trading strategy and not solely for making trading decisions. It's recommended to combine it with other technical or fundamental analysis for comprehensive trading decisions.

Stochastic Trend Evaluator (STE)Stochastic Trend Evaluator (STE): Detailed Description
Overview :
The Stochastic Trend Evaluator (STE) is a sophisticated trading tool designed for TradingView that combines stochastic oscillation analysis with Exponential Moving Average (EMA) trends. It is tailored to assist traders in identifying potential buy and sell opportunities in various market conditions, particularly focusing on trend reversals and momentum shifts.
Functionality & Concept :
The STE is built on two core components – the Stochastic Oscillator and the 200-period EMA.
Stochastic Oscillator :
This oscillator is a momentum indicator comparing a particular closing price of a security to a range of its prices over a certain period.
Settings:
- %K Length: 14
- %K Smoothing: 3
- %D Smoothing: 3
The %K line is the main line indicating momentum, while the %D line is a moving average of %K, providing signal triggers.
200 EMA :
The 200-period EMA serves as a dynamic trend indicator.
It helps in distinguishing between bullish and bearish market phases.
A closing price above the 200 EMA suggests a bullish trend, while below it indicates a bearish trend.
Signal Generation :
STE generates signals based on the interaction between the Stochastic Oscillator and the 200 EMA.
Buy Signal :
Occurs when the stochastic %K crosses above 20 (indicative of oversold conditions), and the closing price is above the 200 EMA.
Represented visually by green label-up arrows.
Sell Signal :
Triggered when the stochastic %K crosses below 80 (suggestive of overbought conditions), and the closing price is below the 200 EMA.
Indicated by red label-down arrows.
Background Color Indicator :
The background color of the chart changes to enhance visual interpretation of the market condition.
Green background for a bullish market scenario (when a buy signal is active).
Red background for a bearish market scenario (when a sell signal is active).
Usage Guidelines :
The STE is best used in markets that exhibit clear trends.
Ideal for traders focusing on medium to long-term trade setups.
Can be used in conjunction with other indicators for confirmation and risk management.
Note : The STE, being a proprietary tool, is based on a unique blend of standard technical analysis concepts and custom logic to provide these trading signals. It is designed to give traders a comprehensive view of the market momentum and trend strength without revealing the intricate details of its algorithm.

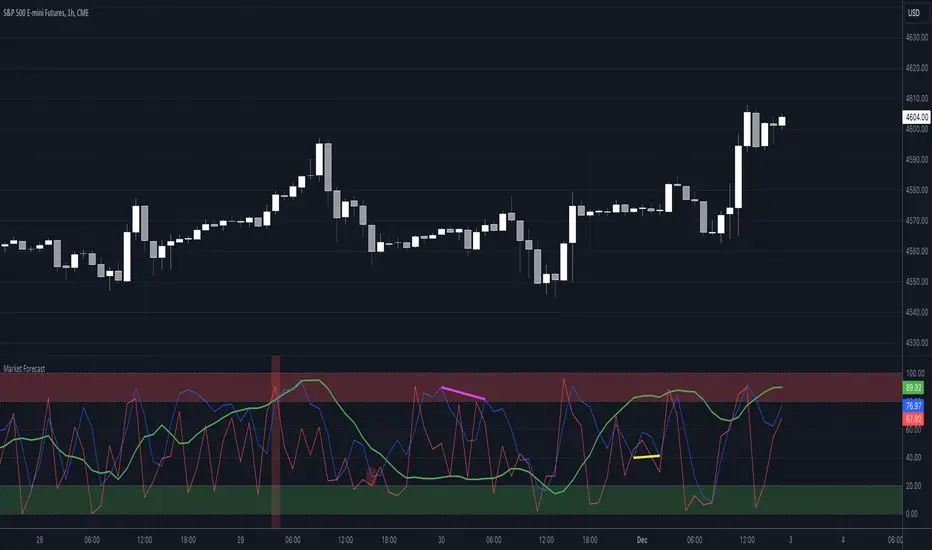
Market Forecast w/ Signals [QuantVue]The Market Forecast With Signals Indicator is an upgraded version of the popular ThinkorSwim platforms Market Forecast. This upgraded version utilizes stochastic oscillators, moving averages, and momentum calculations to find potential buying and selling opportunities.
Stochastic Oscillator
The indicator calculates three variations of the Fast Stochastic Oscillator for different time periods:
🔹Intermediate: Calculated over a medium-term period (default 31 bars).
🔹Momentum: Calculated over a short-term period (default 5 bars).
🔹Near Term: Calculated over a very short-term period (default 3 bars).
These calculations involve finding the highest and lowest values within their respective periods and comparing the current close to this range.
Moving Average Smoothing
The results of the Fast Stochastic Oscillator for the Intermediate and Near Term are then smoothed using a Simple Moving Average (SMA):
🔹Intermediate: 5-period SMA of the Intermediate Stochastic Oscillator.
🔹Near Term: 2-period SMA of the Near Term Stochastic Oscillator.
Momentum Indicator
A custom momentum calculation is performed, using the recent high and low prices over four periods.
Display
The indicator plots the smoothed Intermediate, Near Term, and custom Momentum calculations as separate lines on the chart.
Trading Signals
While the original indicator plots the lines mentioned above, the Market Forecast w/ Signals goes a step further by identifying key moments when nuanced signals fire. The built in alerts and visual aids make spotting these trading opportunities a breeze.
Clusters - Bullish and Bearish clusters are identified based on the convergence of all three lines (Intermediate, Near, and Momentum) above 80 (Bearish) or below 20 (Bullish).
The background color of the chart changes to indicate these clusters, aiding in quick identification of market extremes.
Trend Reversals - Marked with labels on the chart, this is based on the direction of the cluster (bullish or bearish) and the subsequent price movement crossing a threshold determined during the cluster formation.
Divergences - Divergences between the Near Term line and price highs/lows are detected using pivot points. These divergences are then plotted as lines on the chart, highlighting potential discrepancies between price action and momentum, which can signal reversals.
Indicator Features:
🔹Custom Colors
🔹Show/Hide Signals
🔹Alerts
Give this indicator a BOOST and COMMENT your thoughts!
We hope you enjoy.
Cheers!
RSI Bands + Levels (Miu)This indicator was designed to plot lines from prices of overbought (OB) and oversold (OS) RSI levels in chart. It will also create a visible band between these levels.
It's main utility is to show in chart current and past prices for OB/OS RSI levels. Traditionally the RSI is considered overbought when above 70 and oversold when below 30 but you can customize these values in settings. The RSI oscillates between zero and 100.
Users can easily identify overbought and oversold prices using this indicator and then it is expected to help users to make better strategic decisions with their trades.
There are some extra options available in settings:
- Customizable RSI levels
- Customizable RSI length
- RSI Levels: if activated, it will draw lines above OB line and below OS line according to the multiplier, so it will plot sequential lines that goes in different RSI levels (e.g: RSI 72, 74, 76, 78 and 80).
- Backgroud only: it will remove these lines and keep only a backgroung color instead
- RSI 50: it will draw a line as RSI 50
- Customizable multiplier
Enjoy!

The Ultimate Buy and Sell IndicatorThis indicator should be used in conjunction with a solid risk management strategy that does not over-leverage positions and uses stop-losses. You can not rely 100% on the signals provided by this indicator (or any other for that matter).
With that said, this indicator can provide some excellent signals.
It has been designed with a large number of customization options intended for advanced traders, but you do not HAVE to be an advanced user to simply use the indicator. I have tried to make it easy to understand, and this section will provide you with a better understanding of how to use it.
NOTE:
While NOT REQUIRED, I would recommend also finding my indicator called, "Ultimate RSI", which is designed to work together with this indicator (visually). They both contain the same settings and allow you to visualize changes made in this indicator that can not be displayed on the main chart.
This indicator creates it's own candles(bars), so you have to go into your main settings and turn off the "body, border and wick" color settings. Using a dark background is also recommended.
How does it work?
The indicator mainly relies on the RSI indicator with Bollinger Bands for signals. (Though not entirely)
First, there are something that I call "Watch Signals", which are various Bollinger Band crossing events. This could be the price crossing Bollinger Bands or the RSI crossing Bollinger Bands.
There are separate watch signals for buys and sells. Buy watch signals are colored orange to match the BUY signal candle color and Fuchsia (kind of a bright purple) to match SELL signal candles.
In order for most buy or sell signals to be created, there must first be a watch signal. There is a lookback period (or length) for watch signals to be used, and after that many candles (bars) have passed, they will be ignored. You can set a length to look back as well as a time to wait before creating any.
What this means is that if there has previously been (for instance) a sell signal. You can tell it to wait 10 bars before creating any buy watch signals. You can then also tell it that it should look back 10 bars from the current one in order to find any buy watch signals. This means that if you had it set up that way 10 to wait and 10 to validate, it would start allowing buy watch signals 11 bars after a sell, and then once you hit 20 bars, it will start leaving a gap (invisible to you) as the 10 bar lookback period starts moving forward with each new bar. This is useful in order to keep signals more spaced apart as some bad signals come quickly after another one.
Example: You may get a sell signal where the Bollinger bands are tight, then the price easily drops down into the lower band creating a buy watch signal, then you get a "fake" or short pump up and it says buy, but then drops dramatically afterwards. The wait period can ensure that the sell stays in effect longer before a buy is considered by blocking any buy watch signals for a period of time.
After you get a watch signal, the system then looks for various other things to happen to create buy or sell signals. This could be the RSI crossing the (slow) RSI Basis line (from its Bollinger bands), it could be the price crossing its basis line, it could be MACD crosses, it could even be RSI crossing certain levels. All of these are options. If you like the MACD strategy and want it to give you buy and sell signals from just MACD crosses, simply select that option for signals.
It is also able to use the first of any of the options that takes place.
I included an option to force alternating buy and sell signals, rather than showing groups of, or subsequent buy, buy, buy signals, for instance.
Moving on....
You can change the moving average that is used to calculate the RSI. The standard moving average for RSI is the RMA (aka SWMA). Changes to this can dramatically change your signals. You also have the option to change the moving average type used in the Bollinger bands calculation. You can change the length of these as well. The same goes for the Bollinger bands over the Price chart. I added an ATR option for the RSI Bollinger bands to play with, as well. You are able to adjust the standard deviation (multiplier) of the bands as well, which will of course affect the signals.
The ways you can play with signals are nearly infinite, so have fun figuring it out.
The indicator allows for moving averages to be shown as well, with a variety of types to choose from. The standard numbers are 5, 10, 20, 50, 100 and 200, with the addition of a custom moving average of your choice. You can also change the color of this one. You can choose to show them all or any of them you want to show, in any combination, although the TYPE of moving average (SMA, EMA, WMA, etc.) will apply to all of them.
You may also notice the Bollinger Bands over the Price are colored, and become more or less transparent.
The color is derived from the trend of the RSI or the RSI basis (your choice). It looks back at the value however many bars you want and compares the values and that's how it determines if it is trending up or down. Since RSI is a directional momentum indicator, this can be quite useful. If you see the bands are getting darker, this will explain why.
The indicator has a lookback period for determining the widest the bands (which measure volatility) have been over that period of time. This is the baseline. It then will make the bands disappear (by making them more transparent) if the volatility is low. This indicates that a change in volatility is coming and that price isn't really changing much compared to the past (default 500) bars. If they become bright, this is because price has started trending in a direction and volatility is increasing.
I should also note that the candles are colored based on RSI levels.
If you use the Ultimate Companion indicator, you will be able to see the RSI levels (zones) that the colors are based on. As RSI moves into a new range, the candle color will change.
I have created a yellow zone where the candles turn yellow. This is when RSI is between (default) 45 and 55, indicating there is basically no momentum and price is going sideways. This is a good place to get trapped in bad trades, and there is a Yellow RSI Filter to block signals in this area to keep you from entering bad trades.
Green candles indicate values over 55 (getting brighter as RSI rises) and red candles are RSI values under 45 (getting brighter as RSI values get lower). If you see white, this means RSI is either over 80 or under 20. A sharp reversal is almost always imminent at this stage.
When we talk about Buy and Sell Signals, they draw a green or red triangle and it literally says BUY or SELL. There is an option to color the background for added visibility. These signals do not "repaint", what this means is that they can be late. To account for this, I have included a background color that will flash as a warning that a buy or sell could be imminent, although it may fail to break through and set a buy or sell signal. This is simply an advanced warning. The reason is that sometimes a candle may be very large and you won't be told to buy or sell during the candle until the move is completely over and now you're getting in on the next one. That's not a great feeling, so I made it repaint the background color and not repaint the completed signal. You get the best of both worlds.
This indicator also uses complex logic to handle things.
When there is a buy signal, it enters into a state of having been bought, or a "bought state". The same for sells. If Force alternating signals is off, you could have more than one buy in a bought state, or more than one sell in a sell state. There is an option to color the background green during the full duration of a bought state, or red during the full duration of a sold state.
I have added divergence.
This shows that the lows or highs of RSI and PRICE are different. If RSI is making higher highs but the price is not, then the price is likely to follow this bullish divergence, if the opposite happens, it's bearish. It will draw a line on the chart connecting the highs and lows and call it bearish or bullish. You can adjust this as well.
I have an RSI High/Low filter. If the RSI basis (or average) is very high or low, you can block signal from this area since the price is likely to continue in that direction before actually reversing.
You can change the settings of the MACD if you choose to use it for signals, and if you want to see it, you'll have to run that indicator below the chart and match the settings to see what is going on, just like the RSI.
Going back to Watch Signals. You can also choose to require more than one watch signal if you choose. You can skip watch signals, so it will ignore the first or second one, whatever you want to do. You can color the background to show you where watch signals have been skipped.
Regarding the wait period for creating watch signals after a sell or after a buy, you can also color the background to see where these were blocked by the wait period.
Lastly you can choose which type of watch signals to use, or keep them from being shown on the chart. This allows you to study the history of how the asset you are trading behaves and customize the behavior of signals based on your study of it.
Everything in the settings area has tooltips, which will explain what that thing does to help you along this journey.
I hope this indicator (and perhaps Ultimate RSI alongside this) will help you take your trading to the next level.

Statistics TableStrategy Statistics
This library will add a table with statistics from your strategy. With this library, you won't have to switch to your strategy tester tab to view your results and positions.
Usage:
You can choose whether to set the table by input fields by adding the below code to your strategy or replace the parameters with the ones you would like to use manually.
// Statistics table options.
statistics_table_enabled = input.string(title='Show a table with statistics', defval='YES', options= , group='STATISTICS')
statistics_table_position = input.string(title='Position', defval='RIGHT', options= , group='STATISTICS')
statistics_table_margin = input.int(title='Table Margin', defval=10, minval=0, maxval=100, step=1, group='STATISTICS')
statistics_table_transparency = input.int(title='Cell Transparency', defval=20, minval=1, maxval=100, step=1, group='STATISTICS')
statistics_table_text_color = input.color(title='Text Color', defval=color.new(color.white, 0), group='STATISTICS')
statistics_table_title_cell_color = input.color(title='Title Cell Color', defval=color.new(color.gray, 80), group='STATISTICS')
statistics_table_cell_color = input.color(title='Cell Color', defval=color.new(color.purple, 0), group='STATISTICS')
// Statistics table init.
statistics.table(strategy.initial_capital, close, statistics_table_enabled, statistics_table_position, statistics_table_margin, statistics_table_transparency, statistics_table_text_color, statistics_table_title_cell_color, statistics_table_cell_color)
Sample:
If you are interested in the strategy used for this statistics table, you can browse the strategies on my profile.

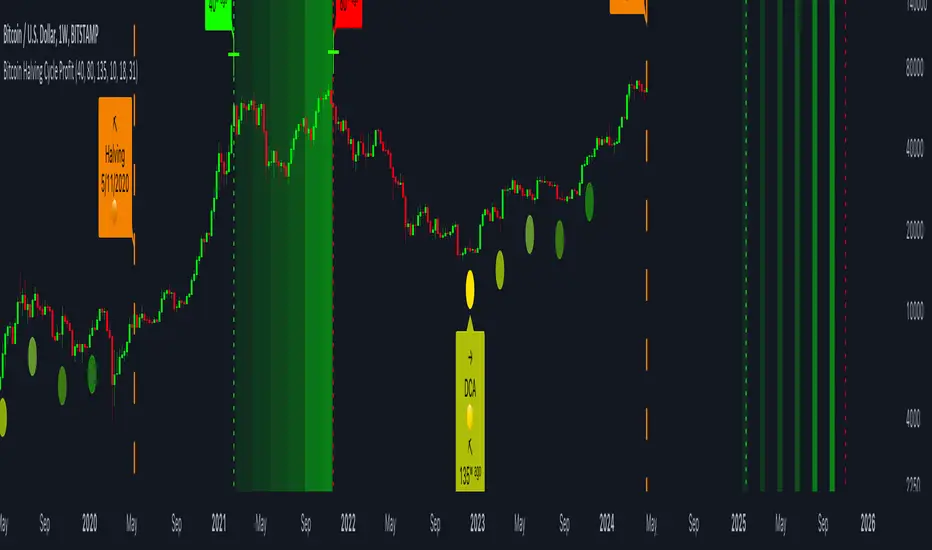
Bitcoin Halving Cycle ProfitThe Bitcoin Halving Cycle Profit indicator, developed by Kevin Svenson , unveils a consistent and predetermined profit-taking cycle triggered by each Bitcoin halving event. This indicator streamlines the analysis of halving occurrences, providing explicit signals for both profit-taking and Dollar-Cost Averaging strategies.
Following each Bitcoin halving event, a fixed number of weeks consistently mark the period of maximum profitability for profit-taking:
🔄 Halving Cycle Profit Timeline Explained:
• 40 Weeks (Post-Halving) = Start of the optimal profit-taking zone.
• 80 Weeks (Post-Halving) = "Last Call" for profit-taking before the onset of a bear market.
• 125 Weeks (Post-Halving) = The optimal timeframe to begin Dollar-Cost Averaging.
(Bitcoin Weekly Chart using Halving Cycle Profit)
One standout feature of this indicator is its inherent clarity and comprehensive labeling. This quality makes it exceptionally easy to discern the locations of key factors and turning points, enhancing your understanding of the market dynamics it highlights.
(Bitcoin Daily Chart using Halving Cycle Profit)
🚀 This indicator doesn't limit its effectiveness to just Bitcoin; it seamlessly integrates with top blue-chip altcoins like Ethereum and most household names in the crypto industry.
( Ethereum Weekly Chart using Halving Cycle Profit)
🛠️ Customizable display options are availible. Users have the flexibility to toggle/adjust labels, lines, and color fills according to their preferences.
📑 In summary, the Bitcoin Halving Cycle Profit indicator is a versatile and user-friendly tool, offering clarity and customization for traders navigating both Bitcoin and top altcoins.
⚠️ It's important to note that while the Bitcoin Halving Cycle Profit indicator provides historical insights, past performance does not guarantee future results. Timing profitability in the cryptocurrency market involves inherent risks, and this indicator should not be construed as financial advice. Users are encouraged to exercise caution, conduct thorough research, and make informed decisions based on their individual risk tolerance and financial goals.
[blackcat] L3 SuperJThe SuperJ indicator is a powerful tool that utilizes VWMA (Volume Weighted Moving Average) and ALMA (Arnaud Legoux Moving Average) to filter and enhance the KDJ indicator, resulting in a smoother J line and the creation of the SuperJ indicator. By incorporating TVMA (Triggered Volume Moving Average), the SuperJ indicator can generate trigger signals that can form bullish and bearish crossovers with the J line, creating an oscillating pattern.
The combination of VWMA and ALMA helps to remove noise from the market and provides clearer trading signals. This is particularly useful when the market is highly volatile or the trend is ambiguous. The oscillations of the J line can help traders identify the true trend and avoid being misled by false signals.
Furthermore, by considering the values and trends of the J line in conjunction with other technical analysis tools, traders can make more accurate assessments of market trends and price movements. For example, when combined with moving averages, the SuperJ indicator can enhance the ability to identify price reversal points.
The SuperJ indicator also offers benefits in assessing overbought and oversold conditions in the market. By observing the values and trends of the J line, traders can more accurately evaluate market sentiment and strength. When the J line is above 80, it may indicate an overly optimistic market with a risk of overbought conditions. Conversely, when the J line is below 20, it may indicate an overly pessimistic market with an opportunity for oversold conditions. These signals can assist traders in determining when to buy or sell.
In summary, the SuperJ indicator, derived from the combination of VWMA, ALMA, and TVMA, provides traders with a valuable tool for identifying overbought and oversold conditions, predicting price reversals, and generating high-quality trading signals. Its application as a "buy low, sell high" strategy element is highly effective in maximizing trading opportunities and optimizing profitability.

Machine Learning: MFI Heat Map [YinYangAlgorithms]Overview:
MFI Heat Maps are a visually appealing way to display the values of 29 different MFIs at the same time while being able to make sense of it. Each plot within the Indicator represents a different MFI value. The higher you get up, the longer the length that was used for this MFI. This Indicator also features the use of Machine Learning to help balance the MFI levels. It doesn’t solely rely upon Machine Learning but instead incorporates a growing length MFI averaged with the Machine Learning MFI at any given index.
For instance, say we are calculating the 10th plot from the bottom, the MFI would be an average of:
MFI(source, 11)
Machine Learning MFI at Index of 10
We do it this way as they both help smooth each other out without relying solely on just one calculation method.
Due to plot limitations, you are capped at 28 Plot Amounts within this indicator, but that is still quite a bit of information you can glean from a Heat Map.
The Machine Learning used in this indicator is of the K-Nearest Neighbor (KNN). It uses a Fast and Slow MFI calculation then sorts through them over Machine Learning Length and calculates the differences between them. It then slices off KNN length to create our Max/Min Distances allotted. It adds the average between Fast and Slow MFIs to a Viable Distances array if their distances are within the KNN Min/Max distance. It then averages all distances in the Viable Distances array and returns the result.
The result of the KNN Function is saved to another ML Data array whose length is that of Plot Amount (Heat Map Size). This way each Index of the ML Data array can be indexed according to the Heat Map Size.
The Average of the ML Data array is the MFI line (white) that you’ll see plotted on the Indicator. There is also the SMA of the MFI Average (orange) which is likewise plotted. These plots allow you to visualize where the ML MFI is sitting and can potentially be useful for seeing when the MFI Average and SMA cross over and under each other.
We’ve heard many people talk highly of RSI, but sadly not too many even refer to MFI. MFI oftentimes may be overlooked, especially with new traders who may not even know what it is. Essentially MFI is an RSI but it also incorporates Volume into its calculations, which in our opinion leads to a more accurate reading; afterall, what is price movement without Volume.
Tutorial:
You may be thinking, this Indicator looks appealing to the eye, but how do I benefit from it trading wise?
Before we get into our visual examples, let's talk briefly about what makes Heat Maps in general a useful tool for trading. Heat Maps give us the ability to visualize and understand lots of data while removing the clutter. We can understand the data of 29 different MFIs without having to look at and decipher 29 different MFI plots. When you overlay too many MFI lines on top of each other, they can be very difficult to read and oftentimes end up actually hindering your Technical Analysis. For this reason, we have a simple solution to this problem; Heat Maps. This MFI Heat Map allows you to easily know (in a relative %) what the MFI level is for varying lengths. For Instance, the First (bottom) plot indexes an MFI of (K(0) (loop of Plot Amount) + Smoothing Length (default 1)) = 1. Since this is indexing (usually) a very low length, it will change much quicker. Whereas the Last (top) plot indexes an MFI of (K(27) (loop of Plot Amount) + Smoothing Length (default 1)) = 28. This is indexing a much higher length of MFI which results in the MFI the higher you go up in the Heat Map to move much slower.
Heat Maps give us the ability to see changes happening over multiple MFIs at the same time, which can be very useful for seeing shifts in MFI / Momentum. Remember, MFI incorporates Volume, so even if the price goes up a lot, if there was low volume, the MFI won’t move as much as an RSI would. However, likewise, if there is high volume but low price movement, the MFI will move slightly more than the RSI.
Heat Maps change color based on their MFI level. If the MFI is >= 90 it is HOT (red), if the MFI <= 9 it is COLD (teal, think of ICE). Green represents an MFI of 50-59 and Dark Blue represents an MFI of 40-49. Green and Dark blue are the most common colors as all the others are more ‘Extreme’ MFI levels.
Okay, time to get to the Examples :
Since there is so much going on in Heat Maps, we’ve decided to focus this tutorial to this specific area and talk about individual locations before talking about it as a whole.
If you refer to the example above where there are 2 white circles; these white circles are highlighting a key location you’ll be wanting to identify within your Heat Maps, many things are happening here:
The MFI crossed over the SMA (bullish).
The Heat Map started changing from mid/dark Blue (30-50 MFI) to Green (50-59 MFI) around the midline (the 50% dashed like).
The Lower levels of the Heat Map are turning Yellow/Orange/Red (60-100 MFI).
The Upper Levels of the Heat Map are still Light Blue - Green (10-50 MFI).
The 4 Key points above, all point towards potential Bullish Momentum changes. You’re likely wondering, but why? Let's discuss about each one in more specific detail:
1. The MFI crossed over the SMA (bullish): What this tells us is that the current MFI Average is now greater than its average over the last (default) 16 bars. This means there's been a large amount of Money Flow (Price and Volume) recently (subjectively based on the last (default) 16 average). This is one of the leading Bullish / Bearish signals you will see within this Indicator. You can enable Signals within the Settings and/or even add Alerts for when these crossings occur.
2. The Heat Map started changing from mid/dark Blue (30-50 MFI) to Green (50-59 MFI) around the midline (the 50% dashed like): This shows us that the index’s in the mid (if using all 28 heat map plots it would be at 14) has already received some of this momentum change. If you look at the second white circle (right), you’ll also notice the higher MFI plot indexes are also green. This is because since their length is long they still have some momentum and strength from the first white circle (left). Just because the first white circle failed in its bullish push, doesn’t mean it didn’t achieve momentum that would later on help to push the price up.
3. The Lower levels of the Heat Map are turning Yellow/Orange/Red (60-100 MFI): It occurred somewhat in the left white circle, but mainly in the right white circle. This shows us the MFI is very high on the lower lengths, this may lead to the current, middle and higher length MFIs following suit soon. Remember it has to work its way up, the higher levels can’t go red unless the lower levels go red first and the higher levels can also lag quite a bit behind and take awhile to catch up, this is normal, expected and meant to happen. Vice versa is also true with getting higher levels to go cold (light teal (think of ICE)).
4. The Upper Levels of the Heat Map are still Light Blue - Green (10-50 MFI): You might think at first that this is a bad thing, but it's not! Remember you want to be Fearful when others are Greedy and Greedy when others are Fearful! You don’t want to buy when the higher levels have a high MFI, you want to buy when you see the momentum pushing up in the lower MFI levels (getting yellow/orange/red in the low levels) while it is still Cold in the higher levels (BLUE OR GREEN, nothing higher than green as it is already slightly too high). There will be many times that it is Yellow or possibly Orange in the high levels and the bullish push still happens, but this is much more risky! The key to trading is to minimize risks while maximizing potential.
Hopefully now you’re getting an idea of how to spot potential bullish momentum changes, but what about bearish momentum changes? Technically they are the exact opposite, so we don’t need to go into as much detail, but lets still take a look at a few examples:
In the example above we marked the 3 times where it was displaying overly bullish characteristics. We marked the bullish momentum occurring with arrows. If you look closely at the start of the arrow to where it finishes, you’ll notice how the heat (HOT)(RED) works its way up from the lower levels to the higher levels. We then see the MFI to SMA cross under. In all 3 of these examples the heat made it all the way to the top of the chart. These are all very bearish signals that represent a bearish momentum movement that may occur soon.
Also, please note, the level the MFI is at DOES matter! That line isn’t there simply for you to see when there are crosses over and under. The MFI is considered to be Overbought when it is greater than 70 (the upper white dashed line, it is just formatted to be on a different scale cause there are 28 plots, but it represents 70). The MFI is considered to be Oversold when it is less than 30 (the lower white dashed line).
If we look to the left a little here where a big drop in price occurred shortly after our MFI and SMA crossed, would we have been able to identify it using the Heat Maps? Likely, No. There was some color change in the lower levels a few bars prior that went yellow/orange/red but before this cross happened they all went back to Dark Blue. In the middle section when the cross happened it was only Green and Yellow and in the upper section we are Blue. This would be a very risky trade to go on as the only real Bearish Indication was the MFI to SMA cross under. Remember, you want to reduce risk, you don’t want to simply trade on everytime the MFI and SMA cross each other or you’ll be getting yourself into many risky trades based on false signals.
Based on what you’ve learned above, can you see the signs that are indicating where this white circle may have potential for a bullish momentum change?
Now that we are more zoomed in, you may also be noticing there are colors to the price bars. This can be disabled in the settings, but just so you know what they mean, let’s zoom in a little more and talk about it.
We’ve condensed the Indicator a bit so you can see the bars better here. The colors that are displayed on these bars are the Heat Map value for your MFI (the white line in the Indicator). This way you can better see when the Price is Hot and Cold. As you may see while looking, the colors generally go from cold to hot when bullish momentum is happening and hot to cold when bearish momentum is happening. We don’t recommend solely looking at the bars as indicators to MFI momentum change, as seeing the Heat Map will give you much more data; however it can be nice to see the Heat Map projected on the bars rather than trying to eyeball it yourself or hover over each bar specifically to see their levels.
We will conclude our Tutorial here. Hopefully this has given you some insight to how useful Heat Maps can be and why it works well with a Machine Learning (KNN) Model applied to the MFI.
PLEASE NOTE: You can adjust the line width for the Heat Map within the settings. If you condense the Indicator a lot or have a small screen, likely use a length of 1-2. If you have it stretched out or a large screen, a length of 2-3 will work nice. You just don’t want to have the lines overlapping or it defeats the purpose of a Heat Map. Also, the bigger the linewidth, generally you’ll want to increase the Transparency within the Settings also as it can get quite bright and hurt your eyes over time.
Settings:
MFI:
Show MFI and SMA Crossing Signals: MFI and SMA Crossing is one of the leading Bullish and Bearish Signals in this Indicator. You can also add alerts for these signals.
Plot Amount: How many plots are used in this Heat Map. (2 - 28).
Source: The Source to use in all MFI calculations.
Smooth Initial MFI Length: How much to smooth the Fast and Slow MFI calculation by. 1 = No smoothing.
MFI SMA Length: What length we smooth the MFI Average over to get our MFI SMA.
Machine Learning:
Average MFI data by adding a lookback to the Source: While populating our Heat Map with the MFI's, should use use the Source each MFI Length increase or should we also lookback a Source each MFI Length Increase.
KNN Distance Requirement: To be a valid KNN, it needs to abide by a Distance calculation. Generally only Max is used, but you can change it if it suits your trading style better.
Machine Learning Length: How much ML data should we store? The longer the length generally the smoother the result; which may not be as accurate for something like a Heat Map, so keeping this relatively low may lead to more accurate results.
KNN Length: How many KNN are used in the slice to calculate max/min distance allowed.
Fast Length: Fast MFI length used in KNN to calculate distances by comparing its distance with the Slow MFI Length.
Slow Length: Slow MFI length used in KNN to calculate distances by comparing its distance with the Fast MFI Length.
Smoothing Length: When populating our Heat Map, at what length do we start our MFI calculations with (A Higher value with result in a slower and more smoothed MFI / Heat Map).
Colors:
Change Bar Color: Change bar colors to MFI Avg Color.
Heat Map Transparency: If there isn't any transparency it can be a little hard on the eyes. The Greater the Line Width, generally the more transparency you'll want for your eyes.
Line Width: Set how wide the Heat Map lines are
MFI 90-100 Color: Color when the MFI is between these levels.
MFI 80-89 Color: Color when the MFI is between these levels.
MFI 70-79 Color: Color when the MFI is between these levels.
MFI 60-69 Color: Color when the MFI is between these levels.
MFI 50-59 Color: Color when the MFI is between these levels.
MFI 40-49 Color: Color when the MFI is between these levels.
MFI 30-39 Color: Color when the MFI is between these levels.
MFI 20-29 Color: Color when the MFI is between these levels.
MFI 10-19 Color: Color when the MFI is between these levels.
MFI 0-100 Color: Color when the MFI is between these levels.
If you have any questions, comments, ideas or concerns please don't hesitate to contact us.
HAPPY TRADING!

Volatility Adjusted Composite RSI with SMA and EMA SignalsOverview
The script "VAC - RSI with SMA and EMA Signals" combines the traditional Relative Strength Index (RSI) with Time-based RSI (T-RSI), and adjusts it for volatility to create a Composite RSI (C-RSI). The script further uses Simple Moving Average (SMA) and Exponential Moving Average (EMA) to generate signals for potential trading opportunities. In the "VAC - RSI with SMA and EMA Signals" script, the combination of price, time, and volatility works as follows:
Price: The script calculates the traditional RSI based on price changes over a specified period.
Time: Alongside the price-based RSI, a Time-based RSI (T-RSI) is calculated, which considers the number of upward and downward closes over the same period.
Volatility: Volatility is integrated into the Composite RSI (C-RSI) by adjusting it with a Z-score based on a standard deviation of closing prices.
These three factors work together to create a more holistic and robust indicator.
How can it be used?
This script is used to identify potential overbought and oversold conditions in the market. It plots the VAC-RSI, SMA, and EMA on a chart, along with overbought and oversold levels, providing visual signals to the trader. When the EMA is below the SMA, it is a bullish signal, and vice versa for a bearish signal.
Default Values for Different Inputs:
Price RSI Weightage (%): 65
Unified Period for RSI & T-RSI: 14
C-RSI SMA Period: 13
C-RSI EMA Period: 33
C-RSI Bull Trend Support: 35
C-RSI Bear Trend Resistance: 65
Use Volatility Adjusted C-RSI (VAC-RSI): true
Standard Deviation Period: 14
Volatility Scaling Factor (α): 5
These values can be adjusted according to the trading strategy to optimize the signals for different assets or timeframes.
Strategies this Can be Used for:
The script can be used in various trading strategies including:
Trend Following: By observing the crosses of EMA and SMA, traders can follow the trend.
Reversion to the Mean: Using the overbought and oversold levels to identify potential reversal points.
Breakout: Identifying breakout points using the Bull and Bear Market Support and Resistance levels.
Comparison with the Standard Indicator:
Enhanced Sensitivity to Market Conditions
Improved Signal Quality
Versatility
Volatility Adjustment
Interpretation of Output Values:
VAC-RSI Value:
The script provides additional overbought (80) and oversold (20) lines to help identify extreme conditions.
SMA and EMA Values:
When the EMA is below the SMA, it is generally considered a bullish signal.
When the EMA is above the SMA, it is generally considered a bearish signal.
The cross of EMA and SMA can be used as a trigger for entry or exit points.
Bull and Bear Market Support and Resistance Lines:
The Bull Market VAC-RSI Support (default at 35) and Bear Market VAC-RSI Resistance (default at 65) lines can be used to identify potential breakout or breakdown points.
In a bull market, if the VAC-RSI stays above the support line, it indicates a strong uptrend.
In a bear market, if the VAC-RSI stays below the resistance line, it indicates a strong downtrend.

Cumulative Distribution of a Dataset [SS]This is the Cumulative Distribution of a Dataset indicator that also calculates the Kurtosis and Skewness for a selected dataset and determines the normality and distribution type.
What it does, in pragmatic terms?
In the most simplest terms, it calculates the cumulative distribution function (or CDF) of user-defined dataset.
The cumulative distribution function (CDF) is a concept used in statistics and probability to describe how the probability of a random variable taking on a certain value or less is distributed across the entire range of possible values. In simpler terms, you can conceptualize the CDF as this:
Imagine you have a list of data, such as test scores of students in a class. The CDF helps you answer questions like, "What's the probability that a randomly chosen student scored 80 or less on the test?"
Or in our case, say we are in a strong up or downtrend on a stock. The CDF can help us answer questions like "Based on this current xyz trend, what is the probability that a ticker will fall above X price or below Y price".
Within the indicator, you can manually assess a price of interest. Let's say, for NVDA, we want to know the probability NVDA goes above or below $450. We can enter $450 into the indicator and get this result:
Other functions:
Kurtosis and Skewness Functions:
In addition to calculating and plotting the CDF, we can also plot the kurtosis & Skewness.
This can help you look for outlier periods where the distribution of your dataset changed. It can potentially alert you to when a stock is behaving abnormally and when it is more stable and evenly distributed.
Tests of normality
The indicator will use the kurtosis and skewness to determine the normality of the dataset. The indicator is programmed to recognize up to 7 different distribution types and alert you to them and the implications they have in your overall assessment.
e.g. #1 AMC during short squeeze:
e.g. #2: BA during the COVID crash:
Plotting the standardized Z-Score of the Distribution Dataset
You can also standardize the dataset by converting it into Z-Score format:
Plot the raw, CDF results
Two values are plotting, the green and the red. The green represents the probability of a ticker going higher than the current value. The red represents the probability of a ticker going lower than the current value.
Limitations
There are some limitations of the indicator which I think are important to point out. They are:
The indicator cannot tell you timelines, it can only tell you the general probability that data within the dataset will fall above or below a certain value.
The indicator cannot take into account projected periods of consolidation. It is possible a ticker can remain in a consolidation phase for a very long time. This would have the effect of stabilizing the probability in one direction (if there was a lot of downside room, it can normalize the data out so that the extent of the downside probability is mitigated). Thus, its important to use judgement and other methods to assess the likelihood that a stock will pullback or continue up, based on the overall probability.
The indicator is only looking at an individual dataset.
Using this indicator, you have to omit a large amount of data and look at solely a confined dataset. In a way, this actually improves the accuracy, but can also be misleading, depending on the size and strength of the dataset being chosen. It is important to balance your choice of dataset time with such things as:
a) The strength of the uptrend or downtrend.
b) The length of the uptrend or downtrend.
c) The overall performance of the stock leading into the dataset time period
And that is the indicator in a nutshell.
Hopefully you find it helpful and interesting. Feel free to leave questions, comments and suggestions below.
Safe trades everyone and take care!
