McClellan Oscillator for DAX (GER30) [aftabmk modified]About McClellan Oscillator
Developed by Sherman and Marian McClellan, the McClellan Oscillator is a breadth indicator derived from Net Advances, the number of advancing issues less the number of declining issues. Subtracting the 39-day exponential moving average of Net Advances from the 19-day exponential moving average of Net Advances forms the oscillator.
As the formula reveals, the McClellan Oscillator is a momentum indicator that works similar to MACD .
McClellan Oscillator signals can be generated with breadth thrusts, centerline crossovers, overall levels and divergences.
About my version
This version here is a modification, though:
- It can only be used on the DAX index (DAX 30 or GER 30)
- It only considers the DAX 30 stocks
- The data window will provide a summary about rising and declining stocks
- The data window will output the last change for each of the 30 stocks
BUG
I am only publishing this version because I am not sure if my current version is saved when I leave tradingview.com without publishing the script.
This version still contains a bug - the if/else clauses do not correctly recognize declining stocks. So the oscillator should not be used as it is.
Working on it these days. Feel free to provide feedback!
Stuff I am working on
- Coloring the area green/red according to the value
- Fixing this bug/making this script more efficient
DISCLAIMER
This script was mainly written for educational purposes (training myself how to write custom indicatotors).
As you can see, the code is really messy.
Credits
Based on the simple version of aftabmk
You can find the original version by searching for McClellan Oscillator for nifty 50.
Cerca negli script per "重庆30天天气预报"

Gann RetracementThe indicator is based on W. D. Gann's method of retracement studies. Gann looked at stock retracement action in terms of Halves (1/2), Thirds (1/3, 2/3), Fifths (1/5, 2/5, 3/5, and 4/5) and more importantly the Eighths (1/8, 2/8, 3/8, 4/8, 5/8, 6/8, and 7/8). Needless to say, {2, 3, 5, 8} are the only Fibonacci numbers between 1 to 10. These ratios can easily be visualized in the form of division of a Circle as follows :
Divide the circle in 12 equal parts of 30 degree each to produce the Thirds :
30 x 4 = 120 is 1/3 of 360
30 x 8 = 240 is 2/3 of 360
The 30 degree retracement captures fundamental geometric shapes like a regular Triangle (120-240-360), a Square (90-180-270-360), and a regular Hexagon (60-120-180-240-300-360) inscribed inside of the circle.
Now, divide the circle in 10 equal parts of 36 degree each to produce the Fifths :
36 x 2 = 72 is 1/5 of 360
36 x 4 = 144 is 2/5 of 360
36 x 6 = 216 is 3/5 of 360
36 x 8 = 288 is 4/5 of 360
where, (72-144-216-288-360) is a regular Pentagon.
Finally, divide the circle in 8 equal parts of 45 degree each to produce the Eighths :
45 x 1 = 45 is 1/8 of 360
45 x 2 = 90 is 2/8 of 360
45 x 3 = 135 is 3/8 of 360
45 x 4 = 180 is 4/8 of 360
45 x 5 = 225 is 5/8 of 360
45 x 6 = 270 is 6/8 of 360
45 x 7 = 315 is 7/8 of 360
where, (45-90-135-180-225-270-315-360) is a regular Octagon.
How to Use this indicator ?
The indicator generates Gann retracement levels between any two significant price points, such as a high and a low.
Input :
Swing High (significant high price point, such as a top)
Swing Low (significant low price point, such as a bottom)
Degree (degree of retracement)
Output :
Gann retracement levels (color coded as follows) :
Swing High and Swing Low (BLUE)
50% retracement (ORANGE)
Retracements between Swing Low and 50% level (RED)
Retracements between 50% level and Swing High (LIME)

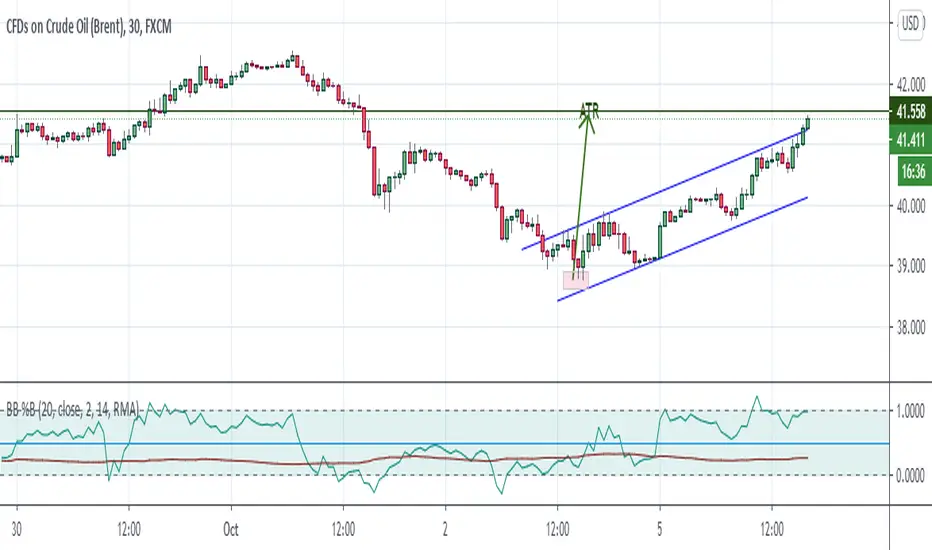
Bollinger Bands %B + ATR This indicator is best suitable for the 30-minutes interval OIL charts, due to ATR accuracy.
BB%B is great for showing oversold/overbought market conditions and offers excellent entry/exit opportunities for Day Trading (30 minutes chart), as well as reliable convergence/divergence patterns. ATR is conveniently combined and shows potential market volatility levels for the day when used in 30-minutes charts, thus demarcating your day trade exit point.
To use the ATR on this indicator: Just read the ATR value of the lowest (for a new bull trend) or the highest (for a new bear trend) candlestick of the newly formed trend leg. Let's suppose the ATR reads 0.2891, then you project a move of 2.891 points towards the given trend direction using the ruler tool (30-minutes charts). That's all, and there you have your take profit target!
Good Luck!!!
ADX strategy (considering ADX and +DI only )I have been checking the strategies on ADX indicator.
I have found that +DI crossing above ADX line under threshold 30 and exit on crossdown when ADX above 30 has better results than just following crossovers of +DI and -DI , ADX crossing above 30 .
BUY Rule
========
fast ema is above slow ema (default 13 and 55 , you can change these values in settings)
+DI cross above ADX well beloe threshold level (default 30)
Exit reule
========
when +DI cross down ADX , well above on threshold level
Stop Loss
=========
Default is set to 8%
Take a look and let me know how your symbol works with this strategy
Note : Bar color changes to yellow when the BUY condition is met.
Bar color and Background color shows to blue --- if Long position is active
fast ema and long ema doesnt print on the chart -- please add manually to the chart
Warning : for the use of educational purposes only

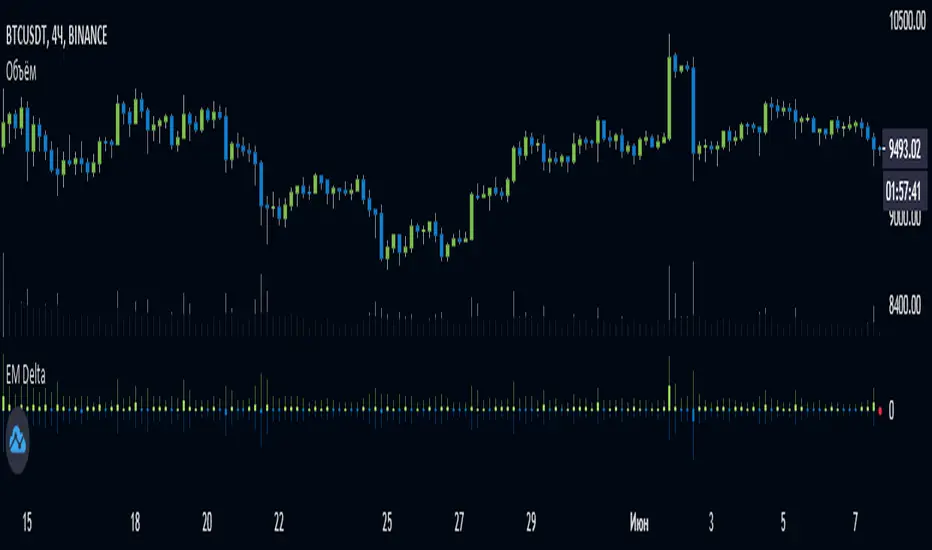
EulerMethod: DeltaEN
Shows the Integral Volume Delta (IVD)
It is a detailed OBV. Each bar sums up the volume for bars of a shorter timeframe.
For example, inside a 1M bar, every 12h bar is added up, and inside a 1h bar, every 1min bar is added. Thus, a conditional volume delta inside the bar is obtained.
The indicator for each bar shows the volume of purchases (positive), sales (negative) and the difference — IVD
The delta histogram is thicker than the volume histograms
Settings detalisation
M — 6 hours, 12 hours and 1 day for the M timeframe (720 by default)
W — 4 hours, 6 hours and 12 hours for the W timeframe (240 by default)
D — 30 minutes, 1 hour and 2 hours for the D timeframe (60 by default)
H — 1 minute, 5 minutes and 15 minutes for timeframes [1h, D) (default is 1)
For timeframes of 15m and less, the calculation is carried out by minute bars
VSA mode
The classic OBV adds volume to the cumulative sum under the condition Сlose (n) > Close (n-1) and subtracts it under the condition Close (n) < Close (n-1)
When VSA mode is disabled, all volumes are summed up under these conditions.
When the VSA approximation is turned on, the volume per bar of detail is divided by the factor (Close - Low) / (High - Low)
That is, it takes into account the spread per bar and closing relative to the spread. VSA is enabled by default
A/D mode
Shows the cumulative Accumulation / Distribution Index
The delta of the detail bar is multiplied by (High + Low + Close) / 3 bars, the result is added to the cumulative sum
No additional price conversions required due to integral summation
Index line view is customizable
EM Delta does not receive intermediate values in real time.
To see the result, wait until the bar closes or switch to a smaller timeframe
RU
Показывает Интегральную Дельту Объёма (ИДО)
Представляет собой детализированный OBV. В каждом баре суммируется объём за бары меньшего таймфрейма.
Например, внутри 1М-бара суммируется каждый 12h-бар, а внутри 1h — каждый 1m-бар. Таким образом получается условная дельта объёма внутри бара
Индикатор на каждый бар показывает объём покупок (положительный), объём продаж (отрицательный) и разницу — ИДО
Гистограмма дельты толще гистограмм объёмов
Настройки детализации внутри бара
M — 6 часов, 12 часов и 1 день для таймфрейма M (по-умолчанию 720)
W — 4 часа, 6 часов и 12 часов для таймфрейма W (по-умолчанию 240)
D — 30 минут, 1 час и 2 часа для таймфрейма D (по-умолчанию 60)
H — 1 минута, 5 минут и 15 минут для таймфреймов [1h, D) (по-умолчанию 1)
Для таймфреймов 15m и меньше расчёт ведётся по минутным барам
Режим VSA
Классический OBV прибавляет объём к кумулятивной сумме при условии Сlose(n) > Close(n-1) и отнимает при условии Close(n) < Close(n-1)
При отключении режима VSA все объёмы суммируются по этим условиям
При включённой VSA-аппроксимации объём за бар детализации делится по фактору (Close - Low) / (High - Low)
То есть учитывает спред за бар и закрытие относительно спреда. По-умолчанию режим VSA включен
Режим A/D
Показывает кумулятивный индекс Накопления/Распределения
Дельта бара детализации умножается на (High + Low + Close) / 3 бара, результат прибавляется к кумулятивной сумме
Дополнительные преобразования цены не требуются ввиду интегрального суммирования
Вид линии индекса настраивается
EM Delta не получает промежуточные значения в реальном времени.
Чтобы увидеть результат, дождитесь закрытия бара или перейдите на меньший таймфрейм
Crypto Trading Hours UTC based on Berlin time (UTC +2)Although crypto markets trade 24/7, there are spikes in volume according to the general hours at which different parts of the world do the majority of their trading.
This Script highlights the US, European and Asian markets when they are most active. The normal market hours are always from 08:00 to 16:30 local time.
US market opens at 8:00 Silicon Valley local time, and closes at 16:30 New York local time.
European market opens at 8:00 London local time, and closes at 16:30 Frankfurt local time.
Asian market opens at 8:00 Hong Kong local time, and closes at 16:30 Sydney local time.

Supertrend MTF LAG ISSUEThis script based on
we all use Super trend but it main issue is the lag as it buy too late or sell too late
using Deavaet study of Heat map MTF we can do a little trick
if you look on his study you can see that major signal for example will happen in the time frame before it happen at larger time frame
so in this example if signal at MTF 30 min and signal at MTF 60 min happen at the same time at 2 hours or 4 hours candles then this signal are more likely to be true then random signal at each time frame specific.
since we use shorter time frame on larger time frame we can remove the lag issue that make supertrend not so effective
In this example I set the signal to be MTF 30 +60 om 2 hour TF , can be good also for 4 hour candles..
So you get the signal to close inside the larger candle
now if you want to make on even shorter TF then change the code to 15 and 30 MTF on candles on 1 hour
or 1 and 5 min on 30 min or 15 min

Panchang Time//This indicator is required in NimblrTA and can be used to define timeslots for the trend confirmation
study("Panchang Time", overlay=true)
timeinrange(res, sess) => time(res, sess) != 0
premarket = #C0C0C0
regular = #0000FF
regularslot2 = #00CCFF
postmarket = #5000FF
notrading = na
sessioncolor = timeinrange("30", "0915-0930") ? premarket : timeinrange("30", "0915-0930") ? regular : timeinrange("30", "0931-1200") ? regularslot2 : timeinrange("30", "1201-1305") ? postmarket : notrading
bgcolor(sessioncolor, transp=90)

extended session - Regular Opening-Range- JayyOpening Range and some other scripts updated to plot correctly (see comments below.) There are three variations of the fibonacci expansion beyond the opening range and retracements within the opening range of the US Market session - I have not put in the script for the other markets yet.
The three scripts have different uses and strengths:
The extended session script (with the script here below) will plot the opening range whether you are using the extended session or the regular session. (that is to say whether "ext" in the lower right hand corner is highlighted or not.). While in the extended session the opening range has some plotting issues with periods like 13 minutes or any period that is not divisible into 330 mins with a round number outcome (eg 330/60 =5.5. Therefore an hour long opening range has problems in the extended session.
The pre session script is only for the premarket. You can select any opening range period you like. I have set the opening range to be the full premarket session. If you select a different session you will have to unselect "pre open to 9:30 EST for Opening Range?" in the format section. The script defaults to 15 minutes in the "period Of Pre Opening Range?". To go back to the 4 am to 9:30 pre opening range select "pre open to 9:30 EST for Opening Range?" there is no automatic 330 minute selection.
The past days offset script only works in 5 min or 15 minute period. It will show the opening range from up to 20 days past over the current days price action. Use this for the regular session only. 0 shows the current day's opening range. Use the positive integers for number of days back ie 1, 2, 3 etc not -1, -2, -3 etc. The script is preprogrammed to use the current day (0).
Scripts updated to plot correctly: One thing they all have in common is a way of they deal with a somewhat random problem that shifts the plots 4 hours in one direction or the other ie the plot started at 9:30 EST or 1:30PM EST. This issue started to occur approximately June 22, 2015 and impacts any script that tried to use "session" times to manage a plot in my scripts. The issue now seems to have been resolved during this past week.
Just in case the problem reoccurs I have added a "Switch session plot?" to each script. If the plot looks funny check or uncheck the "Switch session plot?" and see the difference. Of course if a new issue crops up it will likely require a different fix.
I have updated all of the scripts shown on this chart. If you are using a script of mine that suffers from the compiler issue then you will find an update on this chart. You can get any and all of the scripts by clicking on the small sideways wishbone on the left middle of the chart. You will see a dialogue box. Then click "make it mine". This will import all of the scripts to your computer and you can play around with them all to decide what you want and what you don't want. This is the easiest way to get all of the scripts in one fell swoop. It is also the easiest way for me to make all of the scripts available. I do not have all of the plots visible since it is too messy and one of the scripts (pre OR) is only for the regular session. To view the scripts click on the blue eye to the right of the script title to show it on this script. If you can only use the regular session. The scripts will all (with the exception of the pre OR) work fine.
If for any reason this script seems flakey refresh the page r try a slightly different period. I have noticed that sometimes randomly the script loves to return to the 5 min OR. This is a very new issue transient issue. As always if you see an issue please let me know.
Cheers Jayy

RVol based Support & Resistance ZonesDescription:
This indicator is designed to help traders identify significant price levels based on institutional volume. It monitors two higher timeframes (defined by the user) simultaneously. When a candle on these higher timeframes exhibits unusually high volume—known as high Relative Volume (RVol)—the indicator automatically draws a "Zone of Interest" box on your current chart.
These zones are defined by:
Up candle : from candle open to low of candle
Down candle : from candle open to high of candle
Key Features:
Multi-Timeframe Monitoring: You can trade on a lower timeframe (e.g., 5-minute) while the indicator monitors the 30-minute and 1-hour charts for volume spikes.
RVol Boxes: Automatically draws boxes extending from high-volume candles.
Up Candles: Box covers Low to Open.
Down Candles: Box covers High to Open.
Live Dashboard: A neat, color-coded table displays the current Volume, Average Volume, and RVol percentage for your watched timeframes.
Real-Time vs. Confirmed: Choose whether to see boxes appear immediately as volume spikes (Live) or only after the candle has closed and confirmed the volume (Candle Close).
Settings Guide:
1. General Settings
Relative Volume Length: The number of past candles used to calculate the "Average Volume." (Default is 20).
Max Days Back to Draw: To keep your chart clean, this limits how far back in history the script looks for high-volume zones. (e.g., set to 5 to only see zones created in the last 5 days).
Draw Mode:
- Live (Real-time): Draws the box immediately if the current developing candle hits the volume threshold. (Note: The box may disappear if the volume average shifts before the candle closes).
- Candle Close: The box only appears once the candle has finished and permanently confirmed the volume spike.
2. Table Settings
Show Info Table: Toggles the dashboard on or off.
Text Size & Position: Customise where the table appears on your screen and how large the text is.
Colours: Fully customisable colours for the Table Header (Top row) and Data Rows (Bottom rows).
3. Timeframe 1 & 2 Settings
You have two identical sections to configure two different timeframes (e.g., 30m and 1H).
Timeframe: The chart interval to monitor (e.g., "30" for 30 minutes, "60" for 1 Hour, "240" for 4 Hours).
Threshold %: The "Trigger" for drawing a box based on relative candle volume in that timeframe.
Example:
100% = Candle Volume is equal to the average volume for the specified timeframe.
200% = Candle Volume is 2x the average volume for the specified timeframe.
300% = Candle Volume is 3x the average volume for the specified timeframe.
Box & Edge Colour: Distinct colours for each timeframe so you can easily tell which timeframe created the zone.

RS Rating Multi-TimeframeRS Rating Multi-Timeframe (IBD-Style Relative Strength)
Short Description:
IBD-style Relative Strength Rating (1-99) comparing any stock's performance vs the S&P 500 across multiple timeframes.
Full Description:
Overview
This indicator calculates an IBD-style Relative Strength (RS) Rating that measures a stock's price performance relative to the S&P 500 over the past 12 months. The rating scale ranges from 1 (weakest) to 99 (strongest), telling you how a stock ranks against all other stocks in terms of relative performance.
How It Works
The RS Rating uses a weighted formula based on quarterly performance:
Last 63 days (1 quarter): 40% weight
Last 126 days (2 quarters): 20% weight
Last 189 days (3 quarters): 20% weight
Last 252 days (4 quarters): 20% weight
This weighting emphasizes recent performance while still accounting for longer-term strength.
Rating Interpretation
90-99 (Elite): Top 10% of all stocks - exceptional relative strength
80-89 (Excellent): Top 20% - strong leadership candidates
50-79 (Average): Middle of the pack
30-49 (Below Average): Underperforming the market
1-29 (Weak): Bottom 30% - avoid or consider shorting
Features
Multi-Timeframe: Works on any timeframe from 1-hour to weekly (always uses daily data for calculation)
Moving Average: Optional EMA or SMA of the RS Rating to smooth signals
Visual Zones: Color-coded zones for quick identification of strength/weakness
Signal Markers: Triangles appear when RS crosses key levels (80 and 30)
Info Table: Displays current RS Rating, change, MA value, and raw score
Alerts: Built-in alerts for key crossover events
Settings
Show Moving Average: Toggle MA line on/off
MA Length: Period for the moving average (default: 10)
MA Type: Choose between EMA or SMA
Benchmark Index: Change the comparison index (default: SP:SPX)
Show Rating Table: Toggle the info table on/off
How To Use
Buy candidates: Look for stocks with RS Rating above 80, ideally rising
Avoid: Stocks with RS Rating below 30 or falling rapidly
Confirmation: Use RS above its moving average as additional confirmation
Divergence: Watch for RS making new highs before price (bullish) or new lows before price (bearish)
Credits
RS Rating calculation methodology inspired by Investor's Business Daily (IBD) and adapted from Fred6724's RS Rating script. Percentile calibration based on analysis of ~6,600 US stocks.
Tags: relative strength, RS rating, IBD, momentum, CAN SLIM, benchmark, SPX, market leaders, stock ranking
Category: Relative Strength

NYMO Fib Levels - RGNYMO is a single-session tool built around Fibonacci projections from the New York morning move. It automatically marks the NYMO session, measures its high–low range and projects your custom fib multiples above and below price, with every level drawn and labelled so you always know exactly which multiple you are trading around.
The core of the script is the 12:00–12:30 opening window. That first 30 minutes is treated as the price-discovery phase of the session: it captures the initial burst of liquidity, the repricing of overnight positions and the first real directional push. The high and low of 12:00–12:30 form the opening range, and all fib projections are anchored to that move, turning the very first half-hour into a structured map for the rest of the session.
On top of the fib framework, NYMO can show the NYMO session box, compare the current range to recent NYMO statistics, and trigger alerts when price breaks the NYMO high or low or trades through key fib areas. It is built for traders who only care about the New York morning and want all of their structure, targets and alerts driven by fibs from that one defined opening window.

The Alchemist's Trend [wjdtks255]📊 The Alchemist's Trend - Filtered Trading Guide
This indicator, named The Alchemist's Trend, is a High-Confidence Trend-Following Strategy designed to maximize reliability. It generates a final entry signal only when the QQE (Quantitative Qualitative Estimation) momentum signal is validated by four robust filters: Long-Term Trend (MA200), Mid-Term Trend (HMA), Momentum Strength (CCI), and Higher Timeframe (HTF) Trend.
1. Indicator Mechanism and Core Components
A. Chart Visualization and Trend Identification
Trend Line (HMA): Appears as a Yellow or Purple Thick Line. It represents the direction of the current short/mid-term market trend. Candle colors follow this line.
MA 200: Appears as a Dotted Line (color configurable in settings). It is the Long-Term Trend Line. Price above it suggests a long-term bullish view; below it, a long-term bearish view.
Candle Background: Appears as Light Yellow or Purple. It matches the Trend Line direction, providing a visual cue of the trend's strength.
B. The Four-Filter System
For a confirmed entry signal ('L' or 'S') to fire, the following four conditions must all align in the same direction:
QQE (Momentum Base): Generates the primary Long/Short crossover signal.
MA & HMA (Trend Alignment):
For Long Entries: Price must be above both the MA200 and the HMA Trend Line.
For Short Entries: Price must be below both the MA200 and the HMA Trend Line.
CCI (Momentum Strengthening):
For Long Entries: CCI value must be above +50. (Confirms strong buying momentum)
For Short Entries: CCI value must be below -50. (Confirms strong selling momentum)
HTF (Higher Timeframe Trend): Checks if the price on the set higher timeframe (default 4H) is above its own Trend Line, confirming alignment with the broader market direction.
2. Trading Strategy and Usage Rules
This indicator aims to maximize signal reliability over frequency.
🔔 Entry Rule
Enter a trade only when the 'L' or 'S' label appears on the chart AND the Action panel on the dashboard displays LONG SIGNAL or SHORT SIGNAL.
Long Entry (L):
Condition: 'L' label appears (All Long conditions met).
Verification: Confirm the Trend Line and candle color are in the yellow range.
Short Entry (S):
Condition: 'S' label appears (All Short conditions met).
Verification: Confirm the Trend Line and candle color are in the purple range.
🛡️ Risk and Position Management
Stop-Loss (SL): A common practice is to place the Stop-Loss below the low of the signal candle (for Long) or above the high of the signal candle (for Short), or beyond a recent significant support/resistance level.
Exit Strategy (Three Options):
Opposite Signal: Close the position immediately if the opposite signal ('S' during a Long, or 'L' during a Short) occurs.
RSI Extremes: Consider taking partial profits if the RSI reaches 70 (for Long) or 30 (for Short), indicating potential exhaustion.
Trend Line Crossover: Exit the position if the price breaks or crosses the Trend Line, causing the candle color to change.
🖥️ Dashboard Utilization Tips
The dashboard provides contextual information to validate the signal:
RSI: Signals occurring within the neutral 30-70 zone suggest a stronger developing trend. If near 70/30, consider the risk of reversal.
Vol Status ('High'): If the volume status is 'High' when the signal fires, the signal's power is likely high, indicating a higher probability of significant movement.
Day High/Low: Use these values as a secondary reference for setting initial Stop-Loss or Take-Profit targets.

BAY_PIVOT S/R(4 Full Lines + ALL Labels)//@version=5
indicator("BAY_PIVOT S/R(4 Full Lines + ALL Labels)", overlay=true, max_labels_count=500, max_lines_count=500)
// ────────────────────── TOGGLES ──────────────────────
showPivot = input.bool(true, "Show Pivot (Full Line + Label)")
showTarget = input.bool(true, "Show Target (Full Line + Label)")
showLast = input.bool(true, "Show Last Close (Full Line + Label)")
showPrevClose = input.bool(true, "Show Previous Close (Full Line + Label)")
useBarchartLast = input.bool(true, "Use Barchart 'Last' (Settlement Price)")
showR1R2R3 = input.bool(true, "Show R1 • R2 • R3")
showS1S2S3 = input.bool(true, "Show S1 • S2 • S3")
showStdDev = input.bool(true, "Show ±1σ ±2σ ±3σ")
showFib4W = input.bool(true, "Show 4-Week Fibs")
showFib13W = input.bool(true, "Show 13-Week Fibs")
showMonthHL = input.bool(true, "Show 1M High / Low")
showEntry1 = input.bool(false, "Show Manual Entry 1")
showEntry2 = input.bool(false, "Show Manual Entry 2")
entry1 = input.float(0.0, "Manual Entry 1", step=0.25)
entry2 = input.float(0.0, "Manual Entry 2", step=0.25)
stdLen = input.int(20, "StdDev Length", minval=1)
fib4wBars = input.int(20, "4W Fib Lookback")
fib13wBars = input.int(65, "13W Fib Lookback")
// ────────────────────── DAILY CALCULATIONS ──────────────────────
high_y = request.security(syminfo.tickerid, "D", high , lookahead=barmerge.lookahead_on)
low_y = request.security(syminfo.tickerid, "D", low , lookahead=barmerge.lookahead_on)
close_y = request.security(syminfo.tickerid, "D", close , lookahead=barmerge.lookahead_on)
pivot = (high_y + low_y + close_y) / 3
r1 = pivot + 0.382 * (high_y - low_y)
r2 = pivot + 0.618 * (high_y - low_y)
r3 = pivot + (high_y - low_y)
s1 = pivot - 0.382 * (high_y - low_y)
s2 = pivot - 0.618 * (high_y - low_y)
s3 = pivot - (high_y - low_y)
prevClose = close_y
last = useBarchartLast ? request.security(syminfo.tickerid, "D", close , lookahead=barmerge.lookahead_off) : close
target = pivot + (pivot - prevClose)
// StdDev + Fibs + Monthly (unchanged)
basis = ta.sma(close, stdLen)
dev = ta.stdev(close, stdLen)
stdRes1 = basis + dev
stdRes2 = basis + dev*2
stdRes3 = basis + dev*3
stdSup1 = basis - dev
stdSup2 = basis - dev*2
stdSup3 = basis - dev*3
high4w = ta.highest(high, fib4wBars)
low4w = ta.lowest(low, fib4wBars)
fib382_4w = high4w - (high4w - low4w) * 0.382
fib50_4w = high4w - (high4w - low4w) * 0.500
high13w = ta.highest(high, fib13wBars)
low13w = ta.lowest(low, fib13wBars)
fib382_13w_high = high13w - (high13w - low13w) * 0.382
fib50_13w = high13w - (high13w - low13w) * 0.500
fib382_13w_low = low13w + (high13w - low13w) * 0.382
monthHigh = ta.highest(high, 30)
monthLow = ta.lowest(low, 30)
// ────────────────────── COLORS ──────────────────────
colRed = color.rgb(255,0,0)
colLime = color.rgb(0,255,0)
colYellow = color.rgb(255,255,0)
colOrange = color.rgb(255,165,0)
colWhite = color.rgb(255,255,255)
colGray = color.rgb(128,128,128)
colMagenta = color.rgb(255,0,255)
colPink = color.rgb(233,30,99)
colCyan = color.rgb(0,188,212)
colBlue = color.rgb(0,122,255)
colPurple = color.rgb(128,0,128)
colRed50 = color.new(colRed,50)
colGreen50 = color.new(colLime,50)
// ────────────────────── 4 KEY FULL LINES ──────────────────────
plot(showPivot ? pivot : na, title="PIVOT", color=colYellow, linewidth=3, style=plot.style_linebr)
plot(showTarget ? target : na, title="TARGET", color=colOrange, linewidth=2, style=plot.style_linebr)
plot(showLast ? last : na, title="LAST", color=colWhite, linewidth=2, style=plot.style_linebr)
plot(showPrevClose ? prevClose : na, title="PREV CLOSE",color=colGray, linewidth=1, style=plot.style_linebr)
// ────────────────────── LABELS FOR ALL 4 KEY LEVELS (SAME STYLE AS OTHERS) ──────────────────────
f_label(price, txt, bgColor, txtColor) =>
if barstate.islast and not na(price)
label.new(bar_index, price, txt, style=label.style_label_left, color=bgColor, textcolor=txtColor, size=size.small)
if barstate.islast
showPivot ? f_label(pivot, "PIVOT\n" + str.tostring(pivot, "#.##"), colYellow, color.black) : na
showTarget ? f_label(target, "TARGET\n" + str.tostring(target, "#.##"), colOrange, color.white) : na
showLast ? f_label(last, "LAST\n" + str.tostring(last, "#.##"), colWhite, color.black) : na
showPrevClose ? f_label(prevClose, "PREV CLOSE\n"+ str.tostring(prevClose, "#.##"), colGray, color.white) : na
// ────────────────────── OTHER LEVELS – line stops at label ──────────────────────
f_level(p, txt, tc, lc, w=1) =>
if barstate.islast and not na(p)
lbl = label.new(bar_index, p, txt, style=label.style_label_left, color=lc, textcolor=tc, size=size.small)
line.new(bar_index-400, p, label.get_x(lbl), p, extend=extend.none, color=lc, width=w)
if barstate.islast
if showR1R2R3
f_level(r1, "R1\n" + str.tostring(r1, "#.##"), color.white, colRed)
f_level(r2, "R2\n" + str.tostring(r2, "#.##"), color.white, colRed)
f_level(r3, "R3\n" + str.tostring(r3, "#.##"), color.white, colRed, 2)
if showS1S2S3
f_level(s1, "S1\n" + str.tostring(s1, "#.##"), color.black, colLime)
f_level(s2, "S2\n" + str.tostring(s2, "#.##"), color.black, colLime)
f_level(s3, "S3\n" + str.tostring(s3, "#.##"), color.black, colLime, 2)
if showStdDev
f_level(stdRes1, "+1σ\n" + str.tostring(stdRes1, "#.##"), color.white, colPink)
f_level(stdRes2, "+2σ\n" + str.tostring(stdRes2, "#.##"), color.white, colPink)
f_level(stdRes3, "+3σ\n" + str.tostring(stdRes3, "#.##"), color.white, colPink, 2)
f_level(stdSup1, "-1σ\n" + str.tostring(stdSup1, "#.##"), color.white, colCyan)
f_level(stdSup2, "-2σ\n" + str.tostring(stdSup2, "#.##"), color.white, colCyan)
f_level(stdSup3, "-3σ\n" + str.tostring(stdSup3, "#.##"), color.white, colCyan, 2)
if showFib4W
f_level(fib382_4w, "38.2% 4W\n" + str.tostring(fib382_4w, "#.##"), color.white, colMagenta)
f_level(fib50_4w, "50% 4W\n" + str.tostring(fib50_4w, "#.##"), color.white, colMagenta)
if showFib13W
f_level(fib382_13w_high, "38.2% 13W High\n" + str.tostring(fib382_13w_high, "#.##"), color.white, colMagenta)
f_level(fib50_13w, "50% 13W\n" + str.tostring(fib50_13w, "#.##"), color.white, colMagenta)
f_level(fib382_13w_low, "38.2% 13W Low\n" + str.tostring(fib382_13w_low, "#.##"), color.white, colMagenta)
if showMonthHL
f_level(monthHigh, "1M HIGH\n" + str.tostring(monthHigh, "#.##"), color.white, colRed50, 2)
f_level(monthLow, "1M LOW\n" + str.tostring(monthLow, "#.##"), color.white, colGreen50, 2)
// Manual entries
plot(showEntry1 and entry1 > 0 ? entry1 : na, "Entry 1", color=colBlue, linewidth=2, style=plot.style_linebr)
plot(showEntry2 and entry2 > 0 ? entry2 : na, "Entry 2", color=colPurple, linewidth=2, style=plot.style_linebr)
// Background
bgcolor(close > pivot ? color.new(color.blue, 95) : color.new(color.red, 95))

New Age RSI [R4D1]New Age - Clean RSI with Dynamic Clouds
⚠️ BETA VERSION - Currently in testing phase. Feedback welcome!
A visually enhanced RSI indicator with beautiful gradient clouds, dynamic colors, and an informative dashboard.
🎯 FEATURES:
- Dynamic cloud intensity - glows stronger at extremes
- Gradient RSI line - color changes based on value
- Fill between RSI and midline (50)
- Clean buy/sell signals at zone exits
- Real-time dashboard with trend & momentum
- Fully customizable colors and levels
📊 SIGNALS:
- 🟢 BUY: RSI crosses above oversold level (exits oversold)
- 🔴 SELL: RSI crosses below overbought level (exits overbought)
🎨 VISUAL ELEMENTS:
- Red cloud (70-100): Overbought zone - intensity increases as RSI rises
- Green cloud (0-30): Oversold zone - intensity increases as RSI falls
- Gray zone (30-70): Neutral area
- Gradient line: Green (oversold) → Red (overbought)
- Fill to midline: Shows momentum direction
💡 DASHBOARD SHOWS:
- RSI value with colored background
- RSI MA (14-period moving average)
- Zone status (Overbought/Oversold/Neutral)
- Trend direction (Bullish/Bearish)
- Momentum strength (Strong/Rising/Fading)
⚙️ SETTINGS:
- RSI Length (default: 14)
- Overbought level (default: 70)
- Oversold level (default: 30)
- Bull/Bear colors
📈 CHART TYPE SETTINGS:
- Heikin Ashi charts: Set source to "(O + H + L + C) / 4"
- Normal candles: Set source to "Close"
Works perfectly with Supertrend, MACD, and StochRSI for confirmation signals.
🔧 This indicator is in active development. Please report any bugs or suggestions!

Session Opening Range Breakout (ORBO)This strategy automates a classic Opening Range Breakout (ORBO) approach: it builds a price range for the first minutes after the market opens, then looks for strong breakouts above or below that range to catch early directional moves.
Concept
The idea behind ORBO is simple:
The first minutes after the session open are often highly informative.
Price forms an “opening range” that acts as a mini support/resistance zone.
A clean breakout beyond this zone can lead to high-momentum moves.
This script turns that logic into a fully backtestable strategy in TradingView.
How the strategy works
Opening Range Session
Default session: 09:30–09:50 (exchange time)
During this window, the script tracks:
orHigh → highest high within the session
orLow → lowest low within the session
This forms your Opening Range for the day.
Breakout Logic (after the window ends)
Once the defined session ends:
Long Entry:
If the close crosses above the Opening Range High (orHigh),
→ strategy.entry("OR Long", strategy.long) is triggered.
Short Entry:
If the close crosses below the Opening Range Low (orLow),
→ strategy.entry("OR Short", strategy.short) is triggered.
Only one opening range per day is considered, which keeps the logic clean and easy to interpret.
Daily Reset
At the start of a new trading day, the script resets:
orHigh := na
orLow := na
A fresh Opening Range is then built using the next session’s 09:30–09:50 candles.
This ensures entries are always based on today’s structure, not yesterday’s.
Visuals & Inputs
Inputs:
Opening range session → default: "0930-0950"
Show OR levels → toggle visibility of OR High / Low lines
Fill range body → optional shaded zone between OR High and OR Low
Chart visuals:
A green line marks the Opening Range High.
A red line marks the Opening Range Low.
Optional yellow fill highlights the entire OR zone.
Background shading during the session shows when the range is currently being built.
These visuals make it easy to see:
Where the OR sits relative to current price
How clean / noisy the breakout was
How often price respects or rejects the opening zone
Backtesting & Optimization
Because this is written as a strategy():
You can use TradingView’s Strategy Tester to view:
Win rate
Net profit
Drawdown
Profit factor
Equity curve
Ideas to experiment with:
Change the session window (e.g., 09:15–09:45, 10:00–10:30)
Apply to different:
Markets: indices, FX, crypto, stocks
Timeframes: 1m / 5m / 15m
Add your own:
Stop Loss & Take Profit levels
Time filters (only trade certain days / times)
Volatility filters (e.g., ATR, range size thresholds)
Higher-timeframe trend filter (e.g., only take longs above 200 EMA)

Asia & London Session Boxes (NY Time) + 4H SwingsAsia & London Session Boxes + 4H Swings
Description
A multi-timeframe session analysis tool designed for forex and futures traders operating on NY time. This indicator visualizes major trading sessions with automatic high/low range boxes while simultaneously tracking 4-hour swing levels, giving you a complete picture of institutional trading activity and key price levels.
How It Works
Session Boxes (NY Time Zone)
Asia Session (20:00 – 00:00 NY): Blue-shaded box marking the complete range from open to close
London Session (02:00 – 06:00 NY): Yellow-shaded box capturing the high-volatility London open
Each session box automatically records the highest high and lowest low during that timeframe, providing instant reference for session extremes and potential supply/demand zones.
4-Hour Swing Levels
Detects swing highs and lows on a 30-minute timeframe for ultra-responsive level identification
Red lines: Swing highs (resistance levels)
Green lines: Swing lows (support levels)
Lines extend to the right for continuous monitoring
Auto-removes touched levels: When price breaches a swing, it automatically deletes that level to keep your chart clean and focused on active levels
Key Features
Session-Based Trading Analysis: Identify which session created important price levels and ranges
Multi-Timeframe Architecture: Analyzes 30-minute swings while tracking 4-hour patterns on your current chart
Smart Level Cleanup: Touched swings automatically remove themselves, eliminating clutter
NY Time Conversion: All times automatically adjust to your NY timezone for consistency
Institutional Perspective: View exactly where institutions are trading during major session hours
Zero Lag Detection: Real-time identification of swing extremes
Ideal For
Forex traders (especially EUR/USD, GBP/USD) targeting session breakouts
Scalpers and swing traders needing precise support/resistance levels
Market structure traders analyzing institutional price action
Session traders looking to trade Asia/London opens
1-minute to 4-hour timeframe charts
Trading Applications
Trade Asia session breakouts into London
Identify liquidity zones from previous sessions
Detect swing extremes for entry/exit planning
Confirm trend direction using multi-session structure
Find support/resistance on intraday pullbacks
Default Settings Optimized For
NASDAQ futures and forex pairs
Scalping and short-term swing trading
NY timezone trading (automatically converts UTC-4)
30-minute swing detection for precise level identification

Session Open Range, Breakout & Trap Framework - TrendPredator OBSession Open Range, Breakout & Trap Framework — TrendPredator Open Box
Stacey Burke’s trading approach combines concepts from George Douglas Taylor, Tony Crabel, Steve Mauro, and Robert Schabacker. His framework focuses on reading price behaviour across daily templates and identifying how markets move through recurring cycles of expansion, contraction, and reversal. While effective, much of this analysis requires real-time interpretation of session-based behaviour, which can be demanding for traders working on lower intraday timeframes.
The TrendPredator indicators formalize parts of this methodology by introducing mechanical rules for multi-timeframe bias tracking and session structure analysis. They aim to present the key elements of the system—bias, breakouts, fakeouts, and range behaviour—in a consistent and objective way that reduces discretionary interpretation.
The Open Box indicator focuses specifically on the opening behaviour of major trading sessions. It builds on principles found in classical Open Range Breakout (ORB) techniques described by Tony Crabel, where a defined time window around the session open forms a structural reference range. Price behaviour relative to this range—breaking out, failing back inside, or expanding—can highlight developing session bias, potential trap formation, and directional conviction.
This indicator applies these concepts throughout the major equity sessions. It automatically maps the session’s initial range (“Open Box”) and tracks how price interacts with it as liquidity and volatility increase. It also incorporates related structural references such as:
* the first-hour high and low of the futures session
* the exact session open level
* an anchored VWAP starting at the session open
* automated expansion levels projected from the Open Box
In combination, these components provide a unified view of early session activity, including breakout attempts, fakeouts, VWAP reactions, and liquidity targeting. The Open Box offers a structured lens for observing how price transitions through the major sessions (Asia → London → New York) and how these behaviours relate to higher-timeframe bias defined in the broader TrendPredator framework.
Core Features
Open Box (Session Structure)
The indicator defines an initial session range beginning at the selected session open. This “Open Box” represents a fixed time window—commonly the first 30 minutes, or any user-defined duration—that serves as a structural reference for analysing early session behaviour.
The range highlights whether price remains inside the box, breaks out, or rejects the boundaries, providing a consistent foundation for interpreting early directional tendencies and recognising breakout, continuation, or fakeout characteristics.
How it works:
* At the session open, the indicator calculates the high and low over the specified time window.
* This range is plotted as the initial structure of the session.
* Price behaviour at the boundaries can illustrate emerging bias or potential trap formation.
* An optional secondary range (e.g., 15-minute high/low) can be enabled to capture early volatility with additional precision.
Inputs / Options:
* Session specifications (Tokyo, London, New York)
* Open Box start and end times (e.g., equity open + first 30 minutes, or any custom length)
* Open Box colour and label settings
* Formatting options for Open Box high and low lines
* Optional secondary range per session (e.g., 15-minute high/low)
* Forward extension of Open Box high/low lines
* Number of historic Open Boxes to display
Session VWAPs
The indicator plots VWAPs for each major trading session—Asia, London, and New York—anchored to their respective session opens. These session-specific VWAPs assist in tracking how value develops through the day and how price interacts with session-based volume distributions.
How it works:
* At each session open, a VWAP is anchored to the open price.
* The VWAP updates throughout the session as new volume and price data arrive.
* Deviations above or below the VWAP may indicate balance, imbalance, or directional control.
* Viewed together, session VWAPs help identify transitions in value across sessions.
Inputs / Options:
* Enable or disable VWAP per session
* Adjustable anchor and end times (optionally to end of day)
* Line styling and label settings
* Number of historic VWAPs to draw
First Hour High/Low Extensions
The indicator marks the high and low formed during the first hour of each session. These reference points often function as early control levels and provide context for assessing whether the session is establishing bias, consolidating, or exhibiting reversal behaviour.
How it works:
* After the session starts, the indicator records the highest and lowest prices during the first hour.
* These levels are plotted and extended across the session.
* They provide a visual reference for observing reactions, targets, or rejection zones.
Inputs / Options:
* Enable or disable for each session
* Line style, colour, and label visibility
* Number of historic sessions displayed
EQO Levels (Equity Open)
The indicator plots the opening price of each configured session. These “Equity Open” levels represent short-term reference points that can attract price early in the session.
Once the level is revisited after the Open Box has formed, it is automatically cut to avoid clutter. If not revisited, the line remains as an untested reference, similar to a naked point of control.
How it works:
* At session open, the open price is recorded.
* The level is plotted as a local reference.
* If price interacts with the level after the Open Box completes, the line is cut.
* Untested EQOs extend forward until interacted with.
Inputs / Options:
* Enable/disable per session
* Line style and label settings
* Optional extension into the next day
* Option for cutting vs. hiding on revisit
* Number of historic sessions displayed
OB Range Expansions (Automatic)
Range expansions are calculated from the height of the Open Box. These levels provide structured reference zones for identifying potential continuation or exhaustion areas within a session.
How it works:
* After the Open Box is formed, multiples of the range (e.g., 1×, 2×, 3×) are projected.
* These expansion levels are plotted above and below the range.
* Price reactions near these areas can illustrate continuation, hesitation, or potential reversal.
Inputs / Options:
* Enable or disable per session
* Select number of multiples
* Line style, colour, and label settings
* Extension length into the session
Stacey Burke 12-Candle Window Marker
The indicator can highlight the 12-candle window often referenced in Stacey Burke’s session methodology. This window represents the key active period of each session where breakout attempts, volatility shifts, and reversal signatures often occur.
How it works:
* A configurable window (default 12 candles) is highlighted from each session open.
* This window acts as a guide for observing active session behaviour.
* It remains visible throughout the session for structural context.
Inputs / Options:
* Enable/disable per session
* Configurable window duration (default: 3 hours)
* Colour and transparency controls
Concept and Integration
The Open Box is built around the same multi-timeframe logic that underpins the broader TrendPredator framework.
While higher-timeframe tools track bias and setups across the H8–D–W–M levels, the Open Box focuses on the H1–M30 domain to define session structure and observe how early intraday behaviour aligns with higher-timeframe conditions.
The indicator integrates with the TrendPredator FO (Breakout, Fakeout & Trend Switch Detector), which highlights microstructure signals on lower timeframes (M15/M5). Together they form a layered workflow:
* Higher timeframes: context, bias, and developing setups
* TrendPredator OB: intraday and intra-session structure
* TrendPredator FO: microstructure confirmation (e.g., FOL/FOH, switches)
This alignment provides a structured way to observe how daily directional context interacts with intraday behaviour.
See the public open source indicator TP FO here (click on it for access):
Practical Application
Before Session Open
* Review previous session Open Box, Open level, and VWAPs
* Assess how higher-timeframe bias aligns with potential intraday continuation or reversal
* Note untested EQO levels or VWAPs that may function as liquidity attractors
During Session Open
* Observe behaviour around the first-hour high/low and higher-timeframe reference levels
* Monitor how the M15 and 30-minute ranges close
* Track reactions relative to the session open level and the session VWAP
After the Open Box completes
* Assess price interaction with Open Box boundaries and first-hour levels
* Use microstructure signals (e.g., FOH/FOL, switches) for potential confirmation
* Refer to expansion levels as reference zones for management or target setting
After Session
* Review how price behaved relative to the Open Box, EQO levels, VWAPs, and expansion zones
* Analyse breakout attempts, fakeouts, and whether intraday structure aligned with the broader daily move
Example Workflow and Trade
1. Higher-timeframe analysis signals a Daily Fakeout Low Continuation (bullish context).
2. The New York session forms an Open Box; price breaks above and holds above the first-hour high.
3. A Fakeout Low + Switch Bar appears on M5 (via FO), after retesting the session VWAP triggering the entry.
4. 1x expansion level serves as reference targets for take profit.
Relation to the TrendPredator Ecosystem
The Open Box is part of the TrendPredator Indicator Family, designed to apply multi-timeframe logic consistently across:
* higher-timeframe context and setups
* intraday and session structure (OB)
* microstructure confirmation (FO)
Together, these modules offer a unified structure for analysing how daily and intraday cycles interact.
Disclaimer
This indicator is for educational purposes only and does not guarantee profits.
It does not provide buy or sell signals but highlights structural and behavioural areas for analysis.
Users are solely responsible for their trading decisions and outcomes.

Advanced Trading System - Volume Profile + BB + RSI + FVG + FibAdvanced Multi-Indicator Trading System with Volume Profile, Bollinger Bands, RSI, FVG & Fibonacci
Overview
This comprehensive trading indicator combines five powerful technical analysis tools into one unified system, designed to identify high-probability trading opportunities with precision entry and exit signals. The indicator integrates Volume Profile analysis, Bollinger Bands, RSI momentum, Fair Value Gaps (FVG), and Fibonacci retracement levels to provide traders with a complete market analysis framework.
Key Features
1. Volume Profile & Point of Control (POC)
Automatically calculates the Point of Control - the price level with the highest trading volume
Identifies Value Area High (VAH) and Value Area Low (VAL)
Updates dynamically based on customizable lookback periods
Helps identify key support and resistance zones where institutional traders are active
2. Bollinger Bands Integration
Standard 20-period Bollinger Bands with customizable multiplier
Identifies overbought and oversold conditions
Measures market volatility through band width
Signals generated when price approaches extreme levels
3. RSI Momentum Analysis
14-period Relative Strength Index with visual background coloring
Overbought (70) and oversold (30) threshold alerts
Integrated into buy/sell signal logic for confirmation
Real-time momentum tracking in info dashboard
4. Fair Value Gap (FVG) Detection
Automatically identifies bullish and bearish fair value gaps
Visual representation with colored boxes
Highlights imbalance zones where price may return
Used for high-probability entry confirmation
5. Fibonacci Retracement Levels
Auto-calculated based on recent swing high/low
Key levels: 23.6%, 38.2%, 50%, 61.8%, 78.6%
Perfect for identifying profit-taking zones
Dynamic lines that update with market movement
6. Smart Signal Generation
The indicator generates BUY and SELL signals based on multi-condition confluence:
BUY Signal Requirements:
Price near lower Bollinger Band
RSI in oversold territory (< 30)
High volume confirmation (optional)
Bullish FVG or POC alignment
SELL Signal Requirements:
Price near upper Bollinger Band
RSI in overbought territory (> 70)
High volume confirmation (optional)
Bearish FVG or POC alignment
7. Automated Take Profit Levels
Three dynamic profit targets: 1%, 2%, and 3%
Automatically calculated from entry price
Visual markers on chart
Individual alerts for each level
8. Comprehensive Alert System
The indicator includes 10+ alert types:
Buy signal alerts
Sell signal alerts
Take profit level alerts (TP1, TP2, TP3)
Fibonacci level cross alerts
RSI overbought/oversold alerts
Bullish/Bearish FVG detection alerts
9. Real-Time Info Dashboard
Live display of all key metrics
Color-coded for quick visual analysis
Shows RSI, BB Width, Volume ratio, POC, Fib levels
Current signal status (BUY/SELL/WAIT)
How to Use
Setup
Add the indicator to your chart
Adjust parameters based on your trading style and timeframe
Set up alerts by clicking "Create Alert" and selecting desired conditions
Recommended Timeframes
Scalping: 5m - 15m
Day Trading: 15m - 1H
Swing Trading: 4H - Daily
Parameter Customization
Volume Profile Settings:
Length: 100 (adjust for more/less historical data)
Rows: 24 (granularity of volume distribution)
Bollinger Bands:
Length: 20 (standard period)
Multiplier: 2.0 (adjust for tighter/wider bands)
RSI Settings:
Length: 14 (standard momentum period)
Overbought: 70
Oversold: 30
Fibonacci:
Lookback: 50 (swing high/low detection period)
Signal Settings:
Volume Filter: Enable/disable volume confirmation
Volume MA Length: 20 (for volume comparison)
Trading Strategy Examples
Strategy 1: Trend Reversal
Wait for BUY signal at lower Bollinger Band
Confirm with bullish FVG or POC support
Enter position
Take partial profits at Fib 38.2% and 50%
Exit remaining position at TP3 or SELL signal
Strategy 2: Breakout Confirmation
Monitor price approaching POC level
Wait for volume spike
Enter on signal confirmation with FVG alignment
Use Fibonacci levels for scaling out
Strategy 3: Range Trading
Identify POC as range midpoint
Buy at lower BB with oversold RSI
Sell at upper BB with overbought RSI
Use FVG zones for additional confirmation
Best Practices
✅ Do:
Use multiple timeframe analysis
Combine with price action analysis
Set stop losses below/above recent swing points
Scale out at Fibonacci levels
Wait for volume confirmation on signals
❌ Don't:
Trade every signal blindly
Ignore overall market context
Use on extremely low timeframes without testing
Neglect risk management
Trade during low liquidity periods
Risk Management
Always use stop losses
Risk no more than 1-2% per trade
Consider market conditions and volatility
Scale position sizes based on signal strength
Use the volume filter for additional confirmation
Technical Specifications
Pine Script Version: 6
Overlay: Yes (displays on main chart)
Max Boxes: 500 (for FVG visualization)
Max Lines: 500 (for Fibonacci levels)
Alerts: 10+ customizable conditions
Performance Notes
This indicator works best in:
Trending markets with clear momentum
High-volume trading sessions
Assets with good liquidity
When multiple signals align
Less effective in:
Extremely choppy/sideways markets
Low-volume periods
During major news events (high volatility)
Updates & Support
This indicator is actively maintained and updated. Future enhancements may include:
Additional volume profile features
More sophisticated FVG tracking
Enhanced alert customization
Backtesting integration
Disclaimer
This indicator is for educational and informational purposes only. It does not constitute financial advice. Past performance does not guarantee future results. Always conduct your own research and consider consulting with a financial advisor before making trading decisions. Trading involves substantial risk of loss.

J&A Sessions & NewsProject J&A: Session Ranges is a precision-engineered tool designed for professional traders who operate based on Time & Price. Unlike standard session indicators that clutter the chart with background colors, this tool focuses on Dynamic Price Ranges to help you visualize the Highs, Lows, and liquidity pools of each session.
It is pre-configured for Frankfurt Time (Europe/Berlin) but is fully customizable for any global location.
Key Features
1. Dynamic Session Ranges (The Boxes) Instead of vertical stripes, this indicator draws Boxes that encapsulate the entire price action of a session.
Real-Time Tracking: The box automatically expands to capture the Highest High and Lowest Low of the current session.
Visual Clarity: Instantly see the trading range of Asia, London, and New York to identify breakouts or range-bound conditions.
2. The "Lunch Break" Logic (Unique Feature) Institutional volume often dies down during lunch hours. This indicator allows you to Split the Session to account for these breaks.
Enabled: The script draws two separate boxes (Morning Session vs. Afternoon Session), allowing you to see fresh ranges after the lunch accumulation.
Disabled: The script draws one continuous box for the full session.
3. Manual High-Impact News Scheduler Never get caught on the wrong side of a spike. Since TradingView scripts cannot access live calendars, this tool includes a Manual Scheduler for risk management.
Input: Simply input the time of high-impact events (e.g., CPI, NFP) from ForexFactory into the settings.
Visual: A dashed line appears on the chart at the exact news time.
Audio Alert: The system triggers an alarm 10 minutes before the event, giving you time to manage positions or exit trades.
Default Configuration (Frankfurt Time)
Asian Session: 01:00 - 10:00 (Lunch disabled)
London Session: 09:00 - 17:30 (Lunch: 12:00-13:00)
New York Session: 14:00 - 22:00 (Lunch: 18:00-19:00)
How to Use
Setup: Apply the indicator. The default timezone is Europe/Berlin. If you live elsewhere, simply change the "Your Timezone" setting to your local time (e.g., America/New_York), and the boxes will align automatically.
Daily Routine: Check the economic calendar in the morning. If there is a "Red Folder" event at 14:30, open the indicator settings and enter 14:30 into the News Scheduler.
Trade: Use the Session Highs and Lows as liquidity targets or breakout levels.
Settings & Customization
Timezone: Full support for major global trading hubs.
Colors: Customize the Box fill and Border colors for every session.
Labels: Rename sessions (e.g., "Tokyo" instead of "Asia") via the settings menu.

RSI + Psy + ADXRSI + Psychological Line + ADX (with RCI-replacement logic)
This custom TradingView indicator combines three major technical analysis tools—RSI, Psychological Line (Psy), and ADX—to help traders identify trend strength, market momentum, and overbought/oversold conditions with improved clarity.
1. Multi-Period RSI
The indicator calculates three RSI values:
Short-term RSI (9)
Mid-term RSI (26)
Long-term RSI (52)
These help users observe short-, mid-, and long-term momentum simultaneously.
Threshold lines are drawn at 70, 50, and 30 for standard RSI overbought/oversold analysis.
2. Psychological Line (Psy) with Dynamic Column Display
The Psy indicator counts how many closes within the selected period (default: 12) were higher than the previous close.
Values above 75 indicate overbought markets.
Values below 25 indicate oversold markets.
When Psy crosses these thresholds, it is displayed as a column chart centered at 50, visually expanding upward (overbought) or downward (oversold).
3. ADX Trend Strength with Color Coding
ADX is calculated from DI+ and DI− values (using true range and directional movement).
The ADX line changes color based on trend strength:
Blue: Weak trend (below 20)
Yellow: Moderate trend (20–30)
Red: Strong trend (above 30)
This helps traders easily recognize when the market transitions from low-volatility to strong-trend conditions.

Pivot Reversal Signals - Multi ConfirmationPivot Reversal Signals - Multi-Confirmation System
Overview
A comprehensive reversal detection indicator designed for daytraders that combines six independent technical signals to identify high-probability pivot points. The indicator uses a scoring system to classify signal strength as Weak, Medium, or Strong based on the number of confirmations present.
How It Works
The indicator monitors six key reversal signals simultaneously:
1. RSI Divergence - Detects when price makes new highs/lows but RSI shows weakening momentum
2. MACD Divergence - Identifies divergence between price action and MACD histogram
3. Key Level Touch - Confirms price is at significant support/resistance (previous day high/low, premarket high/low, VWAP, 50 SMA)
4. Reversal Candlestick Patterns - Recognizes bullish/bearish engulfing, hammers, and shooting stars
5. Moving Average Confluence - Validates bounces/rejections at stacked moving averages (9/20/50)
6. Volume Spike - Confirms increased participation (default: 1.5x average volume)
Signal Strength Classification
• Weak (3/6 confirmations) - Small circles for situational awareness only
• Medium (4/6 confirmations) - Regular triangles, viable entry signals
• Strong (5-6/6 confirmations) - Large triangles with background highlight, highest probability setups
Visual Features
• Entry Signals: Green triangles (up) for long entries, red triangles (down) for short entries
• Exit Warnings: Orange X markers when opposing signals appear
• Signal Labels: Show confirmation score (e.g., "5/6") and strength level
• Key Levels Displayed:
o Previous Day High/Low - Solid green/red lines (uses actual daily data)
o Premarket High/Low - Blue/orange circles (4:00 AM - 9:30 AM EST)
o VWAP - Purple line
o Moving Averages - 9 EMA (blue), 20 EMA (orange), 50 SMA (red)
• Background Tinting: Subtle color on strongest reversal zones
Key Level Detection
The indicator uses request.security() to accurately fetch previous day's high/low from daily timeframe data, ensuring precise level placement. Premarket high/low levels are dynamically tracked during premarket sessions (4:00 AM - 9:30 AM EST) and plotted throughout the trading day, providing critical support/resistance zones that often influence price action during regular hours.
Customizable Parameters
• Signal strength thresholds (adjust required confirmations)
• RSI settings (length, overbought/oversold levels)
• MACD parameters (fast/slow/signal lengths)
• Moving average periods
• Volume spike multiplier
• Toggle individual display elements (levels, MAs, labels)
Best Practices
• Use on 5-minute charts for entries, confirm on 15-minute for direction
• Focus on Medium and Strong signals; Weak signals provide context only
• Strong signals (5-6 confirmations) have the highest win rate
• Pay special attention to reversals at premarket high/low - these levels frequently hold
• Previous day high/low often acts as major support/resistance
• Always use proper risk management and stop losses
• Works best in moderately trending markets
Alert Capabilities
Set custom alerts for:
• Strong long/short signals
• All entry signals (medium + strong)
• Exit warnings for open positions
Ideal For
• Daytraders and scalpers (especially SPY, QQQ, and liquid equities)
• Swing traders seeking precise entries
• Traders who prefer confirmation-based systems
• Anyone looking to reduce false signals with multi-factor validation
• Traders who utilize premarket levels in their strategy
Technical Notes
• Uses Pine Script v6
• Premarket hours: 4:00 AM - 9:30 AM EST
• Previous day levels pulled from daily timeframe for accuracy
• Maximum 500 labels to maintain chart performance
• All key levels update dynamically in real-time
________________________________________
Note: This indicator provides signal analysis only and should be used as part of a complete trading strategy. Past performance does not guarantee future results. Always practice proper risk management.

Moving VWAP-KAMA CloudMoving VWAP-KAMA Cloud
Overview
The Moving VWAP-KAMA Cloud is a high-conviction trend filter designed to solve a major problem with standard indicators: Noise. By combining a smoothed Volume Weighted Average Price (MVWAP) with Kaufman’s Adaptive Moving Average (KAMA), this indicator creates a "Value Zone" that identifies the true structural trend while ignoring choppy price action.
Unlike brittle lines that break constantly, this cloud is "slow" by design—making it exceptionally powerful for spotting genuine trend reversals and filtering out fakeouts.
How It Works
This script uses a unique "Double Smoothing" architecture:
The Anchor (MVWAP): We take the standard VWAP and smooth it with a 30-period EMA. This represents the "Fair Value" baseline where volume has supported price over time.
The Filter (KAMA): We apply Kaufman's Adaptive Moving Average to the already smoothed MVWAP. KAMA is unique because it flattens out during low-volatility (choppy) periods and speeds up during high-momentum trends.
The Cloud:
Green/Teal Cloud: Bullish Structure (MVWAP > KAMA)
Purple Cloud: Bearish Structure (MVWAP < KAMA)
🔥 The "Reversal Slingshot" Strategy
Backtests reveal a powerful behavior during major trend changes, particularly after long bear markets:
The Resistance Phase: During a long-term downtrend, price will repeatedly rally into the Purple Cloud and get rejected. The flattened KAMA line acts as a "concrete ceiling," keeping the bearish trend intact.
The Breakout & Flip: When price finally breaks above the cloud with conviction, and the cloud flips Green, it signals a structural regime change.
The "Slingshot" Retest: Often, immediately after this flip, price will drop back into the top of the cloud. This is the "Slingshot" moment. The old resistance becomes new, hardened support.
The Rally: From this support bounce, stocks often launch into a sustained, multi-month bull run. This setup has been observed repeatedly at the bottom of major corrections.
How to Use This Indicator
1. Dynamic Support & Resistance
The KAMA Wall: When price retraces into the cloud, the KAMA line often flattens out, acting as a hard "floor" or "wall." A break of this wall usually signals a genuine trend change, not just a stop hunt.
2. Trend Confirmation (Regime Filter)
Bullish Regime: If price is holding above the cloud, only look for Long setups.
Bearish Regime: If price is holding below the cloud, only look for Short setups.
No-Trade Zone: If price is stuck inside the cloud, the market is traversing fair value. Stand aside until a clear winner emerges.
3. Multi-Timeframe Versatility
While designed for trend confirmation on higher timeframes (4H, Daily), this indicator adapts beautifully to lower timeframes (5m, 15m) for intraday scalping.
On Lower Timeframes: The cloud reacts much faster, acting as a dynamic "VWAP Band" that helps intraday traders stay on the right side of momentum during the session.
Settings
Moving VWAP Period (30): The lookback period for the base VWAP smoothing.
KAMA Settings (10, 10, 30): Controls the sensitivity of the adaptive filter.
Cloud Transparency: Adjust to keep your chart clean.
Alerts Included
Price Cross Over/Under MVWAP
Price Cross Over/Under KAMA
Cloud Flip (Bullish/Bearish Trend Change)
Tip for Traders
This is not a signal entry indicator. It is a Trend Conviction tool. Use it to filter your entries from faster indicators (like RSI or MACD). If your fast indicator signals "Buy" but the cloud is Purple, the probability is low. Wait for the Cloud Flip
