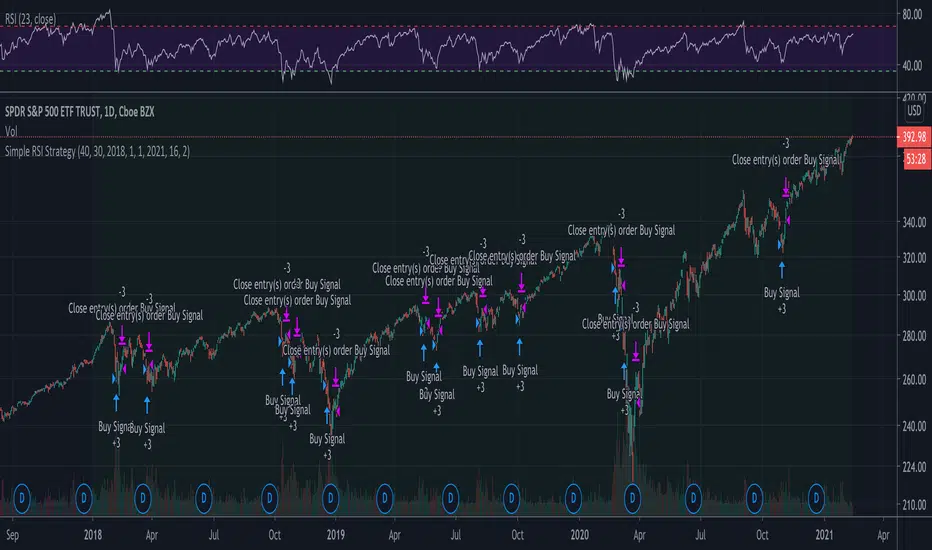
Example of Simple RSI Buy/Sell at a level and hold for 10 daysScript implements strategy:
1 Buy at RSI (10) < 30
2 Sell at RSI (10) > 40 or after 10 days
The strategy is not profitable for long term trading.
Cerca negli script per "10年期国债+交易单位+价格"
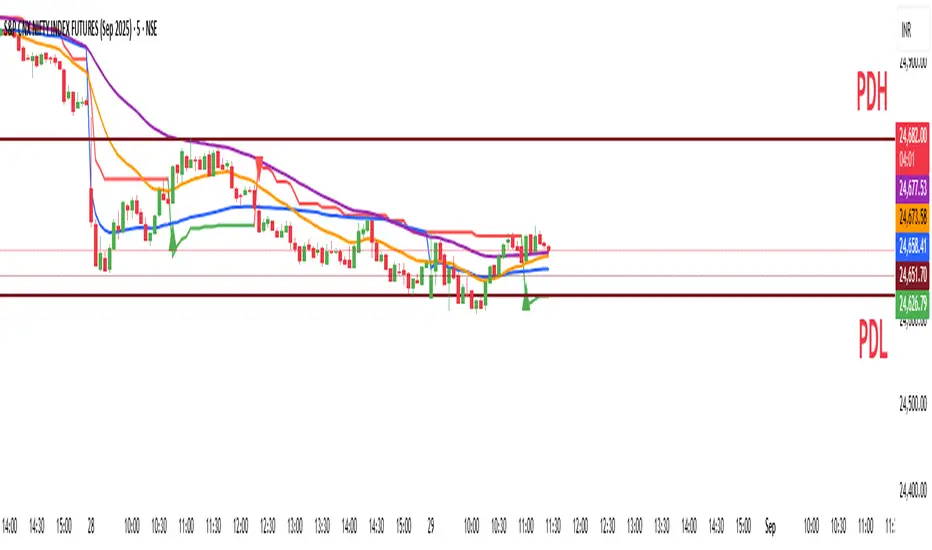
EMA 5/10/21 SMA 50/100/200The Script is mixture of both EMAs and SMAs. EMA 5/10/21 are powerful indicators for short term providing more weightage to the recent prices. SMA 50/100/200 provide the long term view.
5 Day EMA: This is a sign of strong momentum. It tracks the trend in the short term time frame. This is support in the strongest up trends. This line can only be used in low volatility trends with strong momentum. A break back above this line is a sign for me that an uptrend may be resuming. I primarily use it as an end of day trailing stop. It is rare that this line does not break intraday, even in the strongest trending markets.
• 10 day EMA: The 10 day EMA is a great moving average to use to keep you on the right side of the major market trend. It is usually the first line to be lost before any real trouble begins. It can be used as a standalone signal in some stocks and markets that tend to trend strongly in one direction for long periods.
• 21 day EMA: This is the intermediate term moving average. It is generally the last line of support in a volatile uptrend. To me, it is the inevitable reversion to the mean in a market when it finally pulls back after an extended trend.
• 50 day SMA: This is the line that strong leading stocks typically pull back to. This is usually the support level for strong uptrends. It is normal for uptrending markets to pull back to this line and find support. Most bull markets and uptrends will pull back to this level. It is generally a great “Buy the dip” level.
• 100 day SMA: This is the line that provides the support between the 50 day and the 200 day. If it does not hold as support, there is a high probability that the 200 day SMA is the next stop. This is the deeper pullback level in bull markets and uptrends. It usually presents a great risk/reward ratio in bull markets.
• 200 day SMA: Bulls like to buy dips when markets are trading above the 200 day moving average, while bears sell rallies short below it. Bears usually win below this line, as the 200 day becomes longer term resistance, and bulls buy pullbacks to the 200 day as long as the price stays above it. This line is one of the biggest signals in the market telling you which side to be on. Bull above, Bear below. Bad things happen to stocks and markets when this line is lost.

Ema Cross, 10 /21 / 55Ema Cross tool using Ema 10 / Ema 21 / Ema 55
I have found these settings very useful for catching breakouts on Alt coins.
Alerts Added,
Breakout = Ema 10 crossing above Ema 21
Breakdown = Ema 10 crossing under Ema 21
Ema 55 added as a useful area to catch dips when price is trending

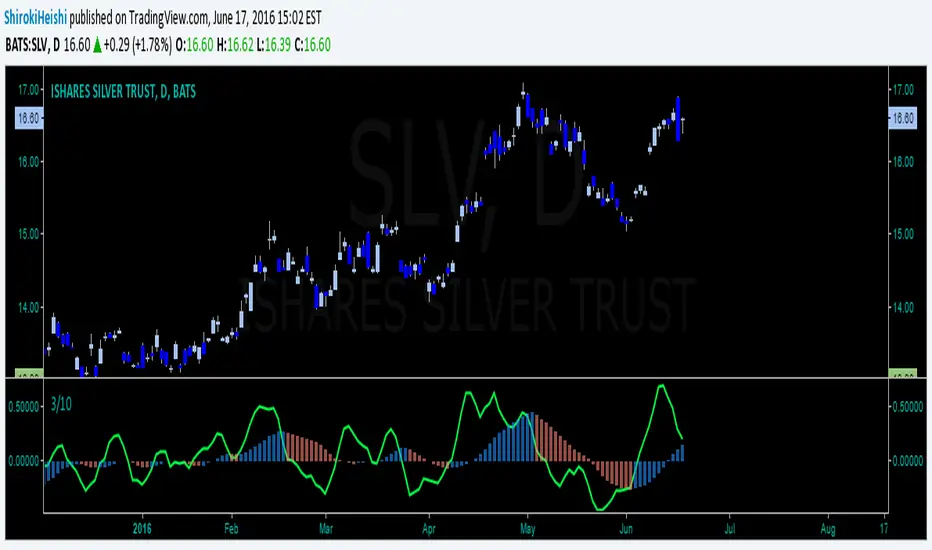
Linda Raschke - 3/10 oscillator The MACD indicator is very useful when thinking of it in terms of momentum and trend and not as a holy grail.
There are many settings that can be used and I prefer to use the settings that reflect the 3/10 oscillator (Raschke).
While you can simply input the numbers 3,10,16 into your standard MACD, the proper 3/10 uses simple averages.

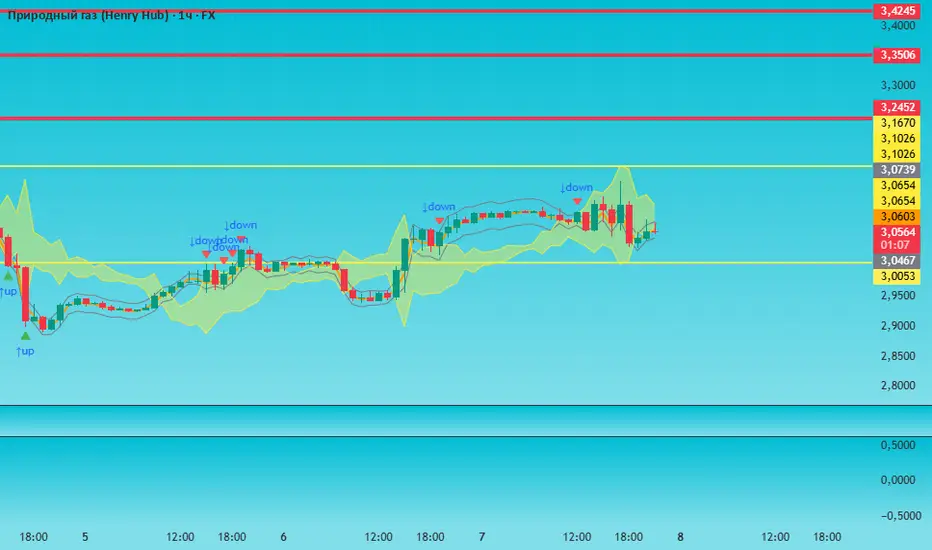
COG-10 + Deviation BandsClassic Center of Gravity, COG
«Center of Gravity»
COG is a weighted moving average, in which new bars have more weight, and old ones have less.
Formula (Pine equivalent):
COG = – Σ (price × (i+1)) / Σ price
• i = 0 – the most recent bar
• i = length-1 – the oldest bar
The minus sign simply flips the curve so that the extremes coincide with the price reversals.
Bars: | 9 | 8| 7 | 6| 5| 4| 3 | 2 | 1 | 0 |
Weight: |1 | 2 | 3 | 4| 5| 6| 7| 8 | 9| 10|
Where COG is used
Reversal zones
– when the price moves far from the COG, it is considered «overbought/oversold»; return to COG – potential reversal.
Dynamic support/resistance
– in a sideways trend, the price often bounces off the COG.
Trend filter
– if COG grows → uptrend, falls → downtrend.
Strategy pairs
• COG + deviation bands (analogous to Bollinger) is given in lines
• COG + RSI – confirmation of divergences
• COG + volume (weighted by volume) is given in yellow lines
Перевод для русской аудитории
Classic Center of Gravity, COG
«Центр тяжести»
COG – это взвешенное скользящее среднее, в котором новые бары имеют больший вес, а старые – меньший.
Формула (Pine-эквивалент):
COG = – Σ (price × (i+1)) / Σ price
• i = 0 – самый свежий бар
• i = length-1 – самый старый бар
Знак «минус» просто переворачивает кривую, чтобы экстремумы совпадали с разворотами цены.
Бары: | 9 | 8| 7 | 6| 5| 4| 3 | 2 | 1 | 0 |
Вес: |1 | 2 | 3 | 4| 5| 6| 7| 8 | 9| 10|
Где применяют COG
Разворотные зоны
– когда цена отходит далеко от COG, считается «перекупленностью/перепроданностью»; возврат к COG – потенциальный разворот.
Динамическая опора/сопротивление
– в боковике цена часто отталкивается от COG.
Фильтр тренда
– если COG растёт → восходящий тренд, падает → нисходящий.
Пары стратегий
• COG + полосы отклонения (аналог Bollinger) приводится в линиях
• COG + RSI – подтверждение дивергенций
• COG + объём (взвешивать по volume) приводится в желтых линиях
Customizable 10‑MA SuiteCustomizable 10‑Moving‑Average Suite
OverviewPlot up to 10 independent moving averages on a single chart. Every line can be tailored to your trading style with adjustable length, timeframe, MA type (SMA, EMA, WMA, RMA, VWMA, HMA, LinReg), data source, colour, width, and plot style.
Key Features
True multi‑time‑frame support via request.security(): mix intraday and higher‑time‑frame MAs effortlessly.
Fine‑grained visibility control: toggle each MA on/off to keep charts clean and script performance high.
Versatile display options: choose between line, step, histogram, or area plots for every MA.
Typical Use‑Cases
Quickly compare short‑, medium‑, and long‑term trends.
Identify dynamic support/resistance and moving‑average crossovers.
Add confluence to existing strategies or discretionary setups.
Pro TipHighlight your primary trend MA with a thicker line and bolder colour, while setting secondary MAs to thinner or dashed styles—this keeps focus where it matters and prevents visual clutter.
Enjoy!
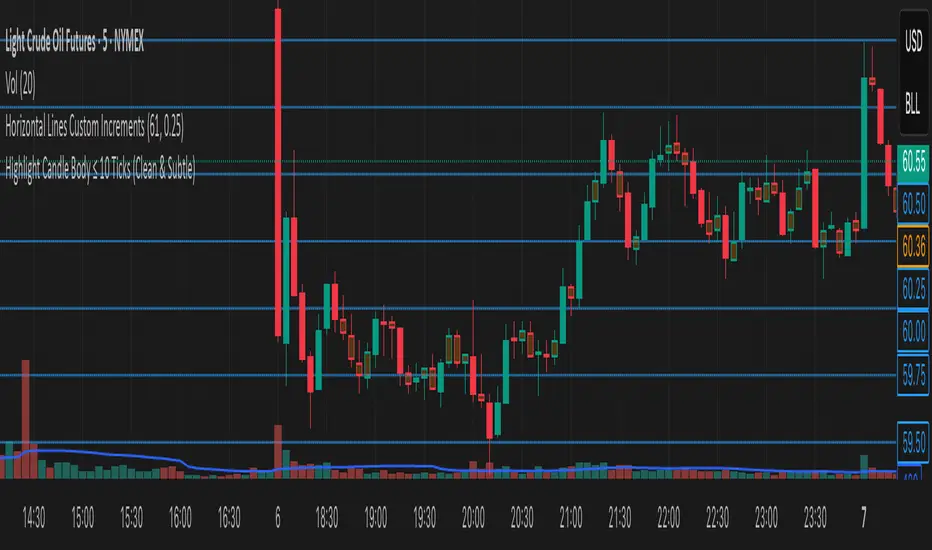
Highlight Candle Body ≤ 10 Ticks (Clean & Subtle)Purpose:
This indicator highlights candlesticks where the body size (difference between open and close) is 10 ticks or less, specifically for instruments like Crude Oil futures (CL) where 1 tick = 0.01.
How it works:
It calculates the body size: abs(close - open)
If the body is ≤ 0.10 (10 ticks), the candle is softly colored in muted orange.
Wicks are ignored — only the body is considered.
No additional shapes or markers — clean and minimal.
Use case:
Helps identify periods of indecision or low momentum — such as potential pause candles, traps, or setups just before volatility returns.
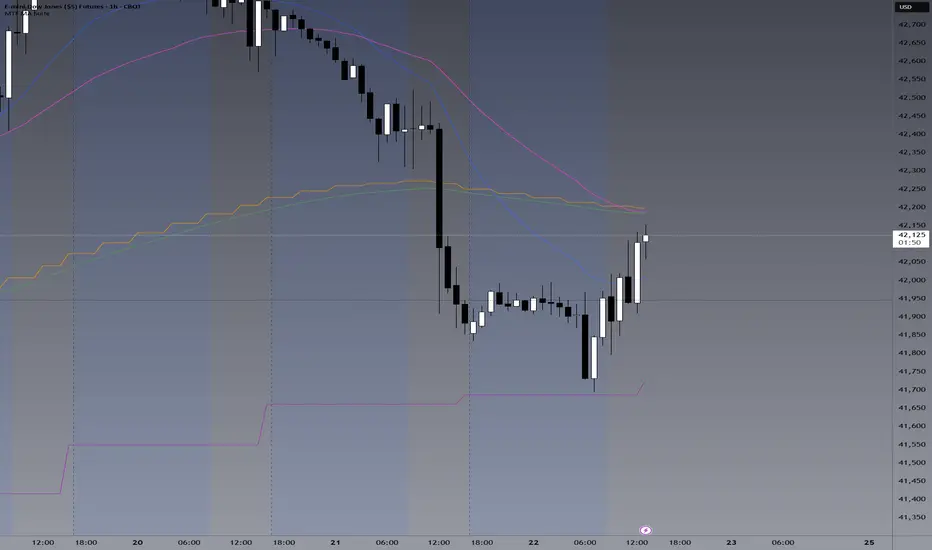
China 10-Year Yield Inverted with Time Lead (Months)The "China 10-Year Yield Inverted with Time Lead (Months)" indicator is a Pine Script tool for TradingView that displays the inverted China 10-Year Government Bond Yield (sourced from TVC:CN10Y) with a user-defined time lead or lag in months. The yield is inverted by multiplying it by -1, making a rising yield appear as a downward movement and vice versa, which helps visualize inverse correlations with other assets. Users can input the number of months to shift the yield forward (lead) or backward (lag), with the shift calculated based on the chart’s timeframe (e.g., 20 bars per month on daily charts). The indicator plots the shifted, inverted yield as a blue line in a separate pane, with a zero line for reference, enabling traders to analyze leading or lagging relationships with other financial data, such as the PBOC Balance Sheet or Bitcoin price.

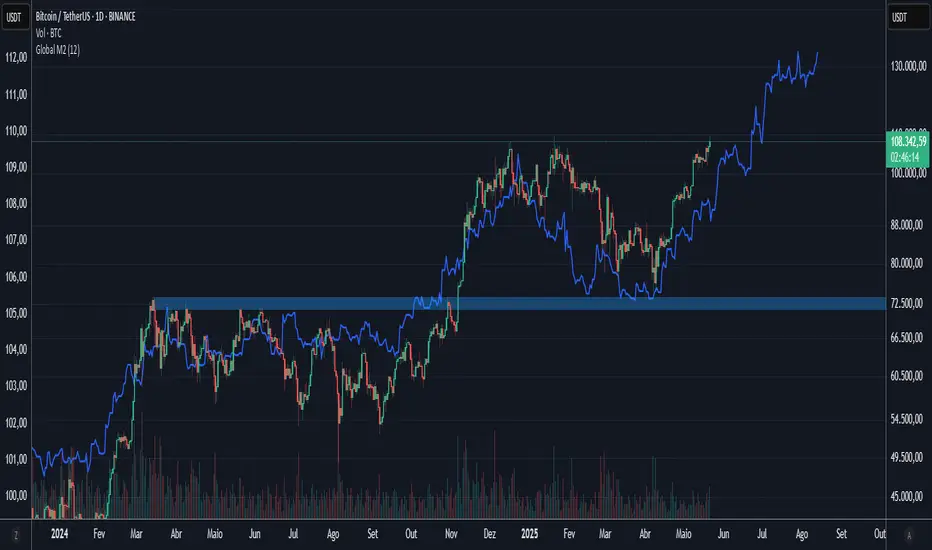
Global M2 10-Week Lead (for bitcoin)This script displays a combined view of the Global M2 Money Supply, converted to USD and adjusted with a configurable forward lead (default 10 weeks). It is designed to help visualize macro liquidity trends and anticipate potential impacts on Bitcoin price movements across any timeframe.
🔹 Main Features:
- Aggregates M2 data from 18 countries and regions including the USA, Eurozone, China, Japan, and more.
- All M2 values are converted to USD using respective exchange rates.
- Customizable “Slide Weeks Forward” setting lets you project global liquidity data into the future.
- Works on all timeframes by adjusting the projection logic dynamically.
- Toggle each country’s data on or off to customize the liquidity model.
💡 Use Case:
Global liquidity is often a leading indicator for major asset classes. This tool helps traders and analysts assess macro-level trends and their potential influence on Bitcoin by looking at changes in M2 money supply worldwide.
💡 Inspired By:
This tool mimics the Global M2 10-Week Lead liquidity indicator often referenced by Raoul Pal of Real Vision and Global Macro Investor, used for macro analysis and Bitcoin movement prediction.
📊 Note:
All economic and FX data is sourced from TradingView’s built-in datasets (ECONOMICS and FX_IDC). Data availability may vary depending on your plan.
Altseason Index (Top 10)### Altseason Index (Top 10)
#### Overview
The "Altseason Index (Top 10)" indicator identifies whether the market is in an altseason (altcoins outperforming Bitcoin) or a Bitcoin season. It analyzes the performance of 9 top altcoins (ETH, BNB, ADA, XRP, SOL, DOT, AVAX, SHIB, LINK) against Bitcoin over 90 days, inspired by the Blockchain Center Altcoin Season Index.
#### How It Works
- Calculates the 90-day price change for BTC and 9 altcoins.
- Counts how many altcoins outperform BTC.
- Index = (number of outperforming altcoins / 9) * 100.
- >75%: Altseason (green zone).
- <25%: Bitcoin season (red zone).
- 25–75%: Neutral.
#### Visualization
- Blue line: Index value (0–100).
- Green line at 75: Altseason threshold.
- Red line at 25: Bitcoin season threshold.
- Green/red background fill for altseason/BTC season zones.
#### Usage
Add to your chart and interpret:
- Above 75: Consider altcoin investments.
- Below 25: Focus on Bitcoin.
Ensure tickers match your exchange (e.g., "BTCUSD" or "BINANCE:BTCUSDT").
#### Notes
- Limited to 9 altcoins due to TradingView's request.security() limit.
- Best on daily charts but adaptable to other timeframes.

Crypto Strategy SUSDT 10 minThis strategy is designed to trade the **SUSDT** pair on a **10-minute time frame**, using a combination of an Exponential Moving Average (EMA) and percentage-based Stop Loss (SL) and Take Profit (TP) levels.
### How the strategy works:
1. **EMA Calculation**:
- The strategy calculates a 24-period Exponential Moving Average (EMA) based on the closing price.
- This EMA serves as the primary trend indicator.
2. **Entry Conditions**:
- **Long Position**: A long position is entered when the closing price is above the EMA and the opening price is below the EMA. This indicates a potential upward trend.
- **Short Position**: A short position is entered when the closing price is below the EMA and the opening price is above the EMA. This indicates a potential downward trend.
3. **Stop Loss and Take Profit**:
- Both Stop Loss (SL) and Take Profit (TP) are calculated based on the entry price of the position.
- **For Long Positions**:
- Stop Loss is set as a percentage below the entry price.
- Take Profit is set as a percentage above the entry price.
- **For Short Positions**:
- Stop Loss is set as a percentage above the entry price.
- Take Profit is set as a percentage below the entry price.
- The percentage values for SL and TP can be adjusted in the strategy's settings (default: SL = 2%, TP = 4%).
4. **Exit Conditions**:
- The position is closed automatically when either the Stop Loss or Take Profit level is reached.
5. **Visualization**:
- The 24-period EMA is plotted on the chart as a blue line, helping visualize the trend direction.
### Key Features:
- **Pair and Time Frame**: The strategy is optimized for the SUSDT pair on a 10-minute time frame.
- **Customizable Parameters**: Users can adjust the Stop Loss and Take Profit percentages to suit their risk tolerance and trading style.
- **Trend-Following Approach**: The strategy uses the EMA to identify and follow the current market trend.
This strategy is simple yet effective for capturing trends while managing risk through predefined Stop Loss and Take Profit levels.

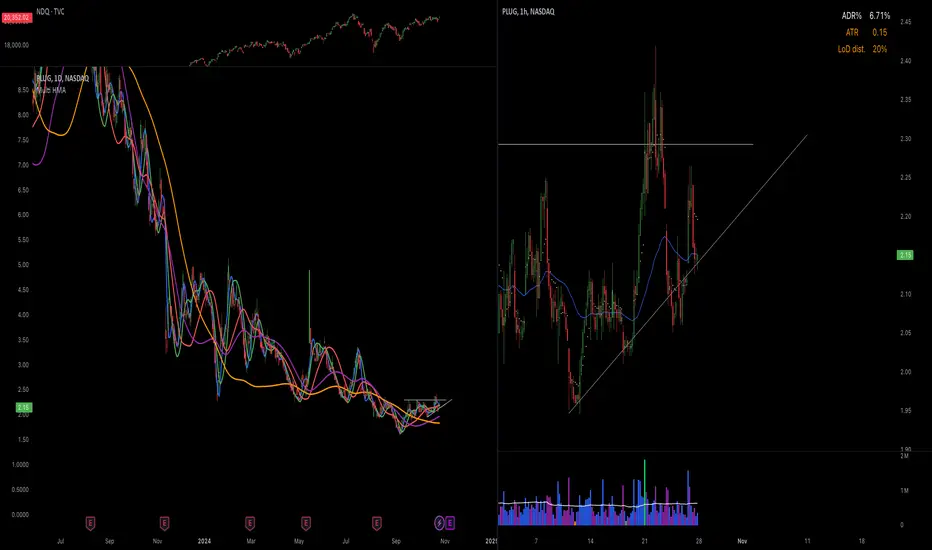
Hull Moving Averages 10, 20, 50, 100, 200This script generates multiple Hull Moving Averages (HMAs) on a trading chart, allowing for comprehensive trend analysis across different timeframes. Five HMAs with lengths of 10, 20, 50, 100, and 200 periods are plotted on the chart, providing insights into short, medium, and long-term market trends.
Each HMA can be customized with individual colors to easily distinguish between the different timeframes, helping traders visually track momentum changes and trend strength across these intervals. The Hull Moving Average is known for reducing lag compared to other moving averages, which makes it particularly useful for identifying turning points more accurately.
With this script:
You can adjust the colors of each HMA line individually, ensuring optimal visual differentiation.
You can analyze short-term trends with HMA 10 and HMA 20, medium-term trends with HMA 50, and long-term trends with HMA 100 and HMA 200.
The chart provides an at-a-glance view of multi-timeframe trends, making it useful for trading strategies that rely on crossovers or divergence patterns.
This tool is ideal for traders who want to identify trend direction, strength, and possible reversal points with minimal lag.
Indicator 10**Indicator 10** is a sophisticated technical analysis tool designed for use on trading platforms that support Pine Script (version 5). This indicator is primarily focused on analyzing price movements over different timeframes, incorporating elements of ZigZag analysis, Fibonacci levels, and historical price range calculations. Below is a detailed description of its features and functionalities:
#### Key Features:
1. **Input Variables:**
- **Year_calc:** Specifies the number of years to consider for historical price range calculations.
- **Size_fibo:** Defines the size of the Fibonacci levels in points.
- **Dig:** Represents the minimum tick size for the instrument being analyzed.
- **ZigZag Parameters:**
- **Period (zigzag_len):** The length of the ZigZag indicator.
- **Depth (zigzag_depth):** The depth percentage for the ZigZag indicator.
- **Display Count (zigzag_hist):** The number of ZigZag points to display.
- **Font Size (font_size):** The size of the font used for labels.
2. **Historical Price Range Calculation:**
- The indicator calculates the average weekly and monthly price ranges over the specified number of years (`Year_calc`).
- These ranges are used to adjust the Fibonacci levels dynamically based on historical volatility.
3. **ZigZag Analysis:**
- The indicator employs a custom ZigZag function to identify significant price swings on different timeframes (H4, D1, W1).
- The ZigZag points are stored in arrays, allowing for the visualization of recent price swings.
4. **Fibonacci Adjustment:**
- The Fibonacci levels are adjusted based on the historical price ranges (`W1_Val`, `MN1_Val`, `D1_Val`).
- These adjusted levels are used to draw support and resistance lines on the chart.
5. **Visualization:**
- The indicator draws lines and labels on the chart to represent the ZigZag points and adjusted Fibonacci levels.
- Different colors are used to distinguish between upward and downward trends.
6. **Dynamic Updates:**
- The indicator continuously updates the ZigZag points and Fibonacci levels as new price data becomes available.
- It ensures that only the most recent ZigZag points are displayed, maintaining a clean and relevant chart.
#### How It Works:
1. **Initialization:**
- The indicator initializes variables for storing historical price ranges and ZigZag points.
- It sets the start date for historical calculations based on the current year minus the specified number of years (`Year_calc`).
2. **Historical Data Retrieval:**
- The indicator retrieves weekly and monthly high and low prices for the specified period.
- It calculates the total price range and the average range for each timeframe.
3. **ZigZag Calculation:**
- The custom ZigZag function identifies local highs and lows based on the specified period and depth.
- These points are stored in arrays for later visualization.
4. **Fibonacci Adjustment:**
- The Fibonacci levels are adjusted based on the historical price ranges and the specified Fibonacci size.
- These adjusted levels are used to draw lines on the chart.
5. **Visualization:**
- The indicator draws lines connecting ZigZag points and labels indicating the direction of the trend.
- It ensures that only the most recent ZigZag points are displayed, maintaining a clean and relevant chart.
6. **Continuous Updates:**
- The indicator continuously updates the ZigZag points and Fibonacci levels as new price data becomes available.
- It ensures that only the most recent ZigZag points are displayed, maintaining a clean and relevant chart.
#### Conclusion:
**Indicator 10** is a powerful tool for traders who rely on historical price analysis, ZigZag patterns, and Fibonacci levels to make trading decisions. Its dynamic and adaptive nature ensures that the chart remains relevant and useful, providing traders with a clear view of recent price movements and potential support/resistance levels.

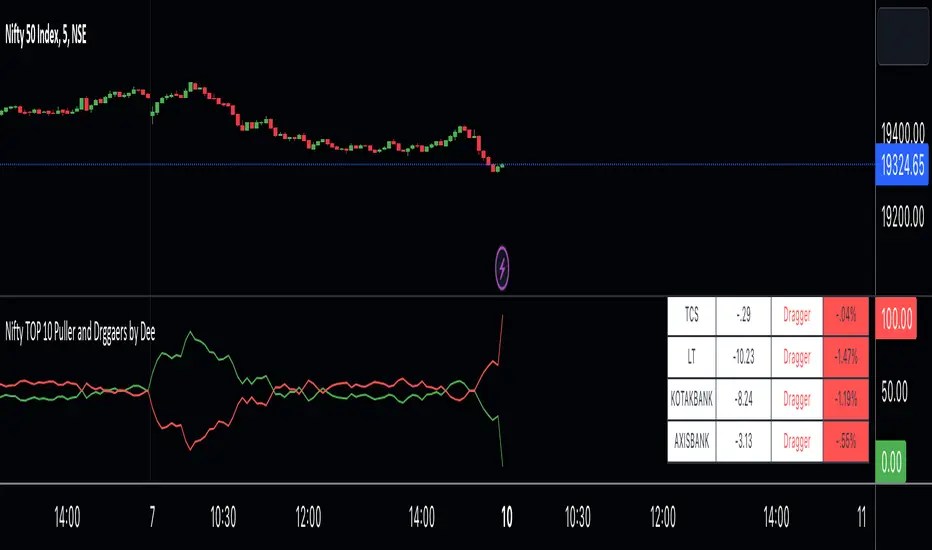
Nifty TOP 10 Puller and Drggaers by Deehi guys this is a straightforward indicator that shows the top 10 nitty pullers and dragger
How to use it ?
in the table, you can see the values of each puller and dragger well as their contribution amount and it will show if they puller or dragger
graph shows the puller and dragger using a line
both have max 100 points allocated
if they exceed the 100 points then a line will struck their ( point to remember ) it does not glitch
so it will give Ruf idea of who is strong
if buyers are strong then the green lien will always be upside
if sellers are string then the red line will always be upside
*Cross Over *
there are 2 types of cross over 1 is bull cross over other is bear cross over
when bulls are strong they will cross over the red from the bottom it showing that significantly strong
when bear is strong they will cross over the green from the bottom it shows that bear is significantly strong
hope you understand how to use it
we have limitation in trading view so we choose only 10 stock to calculate the %
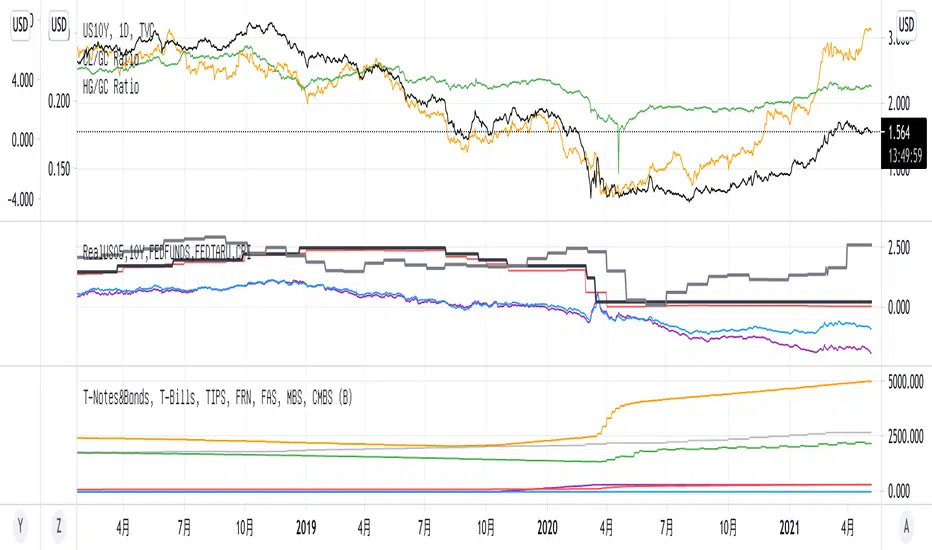
Gov Bonds Real Rates 10/05Y, FED RATEs, CPIGov Bonds Real Rates 10/05Y, FED RATEs, CPI。美国经济数据10年债和5年债实际收益率,美国目标利率和实际利率,CPI消费者物价指数
Superstock 10-30 WMA Band script I was reading Jesse Stine's Insider Buy Superstocks book, and one of the technical traits he mentioned of a superstock (read the book, seriously, very strongly recommended) was a breakout above the 30 weekly moving average. He goes on to mention that after breakout, the 10 WMA often acts as a support line where you can add to your position. This script is inspired by the visual direction of Chris Moody's slingshot system, and how it displays MA's. The skinny line is the 10 WMA and the bigger line is the 30.

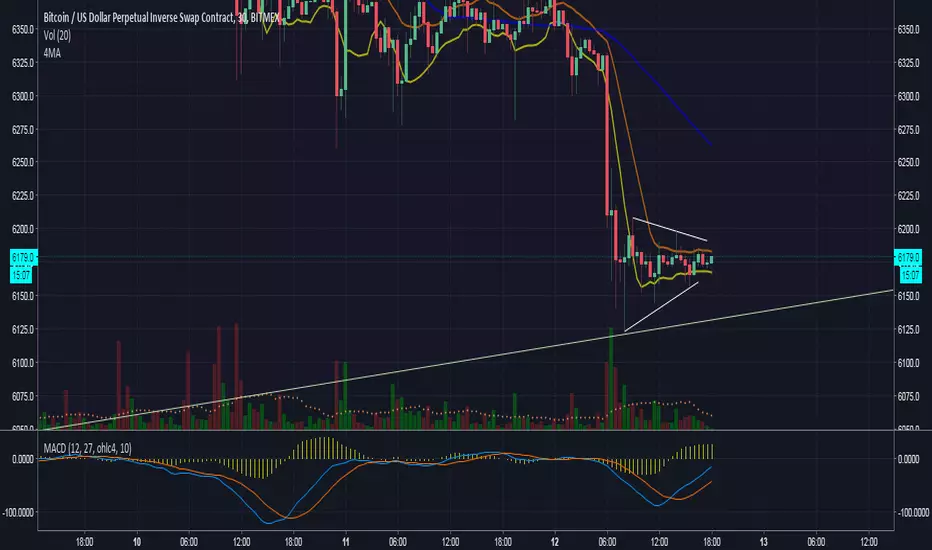
4MA - 8,10 MAC/cross, 50MA,200MA crossThis indicator displays four smoothed moving averages: 8, 10, 50 and 200. The 8, with data coming from period lows, and the 10, with data from period highs, comprise a Moving Average Channel and can be traded as such, along with the cross indicator. The 50MA and 200MA are used for broader analysis, especially that of the golden cross, in which the 50MA surpasses the 200, or the death cross, which is the opposite. All four MA's counted as one indicator which is a great advantage for those not using TradingView Pro.
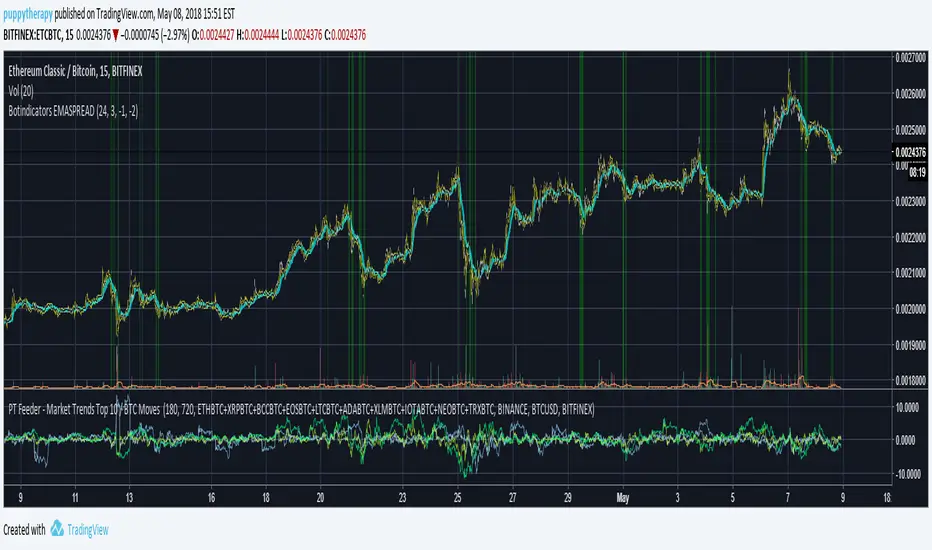
PT Feeder - Market Trends Top 10 / BTC Moves Becasue nobody was kind enough to post some PT Feeder scripts and i knew i could just modify my trends / btc script that i originally created for PT Magic. Well i just did it.
What is this script for ? PT Feeder it allows you to better imagine what kind of values you should be expecting when setting the Market Trends and BTC moves.
Green are top 10 Markets:
"MaxTopCoinLongTermAverageChange": "-3"
"MinBaseCoinPriceChange": "3",
Blue is BTC:
"MinBaseCoinLongTermPriceChange": "-3"
"MaxBaseCoinPriceChange": "3",
Why only 10 markets well becasue tradingview is very limited but it is still better than nothing.
If you like agree and follow !
3/10 OscConstance Brown liked to use this by taking the first break of the zero line by the 3/10 oscillator in the direction of the trend-line relative to above or below zero. The similarities between the histogram and the MACD histogram are striking and its use is almost the same. Useful for seeing divergence in the same way noted by DR. Elder, take the first opposite colored bar after divergence which he stated was to have one peak lower than the previous but must break below zero in between. (opposite is true for bearish play)
I offer no updates to its use. this is the 3/10 oscillator popularized by Constance Brown. The only customization done here is cosmetic. This is just a copy for the user who saw my screen and wanted it exactly how mine was.
Enjoy responsibly, and as always, if you use this, take responsibility for your actions for good or ill, because I cannot be.
Good trading all,
Shiroki