BTC Volume Stacked [v2018-11-17] @ LekkerCryptisch.nlCombine the volume of 8 BTCUSD(T) exchanges in one graph.
Two use cases:
1) Stack the absolute volume to see the combined volume in BTC over time.
2) Stack the relative volume to see the relative size of exchange change over time.
Cerca negli script per "11月1日是什么星座"

The Scale Of Sacred SoundsBased on the Sacred Sound Scale
How to use it:
This indicator is designed to capture the inferred behavior of traders and investors by using two groups of averages.
Meant for longer trades and trend indicator.
Used on any timescale as needed.
Can trade on long or short where the slow MA crosses fast Ma or where the Slow MA compresses and flips open again.
Follow the trend to the end - pot of gold at the end of the rainbow :-)
References:
Based on Daryl Guppy GMMA and
www.guppytraders.com
Read more at:
whatmusicreallyis.com
There is one tuning in which the frequencies 432, 528, 424 and 440 Hz can peacefully coexist. The scale has 32+1 pure harmonic tones and the reference frequency of 256 Hz. It comes from the Natural Ascending Series of Harmonics 32 to 64 of the 8 Hz Fundamental Tone, and represents its 6th double. I call this tuning The Scale of Sacred Sounds.
Representation using ancient Sumerian/Babylonian/Vedic math:
32; 33; 34; 35; 36; 37; 38; 39; 40; 41; 42; 43; 44; 45; 46; 47; 48; 49; 50; 51; 52; 53; 54; 55; 56; 57; 58; 59; 60; 61; 62; 63; 64
Representation using musical ratios:
1/1; 33/32; 17/16; 35/32; 9/8; 37/32; 19/16; 39/32; 5/4; 41/32; 21/16; 43/32; 11/8; 45/32; 23/16; 47/32; 3/2; 49/32; 25/16; 51/32; 13/8; 53/32; 27/16; 55/32; 7/4; 57/32; 29/16; 59/32; 15/8; 61/32; 31/16; 63/32; 2/1
The math for deriving one of the above series from the other is simple. Divide all numbers from the ancient series by the first, then simplify the fractions. Conversely, the series of ratios can be turned into the series of integers by calculating their least common denominator (the smallest whole number that is a multiple of all numbers under the fraction bar) and discarding it.
Logarithmic representation using musical constants (definition given further down):
0,000; 30,772; 60,625; 89,612; 117,783; 145,182; 171,850; 197,826; 223,144; 247,836; 271,934; 295,464; 318,454; 340,927; 362,905; 384,412; 405,465; 426,084; 446,287; 466,090; 485,508; 504,556; 523,248; 541,597; 559,616; 577,315; 594,707; 611,802; 628,609; 645,138; 661,398; 677,399; 693,147

Flying Buddha Inside Bars Indicator v1 by JustUncleLDescription:
=============
This indicator plots MAs and paints Triggered Alert Arrows base on Flying Buddha candle patterns.
The “Flying Buddha” Pattern is defined as:
---------------------------------------------
A candlestick chart with two moving averages: the 5 period exponential moving average (fast EMA) and the 10 period simple moving average (slow SMA), both applied to the closing price. The default “Flying Buddha” pattern is any candlestick which:
1. Has a LOW above the fast EMA, when the fast EMA is above the slow SMA (a bearish “Flying Buddha”); or
2. Has a HIGH below the fast EMA, when the fast EMA is below the slow SMA (a bullish “Flying Buddha”).
Alert Trigger:
---------------
A Flying Buddha Alert is triggered on the first candle that is a non-flying Buddha candle after a Flying Buddha Pattern candle sequence. Flying Buddhas can optionally be filtered by InsideBars and PinBars.
The Alert Trigger is optionally filtered by the Directional MA (default=EMA 89), and/or by Minimum Sequence length of Flying Buddhas.
Moving Averages:
------------------
You can select between 11 different types of moving averages, for each MA line in Flying Buddha MAs (fastMA and slowMA) and the Directional Filter MA:
SMA = Simple Moving Average.
EMA = Exponential Moving Average.
WMA = Weighted Moving Average
VWMA = Volume Weighted Moving Average
SMMA = Smoothed Simple Moving Average.
DEMA = Double Exponential Moving Average
TEMA = Triple Exponential Moving Average.
HullMA = Hull Moving Average
SSMA = Ehlers Super Smoother Moving average
ZEMA = Near Zero Lag Exponential Moving Average.
TMA = Triangular (smoothed) Simple Moving Average.
NOTE: This is a concept indicator, I also intend to release a trading BOT suitable for Autoview, based on this concept indicator.

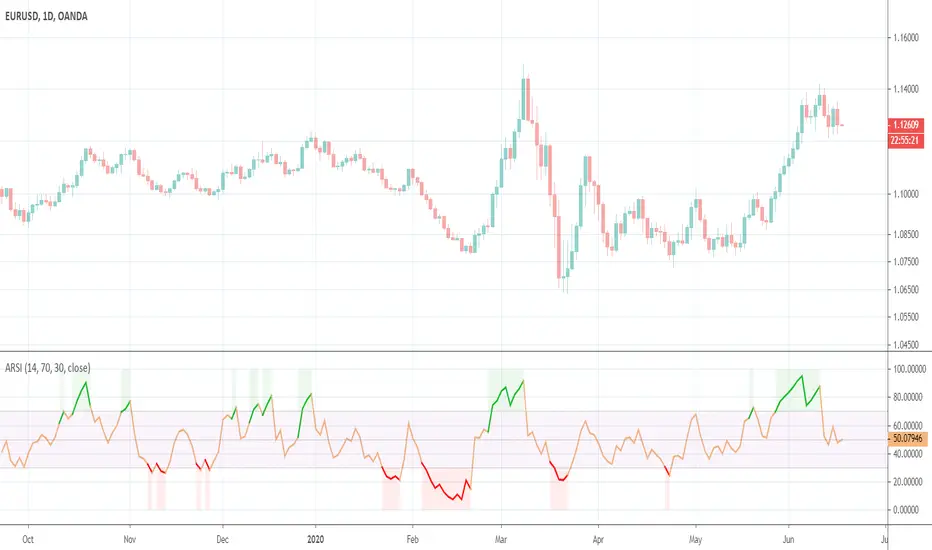
Asymmetrical RSIThis indicator was originally developed by Sylvain Vervoort (Stocks & Commodities, V.26:11 (October, 2008): "ARSI, The Asymmetrical RSI").

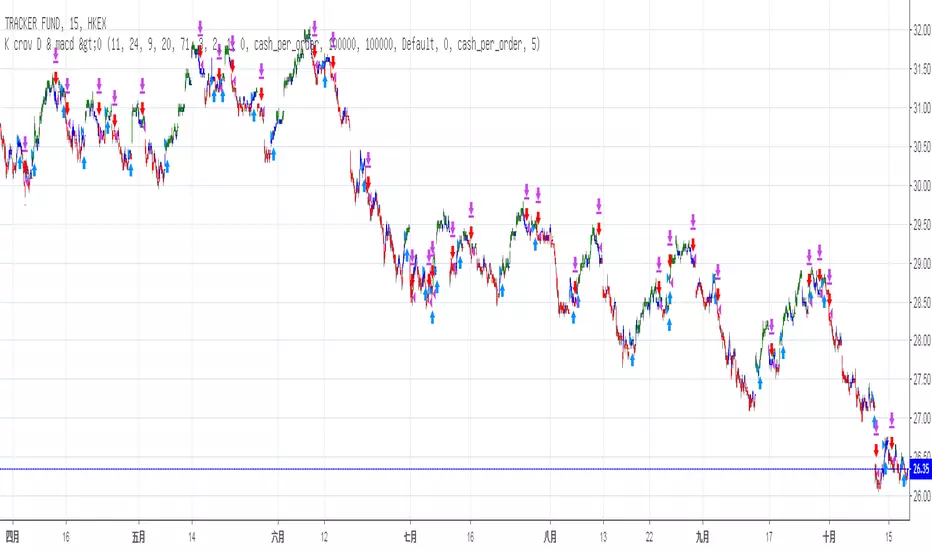
Stochastic & MACD Strategy Ver 1.0This strategy is inspired by ChartArt and jasonluk28.
The following input changes from the initial ChartArt version to achieve higher stability and profit:
Fast MA Len:11
Slow MA len: 24
Stoch Len: 20
No difference is found in minor changes (+-10) lv. of overbought/oversold
It works above 40% winning rate in Heng Heng Index, Shanghai Composite, Dow Jones Industrial Averge, S&P 500 NASDAQ, VT (World Total Market) and in 15 mins chart
Profit: above ~10 to 30% in less than 1year backtest for most major indice of China and US and ~62% in Heng Seng Index (Hong Kong) & 40.5% in SZSE Composite (Shen Zhen)
P.S. Profit: 700 (Tencent) +150.5%, 939 (CCB) +66.5%, 1299 (AIA) +45%, 2628 (CLIC) +41%, 1 (CK Hutchison) +31%
NFLX +82.5%, BABA +55.5%, AMZN +44%, GOOG +38%, MCD +24.5%
However, Loss in FB -19% , AMD -38.5%
Not suitable for stocks with great influences in News or Events ???
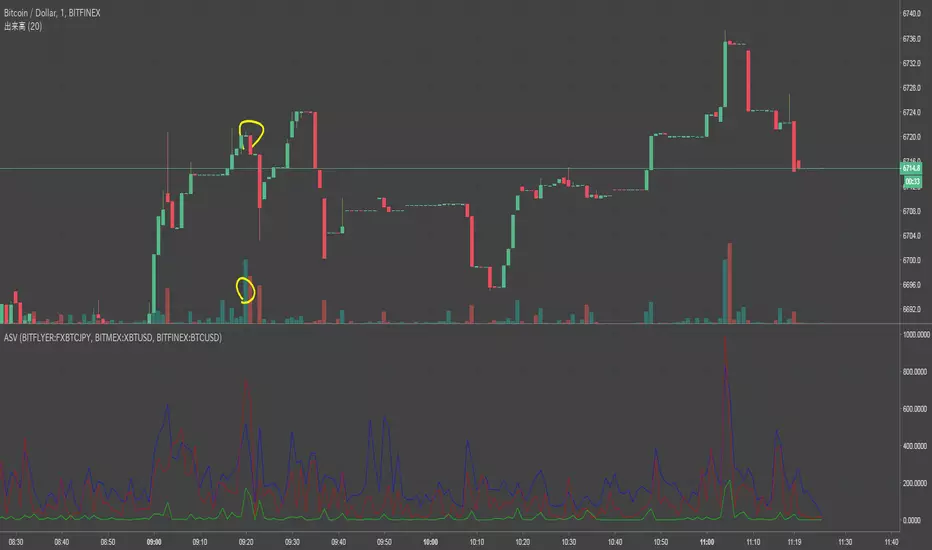
Another symbol volumepull another symbol volume
dafult:BF(blue)/MEX(red)/FINEX(lime)
*need MEX's volume devided XBTUSD
if you input another symbol as sym2, please comment out line 11 and remove "/mext" on line 12
mext=security(sym2,period,close)
plot(sym2v/mext,color=red)
//mext=security(sym2,period,close)
plot(sym2v,color=red)
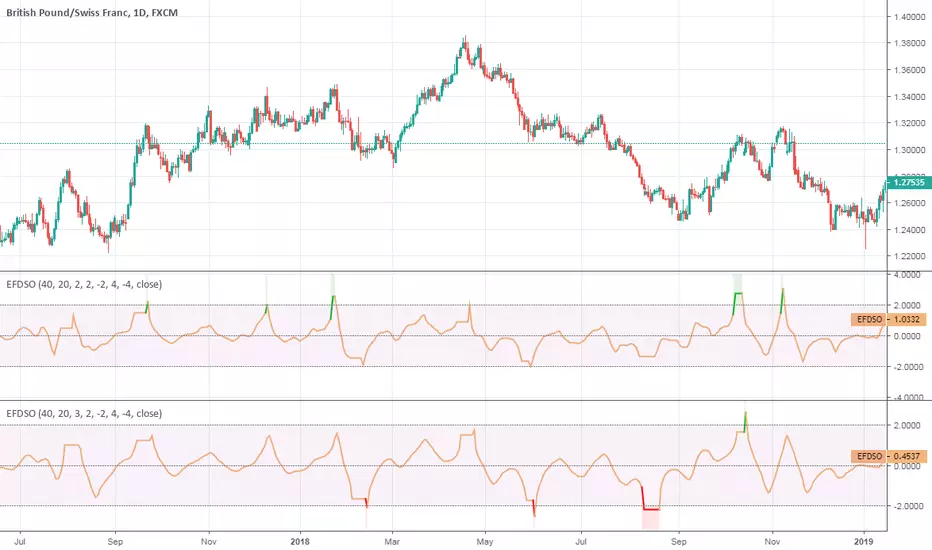
Ehlers Fisherized Deviation-Scaled OscillatorEhlers Fisherized Deviation-Scaled Oscillator script.
This indicator was originally developed by John F. Ehlers (Stocks & Commodities V. 36:11: Probability - Probably A Good Thing To Know).
Strength Candles With GapCode written by Krishna Khanna on 20/11/2017 includes the following components for NimblrTA
1) Logic for detection of strength candles, only displayed candles are of strength (BH>50%CH)
2) Wicks are not considered
3) Any Gaps are indicated with a arrow, can detect gapup and gapdown
This indicator is apt for small screen devices

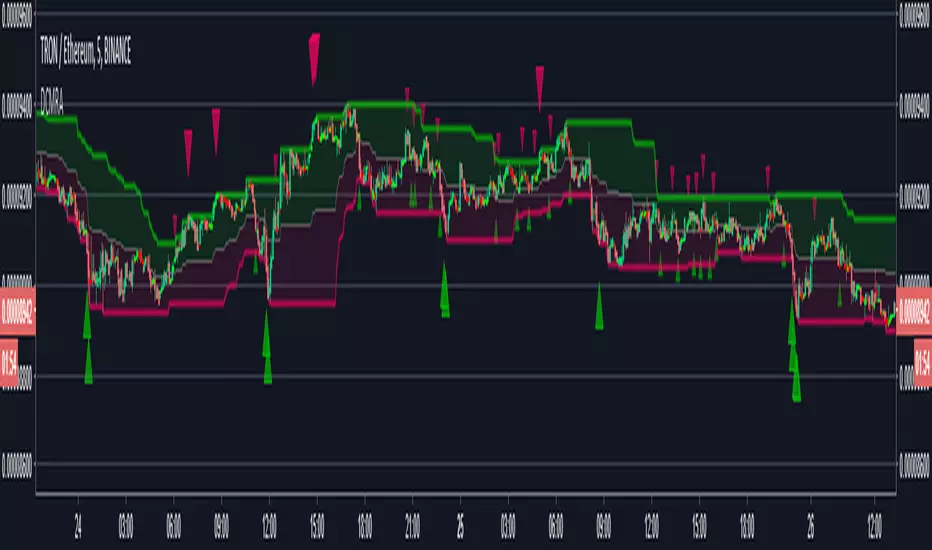
Donchian Mean Reversion AlertsDonchian Channels mean reversion signals/alerts with RSI filtering with signals applied to the mean, for strong trend situations.
Original Author: ChrisMoody
Modified Donchonian Channel with separate adjustments for upper and lower levels
Purpose is if you expect big move up, Use lower input example 3 or 4, and longer lower input, 40 - 100 and use lower input line as a stop out
Opposite if you expect big move down
Mid Line Rule in Long Example. If lower line is below entry take partial profits at Mid Line and move stop to Break even.
If Lower line moves above entry price before price retraces to midline use Lower line as Stop...Opposite if Shorting
Created by user ChrisMoody 1-30-2014
Updated 7-11-2018 by Dysrupt
Revamped for mean reversion strategy
Created midline alerts for strong trending upside buy signals/downside sell signals.
Added RSI Filtering
Added Alerts
Removed bar color change
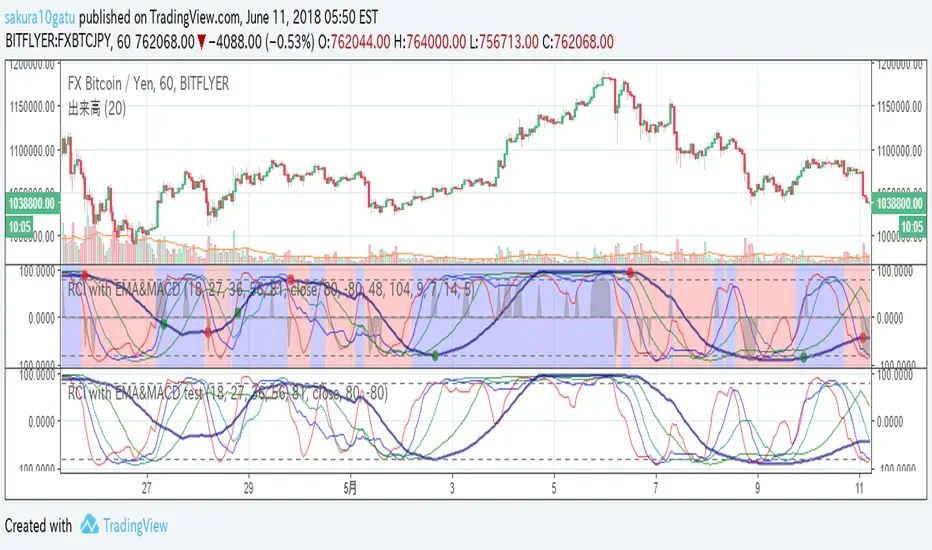
RCI with EMA&MACD2018/6/11 Re-release for house rule of Trading view.
5lines : RCI lines. A thick navy line has the longest period.
circles : MACD cross. GC=green DC=red
backcolor : Short EMA > Long EMA is blue. Short EMA < Long EMA is red.
Black shadow : It reveals its appearance when over-buying/selling.
It helps your entry.
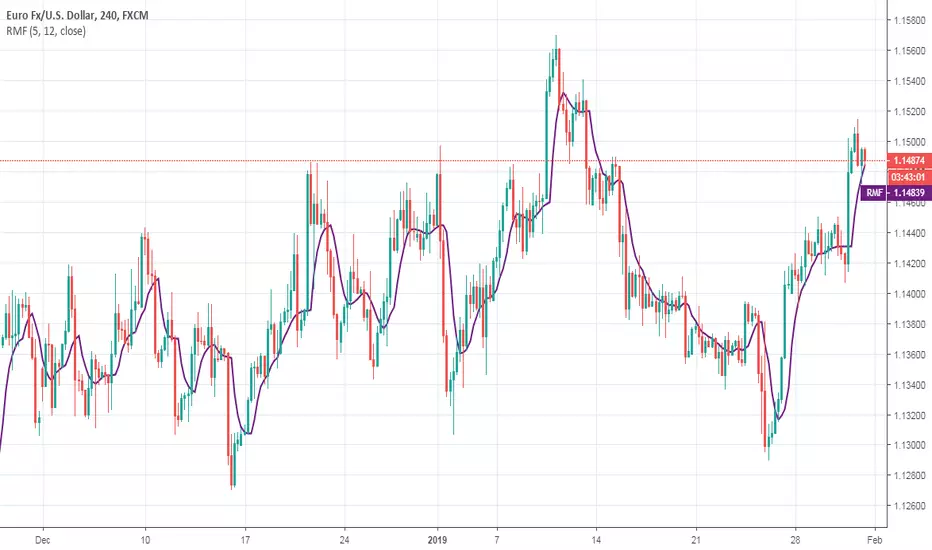
Recursive Median FilterRecursive Median Filter indicator script.
This indicator was originally developed by John F. Ehlers (Stocks & Commodities V. 36:03 (8–11): Recursive Median Filters).
Recursive Median OscillatorRecursive Median Oscillator indicator script.
This indicator was originally developed by John F. Ehlers (Stocks & Commodities V. 36:03 (8–11): Recursive Median Filters).

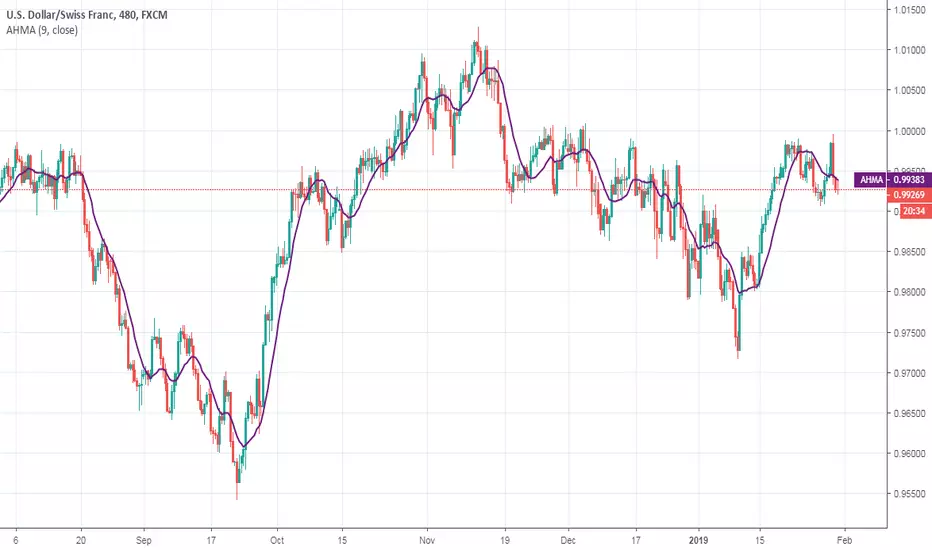
Ahrens Moving AverageAhrens Moving Average indicator script.
This indicator was originally developed by Richard D. Ahrens (Stocks & Commodities V.31:11 (26-30): Build A Better Moving Average).
Relative Momentum IndexRelative Momentum Index indicator script. This indicator was originally developed by Roger Altman (Stocks & Commodities V. 11:2 (57-60)).
RMI with momentum period of 1 will be equal to an RSI when they have the same period and source price.

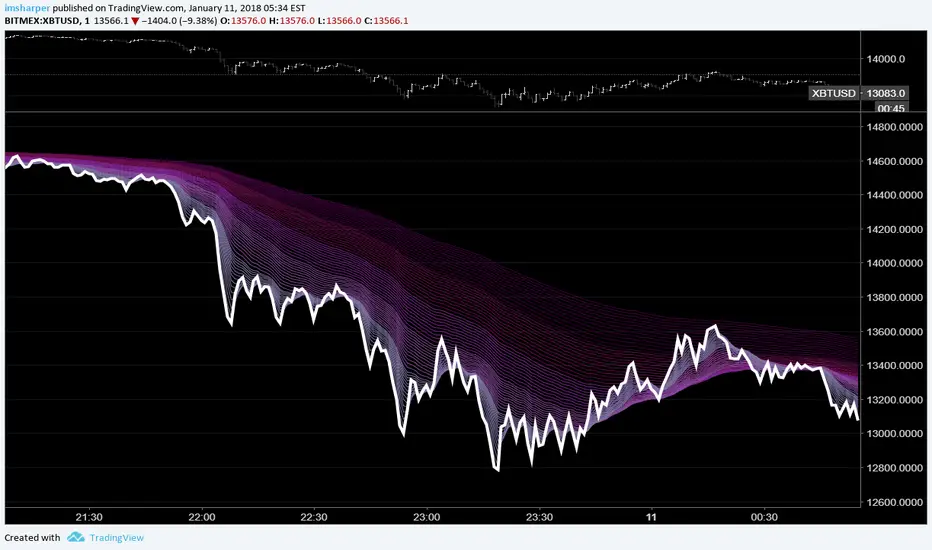
Rainbow MA StudyI've been interested in 'Multiple Moving Averages' lately and came across another script on here for a Rainbow MA.
Unfortunately its source is private and I wanted to try things out with other MA types so I put this together.
I also wanted to make it a seperate study so I could view regular bars without the clutter.
The general rule of thumb with these is the larger the price movement the wider the lines become giving you sort of a wave effect.
When the lines bunch up together you know there's going to be a breakout opportunity that will present itself.
Partly art, partly practical, entirely overkill. Enjoy!
The anchor multiplier should basically allow you to view things in relation to another time period, but it takes forever to load and will likely time out.
Since there are 63 MA's being calculated and plotted changing options on the fly takes some time to process and load.
I'm also pretty new to pine script so it's probably not the best implementation.
MA types: EMA (default), SMA, WMA, VWMA, SMMA, DEMA, TEMA, HullMA, ZEMA, TMA, SSMA
Play around with these to see some different effects.
The white line is the current close price.
Color 1 МАs: 2,3, 4, 5, 6, 7, 8, 9, 10, 11, 12, 13, 14, 15
Color 2 MAs: 17, 19, 21, 23, 25, 27, 29, 31, 33, 35, 37, 39, 41
Color 3 MAs: 44, 47, 50, 53, 56, 59, 62, 65, 68, 71, 74
Color 4 MAs: 78, 82, 86, 90, 94, 98, 102, 106, 110, 114, 118, 122
Color 5 MAs: 126, 131, 137, 143, 149, 155, 155, 161, 167, 173, 179, 185, 191, 197
You can more easily change the colors at the top of this source code instead of one by one in the settings.
If you want this on your main chart instead of a separate window you'll just need to change overlay=true in the study.
References & Thanks:
JustUncleL:
For the timeframe anchor, MA variants, and generally awesome work. This is more practical.
StickyCheeba:
For the idea.
Here's some shots to get an idea of the differences.
HullMA:
VWMA:
SSMA:
TMA:
Fibonacci Time Moving Average Ribbons [DW]This is an experimental study that takes a moving average of price, then offsets the average by up to 11 consecutive Fibonacci numbers from 1 to 144.
Choose between Kaufman's Adaptive Moving Average, Hull Moving Average, Fractal Adaptive Moving Average, Geometric Moving Average, or Exponential Moving Average.

NimblrTACode written by Krishna Khanna on 04/11/2017 and includes the following components
1) CCI MTF
This indicator will draw the following
CCI-8 on 5 minutes
CCI-34 on 5 minutes
CCI-34 on 30 minutes interval on 5 minutes
2) Strength Candle Detection
This is put a * over any strength candle
3) EMA
This will plot EMA 5, EMA 21 and EMA 55
4) Panchang Time
Includes Pre-open and 4 timeslots
5) ORB Logic
ORBH and ORBL are plotted
6) Fibonacci Levels
Levels 0.618, 1 and 1.618 are plotted
7) Highest High and Lowest Low Strength Candles detected with CCI > 100 and CCI< -100 and indicated bye CCI_BO_B and CCI_BO_S

Trend Volume Accumulation R1 by JustUncleLThis simple indicator shows the Accumulated Volume within the current uptrend or downtrend. The uptrend/downtrend is detected by a change in direction of the candles which works very well with Heikin Ashi and Renko charts. Alternatively you can use a Moving average direction to indicate trend direction, which should work on any candle type.
You can select between 11 different types of moving average:
SMA = Simple Moving Average.
EMA = Exponential Moving Average.
WMA = Weighted Moving Average
VWMA = Volume Weighted Moving Average
SMMA = Smoothed Simple Moving Average.
DEMA = Double Exponential Moving Average
TEMA = Triple Exponential Moving Average.
HullMA = Hull Moving Average
SSMA = Ehlers Super Smoother Moving average
ZEMA = Near Zero Lag Exponential Moving Average.
TMA = Triangular (smoothed) Simple Moving Average.
Here is a sample chart using EMA length 6 for trend Direction:

Price Action Channel Master by JustUncleLThis indicator combines a number of PAC types into one indicator and will replace some of my previously PAC scripts (some were not published).
It draws a Moving Average (MA) channel based on various boundary criteria. Even though the MA choices are not limited to SMA and EMA, these would be the your first choices with most PAC requirements, feel free to experiment though.
Optional Bar colouring around that channel.
Options Available:
(1) Select between 11 different types of moving averages for the base (centre) MA line choices are :
SMA = Simple Moving Average (default)
EMA = Exponential Moving Average.
WMA = Weighted Moving Average
VWMA = Volume Weighted Moving Average
SMMA = Smoothed Simple Moving Average.
DEMA = Double Exponential Moving Average
TEMA = Triple Exponential Moving Average.
HullMA = Hull Moving Average
SSMA = Ehlers Super Smoother Moving average
ZEMA = Near Zero Lag Exponential Moving Average.
TMA = Triangular (smoothed) Simple Moving Average.
(2) Select Channel Boundary Criteria:
HILO = Channel boundaries based on High and Low MAs (default).
ATR = Channel boundaries are Multiplier * ATR distance from base line
PIP = Channel boundaries are Multiplier * PIPs distance from base line
STDEV = Channel boundaries are Multiplier * StdDev(price) distance from base line (this is the same as Bollinger bands if SMA is the base MA)
KC = Channel boundaries are Multiplier * StdDev(True Range) distance from base line (this is the same as Keltner channel if SMA is the base MA)
(3) Option to display coloured Candles around the Ribbon, the colouring uses the Default candle 3-tone colour scheme:
Lime = candle closed above Ribbon.
Red = candle closed below Ribbon.
Gray = Candle Closed inside Ribbon.
The Grab candles 6-tone colour scheme:
Lime = Bull candle closed above Ribbon.
Green = Bear candle closed above Ribbon.
Red = Bull candle closed below Ribbon.
DarkRed = Bear candle closed below Ribbon.
Aqua = Bull candle closed inside Ribbon.
Blue = Bear candle closed inside Ribbon.

Daily Deviations (Self Input Version)
Plots the standard deviation resistance/support levels.
Input the previous settlement price and the implied volatility.
credit to u/UberBotMan and u/Living_Granger for the idea and formulas
(preview example is using settlement of 2420 and IV of 11)

Coloured MA R3-16 by JustUncleLThis indicator is an implementation of the coloured trend Moving Average, that includes some unique features. The Moving Average plot is coloured relative to it's direction and optionally display coloured Trend Bars using the standard 2-tone colours, or Grab candle style 4-tone colours.
Options:
1) Anchor Time Frame to a Highter Time frame, eg. set anchor to 1440 and length set to 8, the script will re-size the MA length needed to display on the current TF, say 60.
2) You can select between 11 different types of moving averages, each MA line can be a different type:
SMA = Simple Moving Average.
EMA = Exponential Moving Average.
WMA = Weighted Moving Average
VWMA = Volume Weighted Moving Average
SMMA = Smoothed Simple Moving Average.
DEMA = Double Exponential Moving Average
TEMA = Triple Exponential Moving Average.
HullMA = Hull Moving Average
SSMA = Ehlers Super Smoother Moving average
ZEMA = Near Zero Lag Exponential Moving Average.
TMA = Triangular (smoothed) Simple Moving Average.
3) Option to display coloured Candles around the Ribbon, the colouring -
Standard candle colours:
Lime = candle closed above Ribbon.
Red = candle closed below Ribbon.
The Grab candles scheme:
Lime = Bull candle closed above Ribbon.
Green = Bear candle closed above Ribbon.
Red = Bull candle closed below Ribbon.
DarkRed = Bear candle closed below Ribbon.

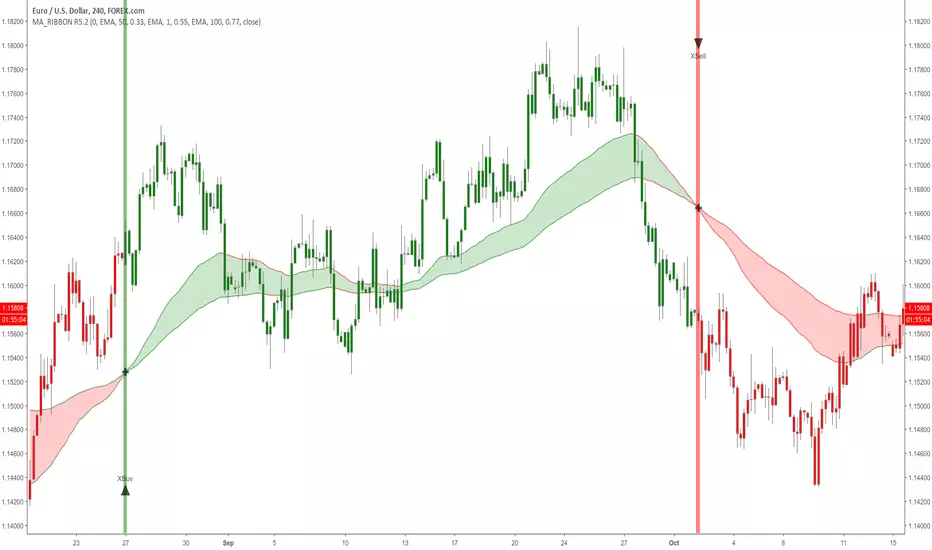
MA Ribbon R2 by JustUncleLThis indicator plots and colour codes a ribbon between two moving averages. The colour of the ribbon changes with trend direction: when price in uptrend ribbon colour is green; when price in downtrend ribbon colour is red.
Options Available:
1) You can select between 11 different types of moving averages, each MA line can be a different type.
2) Option to display coloured Candles around the Ribbon, the colouring uses the Grab candles colour scheme:
Lime = Bull candle closed above Ribbon.
Green = Bear candle closed above Ribbon.
Red = Bull candle closed below Ribbon.
DarkRed = Bear candle closed below Ribbon.
Aqua = Bull candle closed inside Ribbon.
Blue = Bear candle closed inside Ribbon.
3) Option to base the candles on a higher time frame (HFT), this performed by increasing the MA length to create equivalent lengths from the HFT. So no re-painting.
NOTE: The script will time out if the MA lengths get too long after resizing.