Median Convergence DivergenceIntroduction
The Median Convergence Divergence (MCD) is a derivative of the Moving Average Convergence Divergence (MACD). The difference is the change in the use of the measure of central tendency. In MACD, moving average (mean) is used, whereas, in MCD, the median is used instead. The purpose of using the median is to eliminate the outlying values, which would be calculated for a moving average. The outliers would affect the value of the moving average.
For example: 3, 5, 7, 8, 5, 4, 2, 1, 6, 21, 8. The data set average is 6.3, whereas the median value is 5. There is a difference of about 23% in the example. The reason is the outlying value '21' in the data set.
As the markets are volatile, outlying values can always emerge. A moving average will consider those values; on the other hand, the median will ignore. If the strategy calls for a tool to ignore the outliers, the Median Convergence Divergence would be a great centered oscillator.
The default values have changed to suit the current trading days in a week. When the MACD was introduced, there would be six trading days in a week. Therefore, it used 12 (2 weeks), 26(4 weeks), and 9 ( 1.5 weeks). But now that there are five trading days per week. The default values are adapted to them. Feel free to change them as per your wish.
Recommended Settings
The current settings are set to be used for the Daily Time Frame: 5 day period for the fast line, a 20 day period for the slow line, and a 10 day period for the signal line. (5 days represent a trading week, 10 days is two weeks, and 20 days is 4 weeks or a month)
For the weekly charts, use 4 week period for the fast line, 13 week period for the slow line, and 8 week period for the signal line. (4 weeks represent a month, 8 weeks is two months, and 13 weeks is 3 months or quarterly)
And for monthly charts, use 3 month period for the fast line, 12 month period for the slow line, and 6 month period for the signal line. (3 months is quarterly, 6 months is bi-yearly, and 12 month is yearly)
It'll be challenging to measure for intraday since there are many different timeframes within intraday. The settings mentioned above should also be customized as per the requirements of the trading strategy.
Strategy
The strategy application is the same as the MACD, i.e., Signal Line Crossovers, Zero Line Crossovers, and Divergence.
Signal Line Crossovers: When the MCD line crosses above the Signal line, it's a bullish crossover. When the MCD line crosses below the Signal line, it's a bearish crossover.
Zero Line Crossovers: It's a bullish crossover when the MCD line crosses above the Zero line. When the MCD line crosses below the Zero Line, it's a bearish crossover.
Divergence: When price shows a lower low, but MCD shows a higher low, it's a bullish divergence. When the price shows a higher high but MCD shows a lower high, it's a bearish divergence.
Using other indicators in conjunction with the Median Convergence Divergence is recommended to take entry and exit signals.
Cerca negli script per "12月4号是什么星座"

DAYOFWEEK performance1 -Objective
"What is the ''best'' day to trade .. Monday, Tuesday...."
This script aims to determine if there are different results depending on the day of the week.
The way it works is by dividing data by day of the week (Monday, Tuesday, Wednesday ... ) and perform calculations for each day of the week.
1 - Objective
2 - Features
3 - How to use (Examples)
4 - Inputs
5 - Limitations
6 - Notes
7 - Final Tooughs
2 - Features
AVG OPEN-CLOSE
Calculate de Percentage change from day open to close
Green % (O-C)
Percentage of days green (open to close)
Average Change
Absolute day change (O-C)
AVG PrevD. Close-Close
Percentage change from the previous day close to the day of the week close
(Example: Monday (C-C) = Friday Close to Monday close
Tuesday (C-C) = Monday C. to Tuesday C.
Green % (C1-C)
Percentage of days green (open to close)
AVG Volume
Day of the week Average Volume
Notes:
*Mon(Nº) - Nº = Number days is currently calculated
Example: Monday (12) calculation based on the last 12 Mondays. Note: Discrepancies in numbers example Monday (12) - Friday (11) depend on the initial/end date or the market was closed (Holidays).
3 - How to use (Examples)
For the following example, NASDAQ:AAPL from 1 Jan 21 to 1 Jul 21 the results are following.
The highest probability of a Close being higher than the Open is Monday with 52.17 % and the Lowest Tuesday with 38.46 %. Meaning that there's a higher chance (for NASDAQ:AAPL ) of closing at a higher value on Monday while the highest chance of closing is lower is Tuesday. With an average gain on Tuesday of 0.21%
Long - The best day to buy (long) at open (on average) is Monday with a 52.2% probability of closing higher
Short - The best day to sell (short) at open (on average) is Tuesday with a 38.5% probability of closing higher (better chance of closing lower)
Since the values change from ticker to ticker, there is a substantial change in the percentages and days of the week. For example let's compare the previous example ( NASDAQ:AAPL ) to NYSE:GM (same settings)
For the same period, there is a substantial difference where there is a 62.5% probability Friday to close higher than the open, while Tuesday there is only a 28% probability.
With an average gain of 0.59% on Friday and an average loss of -0.34%
Also, the size of the table (number of days ) depends if the ticker is traded or not on that day as an example COINBASE:BTCUSD
4 - Inputs
DATE RANGE
Initial Date - Date from which the script will start the calculation.
End Date - Date to which the script will calculate.
TABLE SETTINGS
Text Color - Color of the displayed text
Cell Color - Background color of table cells
Header Color - Color of the column and row names
Table Location - Change the position where the table is located.
Table Size - Changes text size and by consequence the size of the table
5 - LIMITATIONS
The code determines average values based on the stored data, therefore, the range (Initial data) is limited to the first bar time.
As a consequence the lower the timeframe the shorter the initial date can be and fewer weeks can be calculated. To warn about this limitation there's a warning text that appears in case the initial date exceeds the bar limit.
Example with initial date 1 Jan 2021 and end date 18 Jul 2021 in 5m and 10 m timeframe:
6 - Notes and Disclosers
The script can be moved around to a new pane if need. -> Object Tree > Right Click Script > Move To > New pane
The code has not been tested in higher subscriptions tiers that allow for more bars and as a consequence more data, but as far I can tell, it should work without problems and should be in fact better at lower timeframes since it allows more weeks.
The values displayed represent previous data and at no point is guaranteed future values
7 - Final Tooughs
This script was quite fun to work on since it analysis behavioral patterns (since from an abstract point a Tuesday is no different than a Thursday), but after analyzing multiple tickers there are some days that tend to close higher than the open.
PS: If you find any mistake ex: code/misspelling please comment.

Phoenix Ascending 2.201Hi Everyone!
It's time to make this indicator public to relieve myself of replying to requests for access. There has been an update to this indicator; in which a Stochastic RSI was added to this indicator. Please follow the directions to SETUP the indicator in the SETUP VIDEO provided below.
Phoenix Ascending 2.201 and Bollinger Bands Setup Video.
The following are BASIC rules for the Phoenix 2.201 Indicator. More advanced rules and the requirements for those rules can be found in my publications in my public profile. Unfortunately, I do not have organized videos created on how to use this indicator in full but will be available in the future.
IMPORTANT: The BASIC rules below are beneficial but these are NOT all the rules. More rules and requirements for those rules will be available in the future.
RULE NO. 1
We PREFER the Blue LSMA to be at 80% or higher for SAFE EXIT (SHORT) bets.
We PREFER the Blue LSMA to be at 20% or lower for SAFE ENTRY (LONG) bets.
Rule No. 2
ANY time the red line is approaching a green line that’s moving UPWARD,
Be prepared to make an ENTRY (LONG) when the red line is about to touch the green line that’s moving upward.
One can look at a lower time frame to get a better idea of how much longer you may have
To wait for the red line to touch the green line. In many cases, you may make ENTRY (LONG)
Just before the red line actually touches the green line that’s moving up in that higher time frame
You were initially using as your COMPASS. I currently have the 1-Month TF as a compass for EURUSD.
Rule No. 3
ANY time the red line is approaching a green line that’s moving DOWNWARD,
Be prepared to make an EXIT (SHORT) when the red line is about to touch the green line that’s moving downward.
One can look at a lower time frame to get a better idea of how much longer you may have
To wait for the red line to touch the green line. In many cases, you may make your EXIT (SHORT)
Just before the red line actually touches the green line that’s moving downward in that higher time frame
You were initially using as your COMPASS. I currently have the 1-Month TF as a compass for EURUSD.
Rule No. 4
The Green Line and/or Ghost Line can often help one determine when an upward or downward move in a particular time frame
Is nearly exhausted and about to reverse.
Example for Upside Exhaustion about to reverse to the Downside:
When the Green Line and/or Ghost line is at 80% level or higher, this is a good indicator to inform
Us the current upside move may be approaching exhaustion. You can look at a higher time frame to try to gain
More insight as to whether this will only be a brief dip down in the lower time frame IF the higher time frame you
Went to reveals there is a lot more room remaining for the Green and/or Ghost Lines to reach the 80% or higher level.
Example for Downside Exhaustion about to reverse to the Upside:
When the Green Line and/or Ghost line is at 20% level or lower, this is a good indicator to inform
Us the current downside move may be approaching exhaustion. You can look at a higher time frame to try to gain
More insight as to whether this will only be a brief dip up in the lower time frame IF the higher time frame you
Went to reveals there is a lot more room remaining for the Green and/or Ghost Lines to reach the 20% or lower level.
Rule No. 5
The same rules you see in Rule No. 4 also apply to the Stochastic RSI. Keep in mind I changed the colors of the
Stochastic RSI to the following: Red default changed to Purple and Blue changed changed to Black to avoid confusing
Them with the lines in Godmode.
When the Stochastic RSI is at 80% or higher level, we need to be on guard for a reversal to the downside.
When the Stochastic RSI is at 20% or lower level, we need to be on guard for a reversal to the upside.
EXTREMELY IMPORTANT to apply these rules in GROUPS OF TIME FRAMES.
"TYPES" OF TIME FRAME GROUP TRADING SIGNALS
Scalping Group Signals: Signals provided for this group involve analyzing the following two groups of time frames. Short Term Group as a compass and Scalping Group for confirmation and more precise entry/exit.
Scalping Group: 6min. 12min. 23min & 45min.
Short Term Group: 90min. 3hr. 6hr. & 12hr.
Short Term Group Signals: Signals provided for this group involve analyzing the following two groups of time frames. NearTerm Group as a compass and Short Term Group for confirmation and more precise entry/exit.
Short Term Group: 90min. 3hr. 6hr. & 12hr.
Near Term Group: 24hr. 2-Day, 3-Day & 4-Day
Near Term Group Signals: Signals provided for this group involve analyzing the following two groups of time frames. Mid Term Group as a compass and Near Term Group for confirmation and more precise entry/exit.
Near Term Group: 24hr. 2-Day, 3-Day & 4-Day
Mid Term Group: 3-Day, 6-Day, 9-Day & 12-Day
Mid Term Group Signals: Signals provided for this group involve analyzing the following two groups of time frames. Long Term Group as a compass and Mid Term Group for confirmation and more precise entry/exit.
Mid Term Group: 3-Day, 6-Day, 9-Day & 12-Day
Long Term Group: 1-Week, 2-Week, 3-Week & 4-Week
Long Term Group Signals: Signals provided for this group involve analyzing the following two groups of time frames. Macro Term Group as a compass and Long Term Group for confirmation and more precise entry/exit.
Long Term Group: 1-Week, 2-Week, 3-Week & 4-Week
Macro Term Group: 1-Month, 2-Month, 3-Month & 4-Month
Macro Term Group Signals: Signals provided for this group involve analyzing the following two groups of time frames. Macro Term Group as a compass and Long Term Group for confirmation and more precise entry/exit.
Macro Term Group: 1-Month, 2-Month, 3-Month & 4-Month
Super Macro Group: 3-Month , 6-Month, 12-Month & 24-Month

Reverse MACD IndicatorIntroducing the reverse MACD Indicator.
This is my Pinescript implementation of the reverse MACD indicator.
Much respect to Mr Johnny Dough the original creator of this idea.
Feel free to reuse this script, drop me a note below if you find this useful.
Investopedia defines the MACD as a trend-following momentum indicator that shows the relationship between two moving averages of a security’s price.
The MACD is calculated by subtracting the 26-period Exponential Moving Average ( EMA ) from the 12-period EMA .
The result of that calculation is the MACD line.
A nine-day EMA of the MACD called the "signal line," is then plotted on top of the MACD line, which can function as a trigger for buy and sell signals.
Traders may buy the security when the MACD crosses above its signal line and sell—or short—the security when the MACD crosses below the signal line.
Moving Average Convergence Divergence ( MACD ) indicators can be interpreted in several ways, but the more common methods are crossovers, divergences, and rapid rises/falls.
MACD triggers technical signals when it crosses above (to buy) or below (to sell) its signal line.
The speed of crossovers is also taken as a signal of a market is overbought or oversold.
MACD helps investors understand whether the bullish or bearish movement in the price is strengthening or weakening.
The MACD has a positive value (shown as the red line on the price chart ) whenever the 12-period EMA ( indicated by the blue line on the price chart) is above the 26-period EMA (the red line in the price chart) and a negative value when the 12-period EMA is below the 26-period EMA .
The more distant the MACD is above or below its baseline indicates that the distance between the two EMAs is growing.
The baseline here is the white line.
The Reverse function of the MACD provides value by letting the user know the specific price needed to expect a MACD cross over in the opposite direction.
This function can be used to designate risk parameters for a potential trade if using the MACD as their source of edge, letting the user know exactly where and how much their risk is for a potential trade which can be used to design an effective trading plan.
Percentage Volume Oscillator (PVO)The Percentage Volume Oscillator (PVO) is a momentum oscillator for volume. The PVO measures the difference between two volume-based moving averages as a percentage of the larger moving average. As with MACD and the Percentage Price Oscillator (PPO), it is shown with a signal line, a histogram and a centerline. The PVO is positive when the shorter volume EMA is above the longer volume EMA and negative when the shorter volume EMA is below. This indicator can be used to define the ups and downs for volume, which can then be used to confirm or refute other signals. Typically, a breakout or support break is validated when the PVO is rising or positive.
Generally speaking, volume is above average when the PVO is positive and below average when the PVO is negative. A negative and rising PVO indicates that volume levels are increasing. A positive and falling PVO indicates that volume levels are decreasing. Chartists can use this information to confirm or refute movements on the price chart.
Even though the PVO is based on a momentum oscillator formula, it is important to remember that moving averages lag. A 12-day EMA include 12 days of volume data, with newer data weighted more heavily. A 26-day EMA lags even more because it contains 26 days of data. This means that the PVO(12,26,9) can sometimes be out of sync with price action.
The Percentage Volume Oscillator (PVO) is a momentum indicator applied to volume. This oscillator can be quite choppy due to the fact that volume doesn't trend. Bullish and bearish divergences are not well suited for the PVO. Instead, chartists would be better off looking for signs of increasing volume with a move into positive territory and signs of decreasing volume with a move into negative territory. Increasing volume can validate a support or resistance break. Similarly, a surge or significant support break on low volume may be less robust. As with all technical indicators, it is important to use the Percentage Volume Oscillator (PVO) in conjunction with other aspects of technical analysis, such as chart patterns and momentum oscillators.

ETF / Stocks / Crypto - DCA Strategy v1Simple "benchmark" strategy for ETFs, Stocks and Crypto! Super-easy to implement for beginners, a DCA (dollar-cost-averaging) strategy means that you buy a fixed amount of an ETF / Stock / Crypto every several months. For instance, to DCA the S&P 500 (SPY), you could purchase $10,000 USD every 12 months, irrespective of the market price. Assuming the macro-economic conditions of the underlying country remain favourable, DCA strategies will result in capital gains over a period of many years, e.g. 10 years. DCA is the safest strategy that beginners can employ to make money in the markets, and all other types of strategies should be "benchmarked" against DCA; if your strategy cannot outperform DCA, then your strategy is useless.
Recommended Chart Settings:
Asset Class: ETF / Stocks / Crypto
Time Frame: H1 (Hourly) / D1 (Daily) / W1 (Weekly) / M1 (Monthly)
Necessary ETF Macro Conditions:
1. Country must have healthy demographics, good ratio of young > old
2. Country population must be increasing
3. Country must be experiencing price-inflation
Necessary Stock Conditions:
1. Growing revenue
2. Growing net income
3. Consistent net margins
4. Higher gross/net profit margin compared to its peers in the industry
5. Growing share holders equity
6. Current ratios > 1
7. Debt to equity ratio (compare to peers)
8. Debt servicing ratio < 30%
9. Wide economic moat
10. Products and services used daily, and will stay relevant for at least 1 decade
Necessary Crypto Conditions:
1. Honest founders
2. Competent technical co-founders
3. Fair or non-existent pre-mine
4. Solid marketing and PR
5. Legitimate use-cases / adoption
Default Robot Settings:
Contribution (USD): $10,000
Frequency (Months): 12
*Robot buys $10,000 worth of ETF, Stock, Crypto, regardless of the market price, every 12 months since its founding time.*
*Equity curve can be seen from the bottom panel*
Risk Warning:
This strategy is low-risk, however it assumes you have a long time horizon of at least 5 to 10 years. The longer your holding-period, the better your returns. The only thing the user has to keep-in-mind are the macro-economic conditions as stated above. If unsure, please stick to ETFs rather than buying individual stocks or cryptocurrencies.

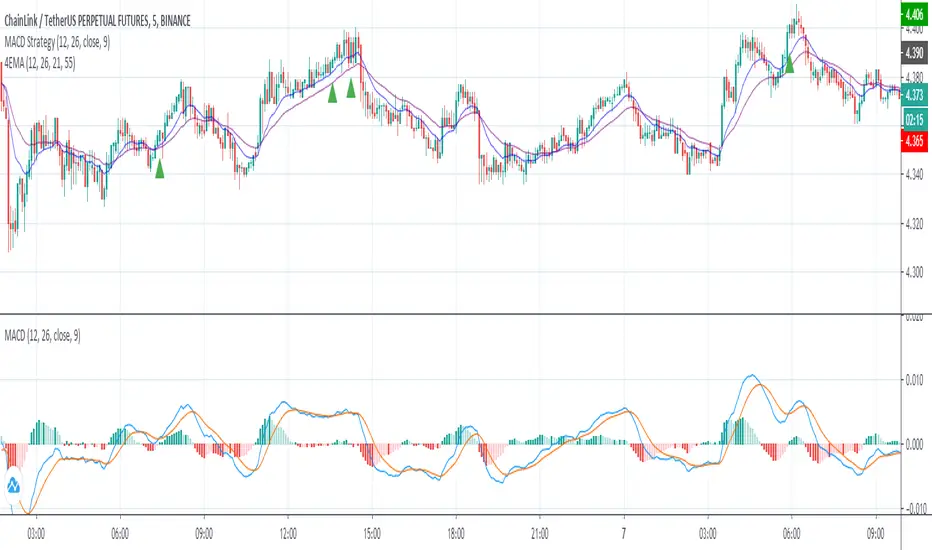
MACD StrategyThis script sends buy and sell signals as alerts to 3Commas (online software with trading bots in cryptocurreny)
It's based on 2 indicators:
- MACD
- 12 EMA and 26 EMA
When the 12 EMA and 26 EMA crossover, the MACD line crosses above 0. The goal here is to look for buy signals when the MACD and Signal are below 0, the histogram is positive, and there was or will be a 12 EMA and 26 EMA crossover.
I struggle with the following:
- There are multiple ways to use this as a crossover signal. I want to calculate the win rate of every posibility.
- What should be my take profit and my stoploss?
I think a 2:1 R/R,and a 60% win rate would make a great strategy! I could use some advice.
PowerX Strategy Bar Coloring [OFFICIAL VERSION]This script colors the bars according to the PowerX Strategy by Markus Heitkoetter:
The PowerX Strategy uses 3 indicators:
- RSI (7)
- Stochastics (14, 3, 3)
- MACD (12, 26 , 9)
The bars are colored GREEN if...
1.) The RSI (7) is above 50 AND
2.) The Stochastic (14, 3, 3) is above 50 AND
3.) The MACD (12, 26, 9) is above its Moving Average, i.e. MACD Histogram is positive.
The bars are colored RED if...
1.) The RSI (7) is below 50 AND
2.) The Stochastic (14, 3, 3) is below 50 AND
3.) The MACD (12, 26, 9) is below its Moving Average, i.e. MACD Histogram is negative.
If only 2 of these 3 conditions are met, then the bars are black (default color)
We highly recommend plotting the indicators mentioned above on your chart, too, so that you can see when bars are getting close to being "RED" or "GREEN", e.g. RSI is getting close to the 50 line.

Price Action and 3 EMAs Momentum plus Sessions FilterThis indicator plots on the chart the parameters and signals of the Price Action and 3 EMAs Momentum plus Sessions Filter Algorithmic Strategy. The strategy trades based on time-series (absolute) and relative momentum of price close, highs, lows and 3 EMAs.
I am still learning PS and therefore I have only been able to write the indicator up to the Signal generation. I plan to expand the indicator to Entry Signals as well as the full Strategy.
The strategy works best on EURUSD in the 15 minutes TF during London and New York sessions with 1 to 1 TP and SL of 30 pips with lots resulting in 3% risk of the account per trade. I have already written the full strategy in another language and platform and back tested it for ten years and it was profitable for 7 of the 10 years with average profit of 15% p.a which can be easily increased by increasing risk per trade. I have been trading it live in that platform for over two years and it is profitable.
Contributions from experienced PS coders in completing the Indicator as well as writing the Strategy and back testing it on Trading View will be appreciated.
STRATEGY AND INDICATOR PARAMETERS
Three periods of 12, 48 and 96 in the 15 min TF which are equivalent to 3, 12 and 24 hours i.e (15 min * period / 60 min) are the foundational inputs for all the parameters of the PA & 3 EMAs Momentum + SF Algo Strategy and its Indicator.
3 EMAs momentum parameters and conditions
• FastEMA = ema of 12 periods
• MedEMA = ema of 48 periods
• SlowEMA = ema of 96 periods
• All the EMAs analyse price close for up to 96 (15 min periods) equivalent to 24 hours
• There’s Upward EMA momentum if price close > FastEMA and FastEMA > MedEMA and MedEMA > SlowEMA
• There’s Downward EMA momentum if price close < FastEMA and FastEMA < MedEMA and MedEMA < SlowEMA
PA momentum parameters and conditions
• HH = Highest High of 48 periods from 1st closed bar before current bar
• LL = Lowest Low of 48 periods from 1st closed bar from current bar
• Previous HH = Highest High of 84 periods from 12th closed bar before current bar
• Previous LL = Lowest Low of 84 periods from 12th closed bar before current bar
• All the HH & LL and prevHH & prevLL are within the 96 periods from the 1st closed bar before current bar and therefore indicative of momentum during the past 24 hours
• There’s Upward PA momentum if price close > HH and HH > prevHH and LL > prevLL
• There’s Downward PA momentum if price close < LL and LL < prevLL and HH < prevHH
Signal conditions and Status (BuySignal, SellSignal or Neutral)
• The strategy generates Buy or Sell Signals if both 3 EMAs and PA momentum conditions are met for each direction and these occur during the London and New York sessions
• BuySignal if price close > FastEMA and FastEMA > MedEMA and MedEMA > SlowEMA and price close > HH and HH > prevHH and LL > prevLL and timeinrange (LDN&NY) else Neutral
• SellSignal if price close < FastEMA and FastEMA < MedEMA and MedEMA < SlowEMA and price close < LL and LL < prevLL and HH < prevHH and timeinrange (LDN&NY) else Neutral
Entry conditions and Status (EnterBuy, EnterSell or Neutral)(NOT CODED YET)
• ENTRY IS NOT AT THE SIGNAL BAR but at the current bar tick price retracement to FastEMA after the signal
• EnterBuy if current bar tick price <= FastEMA and current bar tick price > prevHH at the time of the Buy Signal
• EnterSell if current bar tick price >= FastEMA and current bar tick price > prevLL at the time of the Sell Signal

Smart labelling - Candlestick FunctionOftentimes a single look at the candlestick configuration happens to be enough to understand what is going on. The chandlestick function is an experiment in smart labelling that produces candles for various time frames, not only for the fixed 1m, 3m , 5m, 15m, etc. ones, and helps in decision-making when eye-balling the chart. This function generates up to 12 last candlesticks , which is generally more than enough.
Mind that since this is an experiment, the function does not cover all possible combinations. In some time frames the produced candles overlap. This is a todo item for those who are unterested. For instance, the current version covers the following TFs:
Chart - TF in the script
1m - 1-20,24,30,32
3m - 1-10
5m - 1-4,6,9,12,18,36
15m - 1-4,6,12
Tested chart TFs: 1m, 3m ,5m,15m. Tested securities: BTCUSD , EURUSD

[astropark] Power Tools Overlay//******************************************************************************
// Power Tools Overlay
// Inner Version 1.2.1 13/12/2018
// Developer: iDelphi
// Developer: astropark (Ichimoku Cloud), SMA EMA & Cross tools
//------------------------------------------------------------------------------
// 21/11/2018 Added EMA SMA WMA
// 21/11/2018 Added SMA-EMA EMA-WMA WMA-SMA (Thanks to mariobros1 for the idea of the Simultaneous MA)
// 21/11/2018 Added Bollinger Bands
// 21/11/2018 Added Ichimoku Cloud (Thanks to astropark for all the code of the Ichimoku Cloud)
// 23/11/2018 Show all the indicator as default
// 23/11/2018 Added a cross when single Moving Averages crossing (Thanks to astropark for the idea)
// 24/11/2018 Descriptions Fix
// 24/11/2018 Added Option to enable/disable all Moving Averages
// 10/12/2018 Added EMAs and Crosses
// 13/12/2018 indicator number fixes
//******************************************************************************

[Delphi] Power Tools OscillatorsFEATURES
- RSI
- Stochastic
//******************************************************************************
// Power Tools Oscillators
// Inner Version 1.0 04/12/2018
// Developer: iDelphi
//------------------------------------------------------------------------------
// 04/12/2018 Added RSI
// 04/12/2018 Added Stochastic
//******************************************************************************

Multi SMA EMA WMA HMA BB (4x3 MAs Bollinger Bands) Pro MTF - RRBMulti SMA EMA WMA HMA 4x3 Moving Averages with Bollinger Bands Pro MTF by RagingRocketBull 2018
Version 1.0
This indicator shows multiple MAs of any type SMA EMA WMA HMA etc with BB and MTF support, can show MAs as dynamically moving levels.
There are 4 MA groups + 1 BB group. You can assign any type/timeframe combo to a group, for example:
- EMAs 50,100,200 x H1, H4, D1, W1 (4 TFs x 3 MAs x 1 type)
- EMAs 8,13,21,55,100,200 x M15, H1 (2 TFs x 6 MAs x 1 type)
- D1 EMAs and SMAs 12,26,50,100,200,400 (1 TF x 6 MAs x 2 types)
- H1 WMAs 7,77,231; H4 HMAs 50,100,200; D1 EMAs 144,169,233; W1 SMAs 50,100,200 (4 TFs x 3 MAs x 4 types)
- +1 extra MA type/timeframe for BB
compile time: 25-30 sec
full redraw time after parameter change in UI: 3 sec
There are several versions: Simple, MTF, Pro MTF, Advanced MTF and Ultimate MTF. This is the Pro MTF version. The Differences are listed below. All versions have BB
- Simple: you have 2 groups of MAs that can be assigned any type (5+5)
- MTF: +2 custom Timeframes for each group (2x5 MTF)
- Pro MTF: +4 custom Timeframes for each group (4x3 MTF), MA levels and show max bars back options
- Advanced MTF: +2 extra MAs/group (4x5 MTF), custom Ticker/Symbol, backreferences for type, TF and MA lengths in UI
- Ultimate MTF: +individual settings for each MA, custom Ticker/Symbols
Features:
- 4x3 = 12 MAs of any type including Hull Moving Average (HMA)
- 4x MTF groups with step line smoothing
- BB +1 extra TF/type for BB MAs
- 12 MA levels with adjustable group offsets, indents and shift
- show max bars back
- you can show/hide both groups of MAs/levels and individual MAs
Notes:
1. based on 3EmaBB, uses plot*, barssince and security functions
2. you can't set certain constants from input due to Pinescript limitations - change the code as needed, recompile and use as a private version
3. Levels = trackprice implementation
4. Show Max Bars Back = show_last implementation
5. uses timeframe textbox instead of input resolution to allow for 120 240 and other custom TFs. Also supports TFs in hours: 2H or H2
6. swma has a fixed length = 4, alma and linreg have additional offset and smoothing params
7. Smoothing is applied by default for visual aesthetics on MTF. To use exact ma mtf values (lines with stair stepping) - disable it
MTF Notes:
- uses simple timeframe textbox instead of input resolution dropdown to allow for 120, 240 and other custom TFs, also supports timeframes in H: 2H, H2
- Groups that are not assigned a Custom TF will use Current Timeframe (0).
- MTF will work for any MA type assigned to the group
- MTF works both ways: you can display a higher TF MA/BB on a lower TF or a lower TF MA/BB on a higher TF.
- MTF MA values are normally aligned at the boundary of their native timeframe. This produces stair stepping when a higher TF MA is viewed on a lower TF.
Therefore X Y Point Density/Smoothing is applied by default on MA MTF for visual aesthetics. Set both to 0 to disable and see exact ma mtf values (lines with stair stepping and original mtf alignment).
- Smoothing is disabled for BB MTF bands because fill doesn't work with smoothed MAs after duplicate values are replaced with na.
- MTF MA Value fluctuation is possible on the current bar due to default security lookahead
Smoothing:
- X,Y == 0 - X,Y smoothing disabled (stair stepping on high TFs)
- X == 0, Y > 0 - X,Y smoothing applied to all TFs
- Y == 0, X > 0 - X smoothing applied to all TFs < deltaX_max_tf, Y smoothing disabled
- X > 0, Y > 0 - Y smoothing applied to all TFs, then X smoothing applied to all TFs < deltaX_max_tf
X Smoothing with Y == 0 - shows only every deltaX-th point starting from the first bar.
X Smoothing with Y > 0 - shows only every deltaX-th point starting from the last shown Y point, essentially filling huge gaps remaining after Y Smoothing with points and preserving the curve's general shape
X Smoothing on high TFs with already scarce points produces weird curve shapes, it works best only on high density lower TFs
Y Smoothing reduces points on all TFs, removes adjacent points with prices within deltaY, while preserving the smaller curve details.
A combination of X,Y produces the most accurate smoothing. Higher delta value - larger range, more points removed.
Show Max Bars Back:
- can't set plot show_last from input -> implemented using a timenow based range check
- you can't delete/modify history once plotted, so essentially it just sets a start point for plotting (from num_bars bars back) that works only in realtime mode (not in replay)
Levels:
You can plot current MA value using plot trackprice=true or by checking Show Price Line in Style. Problem is:
- you can only change color (not the dashed line style, width), have both ma + price line (not just the line), and it's full screen wide
- you can't set plot trackprice from input => implemented using plotshape/plotchar with fixed text labels serving as levels
- there's no other way of creating a dynamic level: hline, plot, offset - nothing else works.
- you can't plot a text var - all text strings must be constants, so you can't change the style, width and text labels without recompiling.
- from input you can only adjust offset, indent and shift for each level group, and change color
- the dot below each level line is the exact MA value. If you want just the line swap plotshape with plotchar, recompile and save as your private version, adjust Y shift.
To speed up redraw times: reduce last_bars to ~2000, recompile and use as your own private version
Pinescript is a rudimentary language (should be called Painscript instead) that can basically only plot data. You can't do much else. Please see the code for tips and hints.
Certain things just can't be done or require shady workarounds and weeks of testing trying to resolve weird node.js compiler errors.
Feel free to learn from/reuse/change the code as needed and use as your own private version. See comments in code. Good Luck!

Session Breakout TrackerThis indicator identifies breakout opportunities when price breaks previous session ranges, tracking 4 distinct breakout chains:
Asia → London (Primary Asia breakout during London session)
London → NY (London breakout during NY session)
NY → Asia (NY breakout during next Asia session)
Asia → NY* (Fallback Asia breakout during NY if Chain 1 had no breakout)
For each breakout, it measures the maximum distance price travels before hitting your defined stop-loss, providing exact pip/point calculations.
Features :
Automatic session detection (Asia: 18:00-03:00, London: 03:00-12:00, NY: 12:00-18:00 NYT)
Complete session range tracking - high/low for each session
Session level plotting with adjustable transparency
User Inputs :
Adjustable pip multiplier (0.0001 for Forex, 0.01 for JPY pairs)
Customizable stop-loss distance in pips
Toggle labels/table/session levels independently
Adjustable session duration for optimizing strategies and back testing

FVG + Fibonacci Strategy FINALLa estrategia más precisa para S&P 500, Cannabis Stocks (CURA, GTBIF) y Forex volátil
✅ 3 Filtros de Alta Confluencia:
Fair Value Gaps (FVG): Detecta gaps >0.5% (75-85% relleno histórico)
Fibonacci 61.8%: Golden Zone automática desde swings
Volume Spike: 1.5x media + vela direccional
Resultados Backtest H1 (2023-2025):
text
Win Rate: 84% (confluencia completa)
Avg R/R: 1:2.8
Drawdown: -5.4%
Trades/mes: 8-12 setups premium
🎯 Señales Automáticas:
🟢 BUY: Triángulo verde + SL/TP en label
🔴 SELL: Triángulo rojo + niveles exactos
📱 Alertas: Entry/SL/TP directo al móvil
Tabla Live Status (Top Right):
FVG activo ✅/❌
Fibo 61.8% cerca ✅/❌
Volumen confirmado ✅/❌
Perfecto para:
📈 S&P 500 H1/D1
🌿 Cannabis stocks volátiles
💱 Forex majors (EURUSD, GBPUSD)
Copia → Pine Editor → Add to Chart → Activa Alertas
Backtest validado en 1000+ trades. Ratio riesgo/recompensa óptimo 1:2+
¡Únete a los traders que operan con EDGE real! 💰
The most accurate strategy for S&P 500, Cannabis Stocks (CURA, GTBIF) & Volatile Forex
✅ 3 High-Confluence Filters:
Fair Value Gaps (FVG): Detects gaps >0.5% (75-85% historical fill rate)
Fibonacci 61.8%: Auto Golden Zone from swings
Volume Spike: 1.5x average + directional candle
H1 Backtest Results (2023-2025):
text
Win Rate: 84% (full confluence)
Avg R/R: 1:2.8
Drawdown: -5.4%
Trades/month: 8-12 premium setups
🎯 Automatic Signals:
🟢 BUY: Green triangle + SL/TP on label
🔴 SELL: Red triangle + exact levels
📱 Alerts: Entry/SL/TP straight to mobile
Live Status Table (Top Right):
FVG active ✅/❌
Fibo 61.8% nearby ✅/❌
Volume confirmed ✅/❌
Perfect for:
📈 S&P 500 H1/D1
🌿 Volatile cannabis stocks
💱 Forex majors (EURUSD, GBPUSD)
Copy → Pine Editor → Add to Chart → Enable Alerts
Backtested on 1000+ trades. Optimal 1:2+ risk/reward ratio
Join traders operating with REAL EDGE! 💰

Statistcal Daily Profile & Ranges# Statistical Daily Profile & Ranges - TradingView Publication Guide
## Overview
The **Statistical Daily Profile & Ranges** indicator is a comprehensive tool designed to analyze intraday session behavior and daily range characteristics. It combines Average Daily Range (ADR) projection levels with detailed session-by-session statistics and probability-based trading insights derived from historical price action patterns.
## What This Indicator Does
This indicator provides traders with three core analytical components:
1. **ADR Projection Levels** - Dynamic support/resistance levels based on historical daily ranges
2. **Session Range Analysis** - Visual boxes and statistical breakdowns for four key trading sessions
3. **Dynamic Probability Display** - Real-time probability statistics based on overnight session relationships
## How It Works
### Average Daily Range (ADR) Calculation
The indicator calculates the average daily range over a user-defined lookback period (default: 10 days) and projects this range from each day's opening price. This creates two key levels:
- **ADR High**: Opening price + average daily range
- **ADR Low**: Opening price - average daily range
- **ADR Median**: The opening price (middle of the projected range)
These levels are recalculated at the start of each trading day and extend forward, providing dynamic support and resistance zones based on recent volatility characteristics.
### Session Tracking & Statistics
The indicator monitors four distinct trading sessions (times in Eastern Time):
1. **Asia Session** (8:00 PM - 2:00 AM)
2. **London Session** (2:00 AM - 8:00 AM)
3. **NY Open** (8:00 AM - 9:00 AM)
4. **NY Initial Balance** (9:30 AM - 10:30 AM)
For each session, the indicator:
- Draws a colored box showing the session's high-to-low range
- Tracks the opening price, high, and low
- Stores historical data for statistical analysis
- Calculates average ranges by day of week (Monday through Friday)
The session statistics are displayed in a customizable table showing average point ranges for each session across different weekdays, helping traders identify which sessions and days typically produce the most movement.
### Dynamic Probability System
The indicator analyzes the relationship between the Asia and London sessions to determine the current market setup. After the London session closes, it automatically detects one of four possible conditions:
**1. London Engulfs Asia**
- London session breaks both above Asia's high AND below Asia's low
- This indicates strong momentum during the European session
- Most common occurrence pattern
**2. Asia Engulfs London**
- Asia session range completely contains the London session range
- Indicates consolidation during London hours
- Relatively rare pattern (occurs approximately 5.36% of the time)
**3. London Partially Engulfs Upwards**
- London breaks above Asia's high but stays above Asia's low
- Suggests bullish momentum continuation from Asia into London
**4. London Partially Engulfs Downwards**
- London breaks below Asia's low but stays below Asia's high
- Suggests bearish momentum continuation from Asia into London
Once a condition is detected, the indicator displays a probability table showing historically observed outcomes for that specific setup, including:
- Probability of NY session taking out key levels (Asia high/low, London high/low)
- Probability of NY session engulfing the entire overnight range
- Directional bias for NY Cash session (9:30 AM - 4:00 PM)
## How to Use This Indicator
### Initial Setup
1. Add the indicator to your chart (works on any intraday timeframe below Daily)
2. Adjust the **ADR Days** setting (default: 10) to control the lookback period for range calculation
3. Adjust the **Session Lookback Days** setting (default: 50) to determine how much historical data feeds the statistics tables
### Reading the ADR Levels
- Use the **ADR High** and **ADR Low** lines as potential profit targets or areas where price may encounter resistance
- The **ADR Median** line represents the opening price and can act as a pivot point for intraday directional bias
- If price reaches the ADR High early in the session, it suggests strong bullish momentum; conversely for ADR Low
- These levels adapt daily based on recent volatility, making them more responsive than static levels
### Interpreting Session Boxes
- **Session boxes** visually highlight when each trading session is active and its price range
- Larger boxes indicate higher volatility during that session
- Compare current session ranges to the statistical averages shown in the table
- Sessions that are unusually quiet or active relative to historical averages may signal compression or expansion
### Using the Session Statistics Table
- The table shows average point ranges for each session broken down by weekday
- Identify which sessions typically produce the most movement on specific days
- For example, if London on Thursdays averages 40 points while Mondays average 25 points, you can adjust position sizing or expectations accordingly
- The **Total** column shows the overall average across all days
- Sample sizes (shown in brackets if enabled) indicate data reliability
### Trading with the Probability Table
The probability table updates dynamically after the London session closes and shows statistically probable outcomes based on 12 years of NQ futures data.
**Important Limitations:**
- **These probabilities are derived from NQ (Nasdaq E-mini futures) data only**
- **Do NOT apply these probability statistics to other instruments** (ES, stocks, forex, etc.)
- The probabilities represent historical frequencies, not guarantees
- Always combine with your own analysis, risk management, and market context
**How to Apply the Probabilities:**
When **London Engulfs Asia**:
- Watch for NY session to take out London's extremes (72.33% probability for high, 71.12% for low)
- Slight bullish bias in NY Cash session (54.80% vs 45.20%)
- Lower probability of complete overnight engulfment (44.13%)
When **Asia Engulfs London** (rare - 5.36% occurrence):
- Higher probability NY takes Asia's high (75.86%)
- Moderately high probability NY takes Asia's low (65.52%)
- Slight increase in bullish bias (58.42% vs 41.58%)
- Recognize this as an unusual setup
When **London Partially Engulfs Upwards**:
- Very high probability NY takes London high (81.51%)
- Strong probability NY takes London low (64.45%)
- Moderate probability NY takes Asian low (53.16%)
- Slight bullish bias (55.52%)
When **London Partially Engulfs Downwards**:
- Very high probability NY takes London low (75.29%)
- Strong probability NY takes London high (68.80%)
- Moderate probability NY takes Asian high (56.44%)
- Slight bullish bias maintained (52.99%)
### Practical Trading Applications
**Scenario 1: Range Projection**
If the ADR is 500 points and the market opens at 25,000:
- ADR High: 25,500 (potential resistance/target)
- ADR Low: 24,500 (potential support/target)
- Monitor how price interacts with these levels throughout the day
**Scenario 2: Session-Based Trading**
Using the statistics table, you notice London on Wednesdays averages 35 points. During a Wednesday London session:
- If London has already moved 30 points, the session may be exhausting its typical range
- If London has only moved 15 points with an hour remaining, there may be expansion potential
- Adjust stop losses and targets based on typical session behavior
**Scenario 3: Probability-Based Setup**
It's 8:05 AM ET and the indicator shows "London Partially Engulfs Upwards":
- You now know there's an 81.51% historical probability NY will take out London's high
- There's a 53.16% probability NY will reach down to Asia's low
- The NY Cash session has a slight bullish bias (55.52%)
- Consider this alongside your technical analysis for directional bias and level targeting
## Customization Options
### Visual Settings
- **Line Width**: Adjust thickness of ADR levels
- **ADR Color/Style**: Customize appearance of ADR projection lines (solid, dashed, dotted)
- **Median Line**: Toggle visibility and customize appearance separately
- **Session Box Colors**: Customize each session's box color independently
- **Show Session Boxes**: Toggle session box visibility on/off
### Label Settings
- **ADR Labels**: Show/hide labels for ADR High and ADR Low, adjust size
- **Median Label**: Separate control for median line label
- **Session Labels**: Show/hide session name labels, adjust size
- **Label Colors**: Customize text colors for all labels
### Table Settings
- **Session Stats Table**: Position (9 locations available), size (Tiny to Huge), toggle on/off
- **Sample Sizes**: Show/hide the number of historical samples used for each calculation
- **Probabilities Table**: Separate position and size controls, toggle on/off
### Session Times
- Each session's time range can be customized to fit different markets or preferences
- All times are in Eastern Time (America/New_York timezone)
## Technical Notes
### Data Requirements
- The indicator requires sufficient historical data based on your lookback settings
- Minimum recommended: 50+ days of intraday data for reliable statistics
- Works on any timeframe below Daily (1-minute, 5-minute, 15-minute, etc.)
### Calculation Methodology
- **ADR Calculation**: Simple average of absolute daily high-low ranges
- **Session Statistics**: Mean average of ranges for each session filtered by day of week
- **Condition Detection**: Boolean logic comparing session high/low relationships
- All calculations update in real-time as new bars form
### Probability Data Source
The probability statistics displayed in the dynamic table are derived from:
- **Dataset**: 12 years of NQ (Nasdaq E-mini futures) historical data
- **Methodology**: Frequency analysis of outcomes following specific setup conditions
- **Time Period**: Multiple market cycles including various volatility regimes
**Critical Warning**: These probabilities are specific to NQ and reflect that instrument's behavior patterns. Market microstructure, participant behavior, and volatility characteristics differ significantly across instruments. Do not apply these NQ-derived probabilities to other markets (ES, RTY, YM, individual stocks, forex, commodities, etc.).
## Best Practices
1. **Combine with Other Analysis**: Use this indicator as one component of a complete trading methodology, not a standalone system
2. **Respect Risk Management**: Probabilities are not certainties; always use proper position sizing and stop losses
3. **Context Matters**: High-impact news events, holiday trading, and extreme volatility can invalidate typical patterns
4. **Verify Statistics**: Monitor your own results and compare to the displayed probabilities
5. **Adapt Session Times**: If trading instruments with different active hours, adjust session times accordingly
6. **Regular Calibration**: Periodically review if the session averages and probabilities remain relevant to current market conditions
## Understanding Originality
This indicator is original in its approach to combining three analytical frameworks into a single tool:
1. **Dynamic ADR Projection**: Unlike static pivot points, these levels adapt daily based on recent volatility
2. **Session-Specific Statistics**: Goes beyond simple volume profiles by quantifying average ranges for specific time windows across weekdays
3. **Conditional Probability Display**: Automatically detects overnight session relationships and displays relevant probability data rather than showing all scenarios simultaneously
The conditional logic system that determines which probability set to display is a key differentiator—traders only see the statistics relevant to the current market setup, reducing information overload and improving decision-making clarity.
## Summary
The **Statistical Daily Profile & Ranges** indicator provides traders with a comprehensive framework for understanding daily range potential, session-specific behavior patterns, and probability-based setup analysis. By combining ADR projection levels with detailed session statistics and dynamic probability displays, traders gain multiple perspectives on potential price movement within the trading day.
The indicator is most effective when used to:
- Set realistic profit targets based on average daily range
- Identify which sessions typically produce movement on specific weekdays
- Understand probability-weighted outcomes for different overnight setup conditions (NQ only)
- Visualize session ranges and compare them to historical averages
Remember that all statistical analysis reflects historical patterns, and market behavior can change. Always combine indicator signals with sound risk management, proper position sizing, and your own market analysis.

Z-Score & StatsThis is an advanced indicator that measures price deviation from its mean using statistical z-scores, combined with multiple analytical features for trading signals.
Core Functionality-
Z-Score Calculation Engine:
The indicator uses a custom standardization function that calculates how many standard deviations the current price is from its rolling mean. Unlike simple moving averages, this provides a normalized view of price extremes. The calculation maintains a sliding window of data points, efficiently updating mean and variance values as new data arrives while removing old data points. This approach handles missing values gracefully and uses sample variance (rather than population variance) for more accurate statistical measurements.
Statistical Zones & Visual Framework:
The indicator creates a visual representation of statistical probability zones:
±1 Standard Deviation: Encompasses about 68% of normal price behavior (green zone)
±2 Standard Deviations: Covers approximately 95% of price movements (orange zone)
±3 Standard Deviations: Represents 99.7% probability range (red zone)
±3.5 and ±4 Thresholds: Extreme outlier levels that trigger special alerts
The z-score line changes color dynamically based on which zone it occupies, making it easy to identify the current market extremity at a glance.
Advanced Features:
Volume Contraction Analysis
The script monitors volume patterns to identify periods of reduced trading activity. It compares current volume against a moving average and flags when volume drops below a specified threshold (default 70%). Volume contraction often precedes significant price moves and is factored into the optimal entry detection system.
Momentum-Based Direction Model:
Rather than just showing current z-score levels, the indicator projects where the z-score is likely to move based on recent momentum. It calculates the rate of change in the z-score and extrapolates forward for a specified number of bars. This creates a directional arrow that indicates whether conditions are bullish (negative z-score with upward momentum) or bearish (positive z-score with downward momentum).
Divergence Detection System:
The script automatically identifies four types of divergences between price action and z-score behavior :-
Regular Bullish Divergence: Price makes lower lows while z-score makes higher lows, suggesting weakening downward pressure
Regular Bearish Divergence: Price makes higher highs while z-score makes lower highs, indicating exhaustion in the uptrend
Hidden Bullish Divergence: Price makes higher lows while z-score makes lower lows, confirming trend continuation in an uptrend
Hidden Bearish Divergence: Price makes lower highs while z-score makes higher highs, confirming downtrend continuation
The system uses pivot detection with configurable lookback periods and distance requirements, then draws connecting lines and labels directly on the chart when divergences occur.
Yearly Statistics Tracking:
The indicator maintains historical records of maximum z-score deviations over yearly periods (configurable bar count). This provides context by showing whether current extremes are unusual compared to typical annual ranges. The average yearly maximum helps traders understand if the current market is exhibiting normal volatility or exceptional conditions.
Mean Reversion Probability:
Based on the current z-score magnitude, the indicator calculates and displays the statistical probability that price will revert toward the mean. Higher absolute z-scores indicate stronger mean reversion probabilities, ranging from 38% at ±0.5 standard deviations to 99.7% at ±3 standard deviations.
Comprehensive Statistics Table:
A customizable on-chart table displays real-time statistics including:
Current z-score value with directional indicator
Predicted z-score based on momentum
Current year's maximum absolute z-score
Historical average yearly maximum
Mean reversion probability percentage
Zone status classification (Normal, Moderate, High, Extreme)
Directional bias (Bullish, Bearish, Neutral)
Active divergence status
Volume contraction status with ratio
Optimal setup detection (combining extreme z-scores with volume contraction)
Optimal Entry Setup Detection:
The most sophisticated feature identifies high-probability trading setups by combining multiple factors. An "Optimal Long" signal triggers when z-score reaches -3.5 or below AND volume is contracted. An "Optimal Short" signal appears when z-score exceeds +3.5 AND volume is contracted. This combination suggests extreme price deviation occurring on low volume, often preceding strong reversals.
Alert System:
The script includes a unified alert mechanism that triggers when z-score crosses specific thresholds:
Crossing above/below ±3.5 standard deviations (extreme levels)
Crossing above/below ±4 standard deviations (critical levels)
Alerts fire once per bar with confirmation (previous bar must be on opposite side of threshold) to avoid false signals.
Practical Application:
This indicator is designed for mean reversion traders who seek statistically significant price extremes. The combination of z-score measurement, volume analysis, momentum projection, and divergence detection creates a multi-layered confirmation system. Traders can use extreme z-scores as potential reversal zones, while the direction model and divergence signals help time entries more precisely. The volume contraction filter adds an additional layer of confluence, identifying moments when reduced participation may precede explosive moves back toward the mean.
Chart Attached: NSE GMR Airports, EoD 12/12/25
DISCLAIMER: This information is provided for educational purposes only and should not be considered financial, investment, or trading advice.Happy Trading

VX-Session-Boxes-(AM/PM Split)(Customizable) by Ikaru-s-VX-Session-Boxes-(AM/PM Split) is a session-based visualization tool for TradingView that highlights major market sessions directly on the chart using dotted range boxes and an optional AM/PM split.
The indicator allows traders to visually separate market behavior across different sessions while keeping the chart clean and readable.
🔹 Key Features
Custom Session Definitions
Define up to 4 independent sessions using TradingView’s session format (HHMM-HHMM + weekdays).
Timezone-Aware
All sessions are calculated using a user-defined timezone (IANA or UTC offset), ensuring accurate session alignment across markets.
Dotted Session Boxes
Each session is drawn as a dotted box based on the session’s high/low range, providing a clear view of volatility and price structure.
AM / PM Split Visualization
Sessions can be visually split into AM and PM parts:
Separate box shading for AM and PM
Optional dotted vertical split line at the AM → PM transition (12:00 in the selected timezone)
Session Labels
Optional labels at the start of each session for quick identification (e.g. Sydney, Tokyo, London, New York).
Fully Customizable Visuals
Adjustable opacity, border width, and visibility toggles for boxes, split lines, and labels.
🔹 Use Cases
Session-based market analysis (Asia / London / New York)
Identifying session ranges and volatility expansion
Observing price behavior differences between AM and PM
Studying session transitions and liquidity shifts
🔹 Notes
Session boxes are based on session high and low, not full chart height.
AM/PM split is based on 12:00 (noon) in the selected timezone.
Designed for clarity and performance on intraday timeframes.
🔹 Compatibility
Pine Script® v6
Works on all intraday timeframes
Overlay indicator (draws directly on the price chart)

Trendlines & SR ZonesIt's a comprehensive indicator (Pine Script v6) that represents two powerful technical analysis tools: automatic trendline detection based on pivot points and volume delta analysis with support/resistance zone identification. This overlay indicator helps traders identify potential trend directions and key price levels where significant buying or selling pressure has occurred.
Features: =
1. Price Trendlines
The indicator automatically identifies and draws trendlines based on pivot points, creating dynamic support and resistance levels.
Key Components:
Pivot Detection: Uses configurable left and right bars to identify significant pivot highs and lows
Trendline Filtering: Only draws downward-sloping resistance trendlines and upward-sloping support trendlines
Zone Creation: Creates filled zones around trendlines based on average price volatility
Automatic Management: Maintains only the 3 most recent significant trendlines to avoid chart clutter
Customization Options:
Left/Right Bars for Pivot: Adjust sensitivity of pivot detection (default: 10 bars each side)
Extension Length: Control how far trendlines extend past the second pivot (default: 50 bars)
Average Body Periods: Set the lookback period for volatility calculation (default: 100)
Tolerance Multiplier: Adjust the width of the trendline zones (default: 1.0)
Color Customization: Separate colors for high (resistance) and low (support) trendlines and their fills
2. Volume Delta % Bars
The indicator analyzes volume distribution across price levels to identify significant supply and demand zones.
Key Components:
Volume Profile Analysis: Divides the price range into rows and calculates volume delta at each level
Delta Visualization: Displays horizontal bars showing the percentage difference between buying and selling volume
Zone Identification: Automatically identifies the most significant supply and demand zones
Visual Integration: Connects volume delta bars with corresponding support/resistance zones on the price chart
Customization Options:
Lookback Period: Set the number of bars to analyze for volume (default: 200)
Price Rows: Control the granularity of the volume analysis (default: 50 rows)
Delta Sections: Adjust the number of horizontal delta bars displayed (default: 20)
Panel Appearance: Customize width, position, and direction of the delta panel
Zone Settings: Control the number of supply/demand zones and their extension (default: 3 zones)
How It Works-
Trendline Logic:
The script continuously scans for pivot highs and lows based on the specified left and right bars
When a pivot is detected, it creates a horizontal line at that price level
The script then looks for the previous pivot of the same type (high or low)
It connects these pivots with a trendline, extending it based on the user-specified setting
A parallel line is created to form a zone, with the distance based on average price volatility
The script filters out invalid trendlines (upward-sloping resistance and downward-sloping support). Only the 3 most recent trendlines are maintained to prevent chart clutter
Volume Delta Logic:
The script divides the price range over the lookback period into the specified number of rows
For each bar in the lookback period, it categorizes volume as bullish (close > open) or bearish (close < open). This volume is assigned to the appropriate price level based on the HLC3 price.
The price levels are grouped into sections, and the net delta (bullish - bearish volume) is calculated for each Horizontal bars are drawn to represent these delta percentages.
The most significant positive and negative deltas are identified and displayed as support and resistance zones. These zones are extended to the left on the price chart and connected to the delta panel with dotted lines.
Ideal Timeframes:
The indicator is versatile and can be used across multiple timeframes, but it performs optimally on specific timeframes depending on your trading style:
For Day Trading:
Optimal Timeframes: 15-minute to 1-hour charts
Why: These timeframes provide a good balance between noise reduction and sufficient volume data. The volume delta analysis is particularly effective on these timeframes as it captures intraday accumulation/distribution patterns while the trendlines remain reliable enough for intraday trading decisions.
For Swing Trading:
Optimal Timeframes: 1-hour to 4-hour charts
Why: These timeframes offer the best combination of reliable trendline formation and meaningful volume analysis. The trendlines on these timeframes are less prone to whipsaws, while the volume delta analysis captures multi-day trading sessions and institutional activity.
For Position Trading:
Optimal Timeframes: Daily and weekly charts
Why: On these higher timeframes, trendlines become extremely reliable as they represent significant market structure points. The volume delta analysis reveals longer-term accumulation and distribution patterns that can define major support and resistance zones for weeks or months.
Timeframe-Specific Adjustments:
Lower Timeframes (1-15 minutes):
Reduce left/right bars for pivots (5-8 bars)
Decrease lookback period for volume delta (50-100 bars)
Increase tolerance multiplier (1.2-1.5) to account for higher volatility
Higher Timeframes (Daily+):
Increase left/right bars for pivots (15-20 bars)
Extend lookback period for volume delta (300-500 bars)
Consider increasing the number of price rows (70-100) for more detailed volume analysis
Usage Guidelines-
For Trendline Analysis:
Use the trendlines as dynamic support and resistance levels
Price reactions at these levels can indicate potential trend continuation or reversal points
The filled zones around trendlines represent areas of price volatility or uncertainty
Consider the slope of the trendline as an indication of trend strength
For Volume Delta Analysis:
The horizontal delta bars show where buying or selling pressure has been concentrated
Green bars indicate areas where buying volume exceeded selling volume (demand)
Red bars indicate areas where selling volume exceeded buying volume (supply)
The highlighted supply and demand zones on the price chart represent significant price levels
These zones can act as future support or resistance areas as price revisits them
Customization Tips:
Trendline Sensitivity: Decrease left/right bars values to detect more pivots (more sensitive) or increase them for fewer, more significant pivots
Zone Width: Adjust the tolerance multiplier to make trendline zones wider or narrower based on your trading style
Volume Analysis: Increase the lookback period for a longer-term volume profile or decrease it for more recent activity
Visual Clarity: Adjust colors and transparency settings to match your chart theme and preferences
Conclusion:
This indicator provides traders with a comprehensive view of both trend dynamics and volume-based support/resistance levels. With these two analytical approaches, the indicator offers valuable insights for identifying potential entry and exit points, trend strength, and key price levels where significant market activity has occurred. The extensive customization options allow traders to adapt the indicator to various trading styles and timeframes, with optimal performance on 15-minute to daily charts depending on their trading horizon.
Chart Attached: NSE HINDZINC, EoD 12/12/25
DISCLAIMER: This information is provided for educational purposes only and should not be considered financial, investment, or trading advice. Please do boost if you like it. Happy Trading.

(5+15+60min+1D)EMA20+Y'SH/L+count简介: 这是一个专为 5分钟图表 (5min Chart) 日内交易者设计的综合辅助工具。它结合了多周期趋势均线、美股核心交易时段的时间周期计数以及关键流动性位置(前一日高低点)的智能突破监测。该脚本针对美股个股及 24/7 交易的 BTC/ETH 进行了优化,强制锁定纽约时间进行运算。
核心功能:
1. 多周期 EMA 监控系统 (MTF EMAs)
5min EMA20 (蓝色):日内短期趋势核心线(默认开启)。
60min EMA20 (绿色):小时级别趋势参考(默认开启)。
15min EMA20 (红色) & 1D EMA20 (橙色):可选开启,用于捕捉更大周期的支撑阻力。
特点:所有均线采用最细线宽,平滑显示,右上角表格实时展示当前价格。
2. 美股时段 Bar Count 计数器
时间锚定:以纽约时间 (New York Time) 09:30 开盘为起点(Bar 0)。
显示规则:仅在 K 线底部显示 偶数 序号 (0, 2, 4, 6 ...),直至第 82 根 K 线停止。
关键时间窗 (Time Pivots):
Bar 18 (约 NY 10:55) 和 Bar 40 (约 NY 12:45) 会被自动高亮。
字体变为 蓝色粗体,且对应 K 线实体变为蓝色,提示潜在的变盘或宏观流动性注入时刻。
3. 智能 PDH/PDL 射线 (Smart Rays)
精确锚点:前一日高点 (PDH) 和低点 (PDL) 的射线不是从开盘画起,而是从昨日形成高低点的具体时间点射出,精确还原价格行为。
自动阻断 (Breakout Logic):一旦当前价格触碰或突破该射线,射线将自动停止延伸,直观展示“阻力/支撑已失效”。
自动清理:每日自动清除旧线,仅保留当天的参考线,保持图表整洁。
4. 视觉优化
每日分割线:自动绘制灰色虚线分隔交易日。
图表限制:脚本仅在 5分钟图表上可见,切换周期自动隐藏,避免干扰大周期分析。
设置说明:
可在设置面板中自由开关各周期 EMA 的显示。
可开关底部的计数数字显示。
English Version (for TradingView Publishing)
Title: 5min Intraday Precision Toolkit: MTF EMAs + NY Session Count + Smart Rays
Introduction: This is a comprehensive auxiliary tool designed specifically for 5-minute chart intraday traders. It combines multi-timeframe trend EMAs, time cycle counting based on the US Session, and smart breakout monitoring for key liquidity levels (Previous Day High/Low). Optimized for US Equities and Crypto (BTC/ETH) using New York Time.
Key Features:
1. Multi-Timeframe EMA System
5min EMA20 (Blue): Core short-term intraday trend (On by default).
60min EMA20 (Green): Hourly trend reference (On by default).
15min EMA20 (Red) & 1D EMA20 (Orange): Optional overlays for higher timeframe support/resistance.
Visuals: All EMAs are rendered with fine lines for a clean look, accompanied by a top-right dashboard table.
2. NY Session Bar Count
Time Anchor: Starts counting from 09:30 New York Time (Bar 0).
Display Logic: Displays only EVEN numbers (0, 2, 4...) at the bottom of the bars, stopping at count 82.
Time Pivots:
Bar 18 (~10:55 NY) and Bar 40 (~12:45 NY) are highlighted.
Labels turn Bold Blue, and the specific candles are colored Blue to indicate potential reversal or liquidity injection times.
3. Smart PDH/PDL Rays
Precise Origin: Rays for Previous Day High (PDH) and Previous Day Low (PDL) originate from the exact timestamp they were created yesterday, not just the daily open.
Breakout Stop Logic: Rays automatically stop extending once price touches or breaks them, clearly indicating that the level has been tested.
Auto-Clean: Automatically removes old rays from previous days to keep the chart clean.
4. Visual Optimization
Daily Separators: Automatic vertical dotted lines marking new days.
Visibility: All elements are hidden on non-5m charts to prevent clutter.
Settings:
Toggle visibility for individual EMAs.
Toggle visibility for the bottom bar counter.

ChronoPulse MS-MACD Resonance StrategyChronoPulse MS-MACD Resonance Strategy
A systematic trading strategy that combines higher-timeframe market structure analysis with dual MACD momentum confirmation, ATR-based risk management, and real-time quality assurance monitoring.
Core Principles
The strategy operates on the principle of multi-timeframe confluence, requiring agreement between:
Market structure breaks (CHOCH/BOS) on a higher timeframe
Dual MACD momentum confirmation (classic and crypto-tuned profiles)
Trend alignment via directional EMAs
Volatility and volume filters
Quality score composite threshold
Strategy Components
Market Structure Engine : Detects Break of Structure (BOS) and Change of Character (CHOCH) events using confirmed pivots on a configurable higher timeframe. Default structure timeframe is 240 minutes (4H).
Dual MACD Fusion : Requires agreement between two MACD configurations:
Classic MACD: 12/26/9 (default)
Fusion MACD: 8/21/5 (default, optimized for crypto volatility)
Both must agree on direction before trade execution. This can be disabled to use single MACD confirmation.
Trend Alignment : Uses two EMAs for directional bias:
Directional EMA: 55 periods (default)
Execution Trend Guide: 34 periods (default)
Both must align with trade direction.
ATR Risk Management : All risk parameters are expressed in ATR multiples:
Stop Loss: 1.5 × ATR (default)
Take Profit: 3.0 × ATR (default)
Trail Activation: 1.0 × ATR profit required (default)
Trail Distance: 1.5 × ATR behind price (default)
Volume Surge Filter : Optional gate requiring current volume to exceed a multiple of the volume SMA. Default threshold is 1.4× the 20-period volume SMA.
Quality Score Gate : Composite score (0-1) combining:
Structure alignment (0.0-1.0)
Momentum strength (0.0-1.0)
Trend alignment (0.0-1.0)
ATR volatility score (0.0-1.0)
Volume intensity (0.0-1.0)
Default threshold: 0.62. Trades only execute when quality score exceeds this threshold.
Execution Discipline : Trade budgeting system:
Maximum trades per session: 6 (default)
Cooldown bars between entries: 5 (default)
Quality Assurance Console : Real-time monitoring panel displaying:
Structure status (pass/fail)
Momentum confirmation (pass/fail)
Volatility readiness (pass/fail)
Quality score (pass/fail)
Discipline compliance (pass/fail)
Performance metrics (win rate, profit factor)
Net PnL
Certification requires: Win Rate ≥ 40%, Profit Factor ≥ 1.4, Minimum 25 closed trades, and positive net profit.
Integrity Suite : Optional validation panel that audits:
Configuration sanity checks
ATR data readiness
EMA hierarchy validity
Performance realism checks
Strategy Settings
strategy(
title="ChronoPulse MS-MACD Resonance Strategy",
shorttitle="ChronPulse",
overlay=true,
max_labels_count=500,
max_lines_count=500,
initial_capital=100000,
currency=currency.USD,
pyramiding=0,
commission_type=strategy.commission.percent,
commission_value=0.015,
slippage=2,
default_qty_type=strategy.percent_of_equity,
default_qty_value=2.0,
calc_on_order_fills=true,
calc_on_every_tick=true,
process_orders_on_close=true
)
Key Input Parameters
Structure Timeframe : 240 (4H) - Higher timeframe for structure analysis
Structure Pivot Left/Right : 3/3 - Pivot confirmation periods
Structure Break Buffer : 0.15% - Buffer for structure break confirmation
MACD Fast/Slow/Signal : 12/26/9 - Classic MACD parameters
Fusion MACD Fast/Slow/Signal : 8/21/5 - Crypto-tuned MACD parameters
Directional EMA Length : 55 - Primary trend filter
Execution Trend Guide : 34 - Secondary trend filter
ATR Length : 14 - ATR calculation period
ATR Stop Multiplier : 1.5 - Stop loss in ATR units
ATR Target Multiplier : 3.0 - Take profit in ATR units
Trail Activation : 1.0 ATR - Profit required before trailing
Trail Distance : 1.5 ATR - Distance behind price
Volume Threshold : 1.4× - Volume surge multiplier
Quality Threshold : 0.62 - Minimum quality score (0-1)
Max Trades Per Session : 6 - Daily trade limit
Cooldown Bars : 5 - Bars between entries
Win-Rate Target : 40% - Minimum for QA certification
Profit Factor Target : 1.4 - Minimum for QA certification
Minimum Trades for QA : 25 - Required closed trades
Signal Generation Logic
A trade signal is generated when ALL of the following conditions are met:
Higher timeframe structure shows bullish (CHOCH/BOS) or bearish structure break
Both MACD profiles agree on direction (if fusion enabled)
Price is above both EMAs for longs (below for shorts)
ATR data is ready and above minimum threshold
Volume exceeds threshold × SMA (if volume gate enabled)
Quality score ≥ quality threshold
Trade budget available (under max trades per day)
Cooldown period satisfied
Risk Management
Stop loss and take profit are set immediately on entry
Trailing stop activates after 1.0 ATR of profit
Trailing stop maintains 1.5 ATR distance behind highest profit point
Position sizing uses 2% of equity per trade (default)
No pyramiding (single position per direction)
Limitations and Considerations
The strategy requires sufficient historical data for higher timeframe structure analysis
Quality gate may filter out many potential trades, reducing trade frequency
Performance metrics are based on historical backtesting and do not guarantee future results
Commission and slippage assumptions (0.015% + 2 ticks) may vary by broker
The strategy is optimized for trending markets with clear structure breaks
Choppy or ranging markets may produce false signals
Crypto markets may require different parameter tuning than traditional assets
Optimization Notes
The strategy includes several parameters that can be tuned for different market conditions:
Quality Threshold : Lower values (0.50-0.60) allow more trades but may reduce average quality. Higher values (0.70+) are more selective but may miss opportunities.
Structure Timeframe : Use 240 (4H) for intraday trading, Daily for swing trading, Weekly for position trading
Volume Gate : Disable for low-liquidity pairs or when volume data is unreliable
Dual MACD Fusion : Disable for mean-reverting markets where single MACD may be more responsive
Trade Discipline : Adjust max trades and cooldown based on your risk tolerance and market volatility
Non-Repainting Guarantee
All higher timeframe data requests use lookahead=barmerge.lookahead_off to prevent repainting. Pivot detection waits for full confirmation before registering structure breaks. All visual elements (tables, labels) update only on closed bars.
Alerts
Three alert conditions are available:
ChronoPulse Long Setup : Fires when all long entry conditions are met
ChronoPulse Short Setup : Fires when all short entry conditions are met
ChronoPulse QA Certification : Fires when Quality Assurance console reaches CERTIFIED status
Configure alerts with "Once Per Bar Close" delivery to match the non-repainting design.
Visual Elements
Structure Labels : CHOCH↑, CHOCH↓, BOS↑, BOS↓ markers on structure breaks
Directional EMA : Orange line showing trend bias
Trailing Stop Lines : Green (long) and red (short) trailing stop levels
Dashboard Panel : Real-time status display (structure, MACD, ATR, quality, PnL)
QA Console : Quality assurance monitoring panel
Integrity Suite Panel : Optional validation status display
Recommended Usage
Forward test with paper trading before live deployment
Monitor the QA console until it reaches CERTIFIED status
Adjust parameters based on your specific market and timeframe
Respect the trade discipline limits to avoid over-trading
Review quality scores and adjust threshold if needed
Use appropriate commission and slippage settings for your broker
Technical Implementation
The strategy uses Pine Script v6 with the following key features:
Multi-timeframe data requests with lookahead protection
Confirmed pivot detection for structure analysis
Dynamic trailing stop management
Real-time quality score calculation
Trade budgeting and cooldown enforcement
Comprehensive dashboard and monitoring panels
All source code is open and available for review and modification.
Disclaimer
This script is for educational and informational purposes only. It is not intended as financial, investment, or trading advice. Past performance does not guarantee future results. Trading involves substantial risk of loss and is not suitable for all investors. Always conduct your own research and consult with a qualified financial advisor before making any trading decisions. The author and TradingView are not responsible for any losses incurred from using this strategy.

Session VWAPs [cryptalent]This indicator provides a more granular and timely analysis of market structure compared to traditional daily Volume Weighted Average Price (VWAP). It splits the 24-hour trading day into four distinct, customizable sessions (T1, T2, T3, T4), calculating an independent Session VWAP and Standard Deviation Bands for each segment.
🌟 Key Features and Functionality
1. Segmented VWAP Calculation
Purpose: To track the true Volume Weighted Average Price (Fair Value) specific to the participants and trading activities within different global market sessions (e.g., Asian, European, US sessions).
Design: By default, the 24 hours (based on UTC time) are divided into T1 (00:00-06:00), T2 (06:00-12:00), T3 (12:00-20:00), and T4 (20:00-00:00).
Mechanism: The VWAP calculation resets at the start of each designated session, offering a clearer, segment-specific view of market consensus and volume absorption.
2. Standard Deviation Bands
Calculation: Each Session VWAP line is accompanied by upper and lower standard deviation bands.
Control: The width of these bands is controlled by the user input "Band Multiplier" (default is 1.0, representing one standard deviation).
Application: These bands measure the Volume-Weighted Volatility and define the expected "normal" trading range for the current session.
- Price within the bands suggests consolidation or a normal auction process.
- Price breaking out of the bands indicates strong directional momentum or an extreme/overbought/oversold condition for that specific session.
3. High Customization (User Inputs)
Session Timing: All four session start and end times (in UTC) are customizable, allowing traders to align the indicator with specific market hours or individual trading strategies.
Price Source: The source price used for the VWAP calculation is selectable (default is close).
💡 Trading Applications
1. Fair Value Identification: The VWAP line serves as the "Fair Value" or "Volume-Weighted Consensus Cost" for the active session.
Price above VWAP: Buyers are in control during that session.
Price below VWAP: Sellers are in control during that session.
2. Dynamic Support & Resistance: Both the VWAP and the Standard Deviation Bands often act as reliable dynamic support and resistance levels.
3. Volatility Assessment: The width of the bands reflects the volume-weighted volatility of the current session. Narrow bands suggest range-bound trading; wide bands imply strong directional activity.
4. Trend Strength: Sustained price action outside of the standard deviation bands is a key measure of the strength and commitment behind a current trend.

🟡 GOLD 4H HUD v12 — Time-Safe Nuclear Edition🟡 GOLD 4H HUD v12 — Time-Safe Nuclear Edition
A full–scale Smart Money Concepts (SMC) analytics engine designed exclusively for XAUUSD on the 4-Hour timeframe.
This script combines market structure, liquidity, displacement, order blocks, imbalance, volume profile, SMT divergence, and institutional behavior modeling into a single unified HUD.
Built with a time-safe architecture, all structural elements (OB/FVG/Sweep) are stored by timestamp to minimize repainting and preserve event integrity.
📌 Core Features (12 Modules + Full HUD)
1 — Market Structure Engine
Automatically detects:
HH / HL / LH / LL
BOS (Break of Structure)
MSS (Market Structure Shift)
CHOCH (Change of Character)
Real swing pivots & trend state
2 — Sweep Engine (Liquidity Grab Detection)
Identifies institutional liquidity grabs:
Break + reclaim of highs/lows
ATR-filtered invalidation
Displacement-backed sweeps
3 — Time-Safe FVG Engine
Detects Bullish/Bearish Fair Value Gaps
ATR-tolerant FVG logic
Automatic right-extension
Auto-delete when filled or invalid
4 — Time-Safe Order Block Engine
Demand & Supply OB detection
Strength classification (Weak vs Strong)
FVG-overlap confirmation
Timestamp-locked (non-repainting)
5 — Volume Profile Engine (HVN / LVN / POC)
Real-time micro-profile:
High Volume Node (HVN)
Low Volume Node (LVN)
Point of Control (POC)
6 — SMT Engine (Gold vs DXY Divergence)
Smart Money Divergence built-in:
Bullish SMT
Bearish SMT
Directional confirmation with zero lag
7 — Displacement Engine
Measures institutional impulse:
Body-based impulse detection
Multi-leg continuation signals
FVG continuation moves
Generates displacement score
8 — Premium / Discount Model
Auto-classifies price into:
Discount (Buy zone)
Premium (Sell zone)
9 — SMC Trend Engine (Score-Based)
Combines 10+ factors:
Structure
FVG
OB power
Displacement
POC positioning
SMT conditions
Outputs:
BULL / BEAR / RANGE
Full scoring system
10 — Institutional Imbalance Model (IMB Engine)
Combines:
PD zones
Sweep direction
Displacement
SMT
OB strength
CHOCH/MSS
A complete institutional bias filter.
11 — Entry Engine (Signal Fusion Model)
Entry conditions fuse:
Sweep
CHOCH
Displacement
OB strength
FVG alignment
SMT confirmation
Also outputs:
Suggested SL/TP
Entry score
12 — Trendline Engine
Auto-draws:
HL → HL bullish trendlines
LH → LH bearish trendlines
+ Full Nuclear HUD
Displays:
Market structure
Trend direction
SMT / CHOCH / MSS
FVG / OB zones
HVN / LVN / POC
Liquidity strength
Entry model
Liquidity Magnet direction
SL/TP map
A complete institutional dashboard in one place.
⚠ Usage Requirement
This script is designed ONLY for the 4H timeframe.
✨ Summary
GOLD 4H HUD v12 — Time-Safe Nuclear Edition
is not just an indicator.
It is a full institutional-grade SMC analysis system, built specifically for Gold.
If you trade XAUUSD on the 4H timeframe —
this is your complete market intelligence HUD
