DOW 30 - Market BreadthDOW 30 indicator is intended for short-term intraday analysis and should not be used solely alone. Best to use this indicator in a combination with technical and fundamental analysis.
This indicator is calculated from all stocks in the DJI as of 8/9/2022;
- Evaluating VWAP,
- 9 EMA,
- 20 EMA.
Vwap Calculations;
Stock above Vwap = 1 (Vwap Bull),
Stock below Vwap = 1 (Vwap Bear),
As there are 30 stocks in the DJI, there is a max value of 30 Vwap Bulls/ Vwap Bears.
Ema Calculation;
Stock above 9 EMA = 0.5 (EMA Bulls),
Stock below 9 EMA = 0.5 (EMA Bears),
Stock above 20 EMA = 0.5 (EMA Bulls),
Stock below 20 EMA = 0.5 (EMA Bears),
For the EMA Bulls to reach 30 all stocks must be trading above both the 9 EMA and 20 EMA to reach a Max Value of 30.
The reasoning for this calculation is to suggest the current strength and speed of the current turn in the market.
Horizontal Lines:
There are three horizontal lines, MAX, MIN & Neutral;
MAX & MIN
Resides at the 30 & 0 levels suggesting the market is currently at an extreme. Representing all stocks are moving in the same direction together.
When the MAX or MIN are represented in the VWAP Line this represents directional conviction in the underlining DJI.
Neutral
Neutral resides at the 15 level and represents that the market is either about to make a decision or is choppy.
EXAMPLE
Below are some examples of how the DOW 30 indicator is able to represent the current market conditions.
Understand Current Market Conditions, either being Bullish, Neutral, or Bearish.
See live Market Mechanics, and understand the current market direction on a short-term timeframe.
DOW 30 indicator is intended for short-term intraday analysis and should not be used solely alone. Best to use this indicator in a combination with technical and fundamental analysis.
If there are any additional requests to the indicator feel free to leave a comment or privet message.
Best of luck trading.
Cerca negli script per "20年美元汇率"

Short Selling EMA Cross (By Coinrule)BINANCE:AVAXUSDT
This short selling script works best in periods of downtrends and general bearish market conditions, with the ultimate goal to sell as the the price decreases further and buy back before a rebound.
This script can work well on coins you are planning to hodl for long-term and works especially well whilst using an automated bot that can execute your trades for you. It allows you to hedge your investment by allocating a % of your coins to trade with, whilst not risking your entire holding. This mitigates unrealised losses from hodling as it provides additional cash from the profits made. You can then choose to to hodl this cash, or use it to reinvest when the market reaches attractive buying levels.
Entry
The exponential moving average ( EMA ) 20 and EMA 50 have been used for the variables determining the entry to the short. EMAs can operate better than simple moving averages due to the additional weighting placed on the most recent data points, whereas simple moving averages weight all the data the same. This means that price is tracked more closely and the most recent volatile moves can be captured and exploited more efficiently using EMAs.
Our backtesting data revealed that the most profitable timeframe was the 30-minute timeframe, this also enabled a good frequency of trades and high profitability.
A fast (shorter term) exponential moving average , in this strategy the EMA 20, crossing under a slow (longer term) moving average, in this example the EMA 50, signals the price of an asset has started to trend to the downside, as the most recent data signals price is declining compared to earlier data. The entry acts on this principle and executes when the EMA 20 crosses under the EMA 50.
Enter Short: EMA 20 crosses under EMA 50.
Exit
This script utilises a take profit and stop loss for the exit. The take profit is set at -8% and the stop loss is set at +16% from the entry price. This would normally be a poor trade due to the risk:reward equalling 0.5. However, when looking at the backtesting data, the high profitability of the strategy (93.33%) leads to increased confidence and showcases the high probability of success according to historical data.
The take profit (-8%) and the stop loss (+16%) of the strategy are widely placed to ensure the move is captured without being stopped out due to relief rallies. The stop loss also plays a role of mitigating losses and minimising risk of being stuck in a short position once there has been a fundamental trend reversal and the market has become bullish .
Exit Short: -8% price decrease from entry price.
OR
Exit Short: +16% price increase from entry price.
Tip: Research what coins have consistent and large token unlocks / highly inflationary tokenomics, and target these during bear markets to short as they will most likely have substantial selling pressure that outweighs demand - leading to declining prices.
The strategy assumes each order is using 30% of the available coins to make the results more realistic and to simulate you only ran this strategy on 30% of your holdings. A trading fee of 0.1% is also taken into account and is aligned to the base fee applied on Binance.
The backtesting data was recorded from December 1st 2021, just as the market was beginning its downtrend. We therefore recommend analysing the market conditions prior to utilising this strategy as it operates best on weak coins during downtrends and bearish conditions.

MTF Stochastic ScannerThis Stochastic scanner can be use to identify overbought and oversold of 10 symbols over multiple timeframes
it will give you a quick overview which pair is more overbough or more oversold and also signals tops and bottoms in the AVG row
light red/green cell = weak bearish (Stoch = 30-20) / bullish (Stoch = 70-80)
medium red/green cell = bearish (Stoch = 20-10) / bullish (Stoch = 80-90)
dark red/green cell = strong bearish (Stoch <= 10) / bullish (Stoch >= 90)
gray cell = neutral (Stoch = 30-70)
Usage
If AVG (average of all 4 timeframes) falls below 20, the cell will get green, indicating a good time to enter long (buy)
If AVG (average of all 4 timeframes) rises above 80, the cell will get red, indicating a good time to enter short (sell)
Use the "MTF Stochastic Scanner" in combination with the " MTF RSI Scanner "
to find tops (RSI MTF avg >=70 AND Stochastic MTF avg >= 80)
or bottoms (RSI MTF avg <= 30 AND Stochastic MTF avg <= 20)
Here is how the two MTF scanners looked on Nov 08 2021 (ATH) »
and here how the MTF scanners looked on June 21 2022
use TradingViews Replay function to check how it would have worked in the past and when not.
As always… there NOT a single indicator that can show to the top & bottom 100% every single time. So use with caution, with other indicators and/or deeper understanding of technicals analysis ☝️☝️☝️
Settings
You can change the timeframes, symbols, Stochastic settings, overbought/oversold levels and colors to your liking
Drag the table onto the price chart, if you want to use it as an overlay.
NOTE:
Because of the 4x10 security requests, it can take up to 1 minute for changed settings to take effect! Please be patient 🙃
If you have any idea on how to optimise the code, please feel free to share 🙏
*** Inspired by "Binance CHOP Dashboard" from @Cazimiro and "RSI MTF Table" from @mobester16 ***

Earnings Price Move Cheat Sheet [KT]Hello!
This script looks to distinguish replicable sequences and correlations between earnings releases and price. The indicator calculates the average 1-session to 20-session performance of an asset prior to an earnings release, and the 1-session to 20-session performance of an asset subsequent an earnings release.
You can select the number of sessions the script calculates for asset performance.
In the image above the script calculates the average 1-session performance following an earnings surprise, earnings miss, and in general. 20 sessions is the maximum value!
Also measured is the average performance of an asset before and after earnings, in addition to the average performance following an earnings surprise "green earnings" and the average performance following an earnings miss "red earnings".
I included VaR and CVaR calculations - using the historical method - in the script. For those of you unfamiliar with the metrics, both look to quantify the risk of financial loss for a portfolio, or even a particular position.
The script also calculates the 1st - 5th percentile for earnings losses. A more comprehensive explanation of the metrics is stored in tooltips in the user input tab.
The script also calculates the highest high and lowest low following an earnings release, up to 20 sessions, and calculates the difference between the two.
Keep in mind that a company might not have a significant number of earnings misses, or may have only traded publicly for a short while. If true, the resulting earnings/price calculations *will* be misleading - there is an insufficient sample size; no correlations are ascertainable.
I will be working on this script more, so let me know if there is anything you would like included!

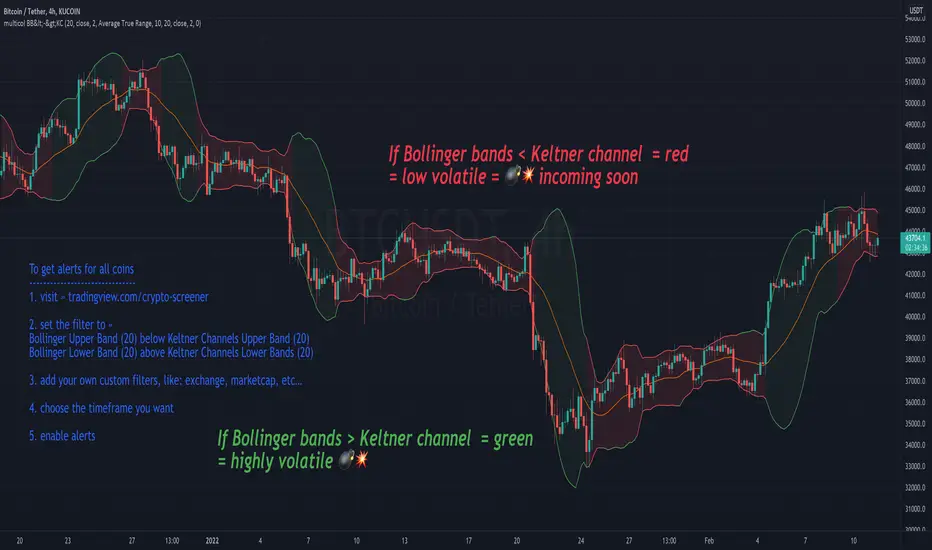
multicolor Bollinger Bands (BB <-> KC)Concept:
After every low volatile phase comes a high volatile phase and after every high volatile phase comes a low volatile phase.
If the Bollinger bands are smaller then the Keltner channel (colored red), the price action is low in volatility… meaning a breakout (colored green) will happen soon.
If Bollinger band is bigger than the Keltner channel = green
If Bollinger band is smaller than the Keltner channel = red
Displaying the Keltner Channel is optional
If multicolor BB is disabled, BB color = blue (default color)
Customise colors to your liking under settings -> style
-----------------------------------
To get alerts for all coins
1. visit » tradingview.com/crypto-screener
2. set the filter to »
Bollinger Upper Band (20) below Keltner Channels Upper Band (20)
Bollinger Lower Band (20) above Keltner Channels Lower Bands (20)
3. add your own custom filters, like: exchange, marketcap, etc…
4. choose the timeframe you want
5. enable alerts
Volume Adaptive Bollinger Bands (MZ VABB)This indicator is a functional enhancement to John Bollinger's Bollinger Bands. I've used Volume to adapt dynamic length which is used in basis (middle line) of Bollinger Bands and Simple Moving Average is replaced with Adaptive Ehlers Deviation Scaled Moving Average ( AEDSMA ).
BOLLINGER BANDS BASIC USAGE AND LIMITATIONS
Bollinger bands are popular among traders because of their simple way to detect volatility in market and redefine support and resistance accordingly. These are some basic usages of original Bollinger Bands:
Most commonly Bollinger Band works on 20 period Simple Moving Average as Basis / Middle Line and standard deviation of 2 for volatility detection.
Upper and lower bands can act as support and resistance which accordingly update with standard deviation of same period as of Simple Moving Average.
As upper and lower bands act as volatility measure which benefits in Squeeze detection and breakout trading.
Among all the usages there are some limitations as follows:
Original Bollinger Bands use 20 period Simple Moving Average as Basis which itself restricted to some number of data pints and if market moves in one direction or simply goes sideways for long time; candles can stay on either bands for long time. This gives benefit for staying in directional trade but will completely nullify the use of both bands as support and resistance.
Above point simply be explained as markets can stay overbought / oversold for long time and one way to make Bollinger Bands more useful is to simply use higher periods in SMA but as we know with higher periods SMA becomes more laggy and less adaptive.
Most traders use BBs alongside some other Volume Oscillator for example "On Balance Volume" but that does solve BBs limitations issue that it should be more adaptive to detect volatility in market.
VOLUME ADAPTIVE BOLLINGER BAND WORKING PRINCIPLE
Best way to make original Bollinger band more adaptive was to just use dynamic length instead on constant 20 period. This dynamic length had to be based on some other powerful parameter which can't be volatility as BB itself is a volatility indicator and adapting its length based volatility would have been superimposing volatility on Bollinger bands giving unrealistic results.
For adaptive length, I tried using Volume and for this purpose I used my Relative Volume Strength Index " RVSI " indicator. RVSI is the best way to detect if Volume is going for a breakout or not and based on that indication length of Bollinger Band Basis Moving Average changes.
RVSI breaking above provided value would indicate Volume breakout and hence dynamic length would accordingly make Bollinger band basis moving average more over fitted and similarly standard deviation of achieved dynamic length would give better bands for support and resistance. Similar case would happen if Volume goes down and dynamic length becomes more underfit.
According to my back testing studies I found that Simple Moving Average wasn't the best choice for dynamic length usage in Bollinger Band Basis. So, I used Adaptive Ehlers Deviation Scaled Moving Average ( AEDSMA ) which is more adaptive and already modified to adapt with RVSI.
SLOPE USAGE FOR TREND STRENGTH DETCTION
Volume Adaptive Bollinger Bands are more reactive to market trends so, I used slope for trend strength detection.
If slope of Volume Adaptive Bollinger Band Basis (i.e. AEDSMA ), Upper and Lower Bands is supporting a trend at same time then script will provide signal in that direction. That signal can also use Volume as confirmation if Bollinger Bands trend direction is supported by Volume or not.
DYNAMIC COLORS AND TREND CORRELATION
I’ve used dynamic coloring in Basis ( AEDSMA ) to identify trends with more detail which are as follows:
Lime Color: Slope supported Strong Uptrend also supported by Volume and Volatility or whatever you’ve chosen from both of them.
Fuchsia Color: Weak uptrend only supported by Slope or whatever you’ve selected.
Red Color: Slope supported Strong Downtrend also supported by Volume and Volatility or whatever you’ve chosen from both of them.
Grey Color: Weak Downtrend only supported by Slope or whatever you’ve selected.
Yellow Color: Possible reversal indication by Slope if enabled. Market is either sideways, consolidating or showing choppiness during that period.
SIGNALS
Green Circle: Market good for long with support of Volume and Volatility or whatever you’ve chosen from both of them.
Red Circle: Market good to short with support from Volume and Volatility or whatever you’ve chosen from both of them.
Flag: Market either touched upper or lower band and can act as good TP and warning for reversal.
FIBONACCI BANDS
I’ve included Fibonacci multiple bands which would act as good support/resistance zones. For example, 0.618 Fib level act as good local support and resistance in both upper and lower zones. Fibonacci values can be modified but should be lower than 1.
DEFAULT SETTINGS
I’ve set default Minimum length to 50 and Maximum length to 100 which I’ve found works best for almost all timeframes but you can change this delta to adapt your timeframe accordingly with more precision.
Dynamic length adoption is enabled based on Volume only but volatility can be selected which is already explained above.
Trend signals are enabled based on Slope and Volume but Volatility can be enabled for more precise confirmations.
In “ RVSI ” settings "Klinger Volume Oscillator" is set to default but others work good too especially Volume Zone Oscillator. For more details about Volume Breakout you can check “MZ RVSI Indicator".
ATR breakout is set to be positive if period 14 exceeds period 46 but can be changed if more adaption with volatility is required.
EDSMA super smoother filter length is set to 20 which can be increased to 50 or more for better smoothing but this will also change slope results accordingly.
EDSMA super smoother filter poles are set to 2 because found better results with 2 instead of 3.
FURTHER ENHANCEMENTS
So far, I've achieved better results with "Klinger Volume Oscillator" in RVSI but TFS Volume Oscillator and On Balance Volume can be used which would change dynamic length differently. It doesn't mean that results would be wrong with some oscillator and precise with others but every oscillator works in its specific way for and RVSI just detect strength of Volume based on provided oscillator.

Market Breadth EMAs V2Second version of Market Breadth EMAs for $SPY. Getting a little more complicated than V1 but removed noise.
Key:
Green line = % of stocks above their 20-period moving average, the "twitch line"
Red line = % of stocks above their 200-period moving average, the "long term trend"
White line = weighted average of the % of stocks above the 20/50/100/200 averages, the "general trend." Captures bursts that the 200 misses, and is more trustworthy than the 20.
Background colors = limits of the red/green/white where reversals have happened historically. The darker the color, the stronger the signal.
Histogram = the change in the white line over time, for different time periods: 1/4/10/20, the "trend strength/confidence." i.e. If the white line "General Trend" has been drifting lower for a month but started increasing the past 2 days, you might have 3 red histograms and 1 green one.
Techniques:
If the green, red, or white line is above 50%, then more than half the stocks are above that average. So, if they're in the top half, bullish market. Bottom half, bearish market.
If the green line is above the red, market has rising/bullish momentum. If red is above green, market has falling/bearish momentum.
If the white line is rising, bullish momentum. If it's falling, bearish momentum.
If the histograms are all green, there is strong momentum in that direction. The % of stocks above their important averages has been increasing each day for both the short term and long term.
If the histograms go from all green to a mix of green and red, be on the lookout for a reversal from one of the background levels. Usually initiates from the 20 (green line) first.
If price dips without the histogram changing, HODL.

Indicators Combination Framework v3 IND [DTU]Hello All,
This script is a framework to analyze and see the results by combine selected indicators for (long, short, longexit, shortexit) conditions.
I was designed this for beginners and users to facilitate to see effects of the technical indicators combinations on the chart WITH NO CODE
You can improve your strategies according the results of this system by connecting the framework to a strategy framework/template such as Pinecoder, Benson, daveatt or custom.
This is enhanced version of my previous indicator "Indicators & Conditions Test Framework "
Currently there are 93 indicators (23 newly added) connected over library. You can also import an External Indicator or add Custom indicator (In the source)
It is possible to change it from Indicator to strategy (simple one) by just remarking strategy parts in the source code and see real time profit of your combinations
Feel free to change or use it in your source
Special thanks goes to Pine wizards: Trading view (built-in Indicators), @Rodrigo, @midtownsk8rguy, @Lazybear, @Daveatt and others for their open source codes and contributions
SIMPLE USAGE
1. SETTING: Show Alerts= True (To see your entries and Exists)
2. Define your Indicators (ex: INDICATOR1: ema(close,14), INDICATOR2: ema(close,21), INDICATOR3: ema(close,200)
3. Define Your Combinations for long & Short Conditions
a. For Long: (INDICATOR1 crossover INDICATOR2) AND (INDICATOR3 < close)
b. For Short: (INDICATOR1 crossunder INDICATOR2) AND (INDICATOR3 > close)
4. Select Strategy/template (Import strategy to chart) that you export your signals from the list
5. Analyze the best profit by changing Indicators values
SOME INDICATORS DETAILS
Each Indicator includes:
- Factorization : Converting the selected indicator to Double, triple Quadruple such as EMA to DEMA, TEMA QEMA
- Log : Simple or log10 can be used for calculation on function entries
- Plot Type : You can overlay the indicator on the chart (such ema) or you can use stochastic/Percentrank approach to display in the variable hlines range
- Extended Parametes : You can use default parameters or you can use extended (P1,P2) parameters regarding to indicator type and your choice
- Color : You can define indicator color and line properties
- Smooth : you can enable swma smooth
- indicators : you can select one of the 93 function like ema(),rsi().. to define your indicator
- Source : you can select from already defined indicators (IND1-4), External Indicator (EXT), Custom Indicator (CUST), and other sources (close, open...)
CONDITION DETAILS
- There are are 4 type of conditions, long entry, short entry, long exit, short exit.
- Each condition are built up from 4 combinations that joined with "AND" & "OR" operators
- You can see the results by enabling show alerts check box
- If you only wants to enter long entry and long exit, just fill these conditions
- If "close on opposite" checkbox selected on settings, long entry will be closed on short entry and vice versa
COMBINATIONS DETAILS
- There are 4 combinations that joined with "AND" & "OR" operators for each condition
- combinations are built up from compare 1st entry with 2nd one by using operator
- 1st and 2nd entries includes already defined indicators (IND1-5), External Indicator (EXT), Custom Indicator (CUST), and other sources (close, open...)
- Operators are comparison values such as >,<, crossover,...
- 2nd entry include "VALUE" parameter that will use to compare 1st indicator with value area
- If 2nd indicator selected different than "VALUE", value are will mean previous value of the selection. (ex: value area= 2, 2nd entry=close, means close )
- Selecting "NONE" for the 1st entry will disable calculation of current and following combinations
JOINS DETAILS
- Each combination will join wiht the following one with the JOIN (AND, OR) operator (if the following one is not equal "NONE")
CUSTOM INDICATOR
- Custom Indicator defines harcoded in the source code.
- You can call it with "CUST" in the Indicator definition source or combination entries source
- You can change or implement your custom indicator by updating the source code
EXTERNAL INDICATOR
- You can import an external indicator by selecting it from the ext source.
- External Indicator should be already imported to the chart and it have an plot function to output its signal
EXPORTING SIGNAL
- You can export your result to an already defined strategy template such as Pine coders, Benson, Daveatt Strategy templates
- Or you can define your custom export for other future strategy templates
ALERTS
- By enabling show alerts checkbox, you can see long entry exits on the bottom, and short entry exits aon the top of the chart
ADDITIONAL INFO
- You can see all off the inputs descriptions in the tooltips. (You can also see the previous version for details)
- Availability to set start, end dates
- Minimize repainting by using security function options (Secure, Semi Secure, Repaint)
- Availability of use timeframes
-
Version 3 INDICATORS LIST (More to be added):
▼▼▼ OVERLAY INDICATORS ▼▼▼
alma(src,len,offset=0.85,sigma=6).-------Arnaud Legoux Moving Average
ama(src,len,fast=14,slow=100).-----------Adjusted Moving Average
accdist().-------------------------------Accumulation/distribution index.
cma(src,len).----------------------------Corrective Moving average
dema(src,len).---------------------------Double EMA (Same as EMA with 2 factor)
ema(src,len).----------------------------Exponential Moving Average
gmma(src,len).---------------------------Geometric Mean Moving Average
highest(src,len).------------------------Highest value for a given number of bars back.
hl2ma(src,len).--------------------------higest lowest moving average
hma(src,len).----------------------------Hull Moving Average.
lagAdapt(src,len,perclen=5,fperc=50).----Ehlers Adaptive Laguerre filter
lagAdaptV(src,len,perclen=5,fperc=50).---Ehlers Adaptive Laguerre filter variation
laguerre(src,len).-----------------------Ehlers Laguerre filter
lesrcp(src,len).-------------------------lowest exponential esrcpanding moving line
lexp(src,len).---------------------------lowest exponential expanding moving line
linreg(src,len,loffset=1).---------------Linear regression
lowest(src,len).-------------------------Lovest value for a given number of bars back.
mcginley(src, len.-----------------------McGinley Dynamic adjusts for market speed shifts, which sets it apart from other moving averages, in addition to providing clear moving average lines
percntl(src,len).------------------------percentile nearest rank. Calculates percentile using method of Nearest Rank.
percntli(src,len).-----------------------percentile linear interpolation. Calculates percentile using method of linear interpolation between the two nearest ranks.
previous(src,len).-----------------------Previous n (len) value of the source
pivothigh(src,BarsLeft=len,BarsRight=2).-Previous pivot high. src=src, BarsLeft=len, BarsRight=p1=2
pivotlow(src,BarsLeft=len,BarsRight=2).--Previous pivot low. src=src, BarsLeft=len, BarsRight=p1=2
rema(src,len).---------------------------Range EMA (REMA)
rma(src,len).----------------------------Moving average used in RSI. It is the exponentially weighted moving average with alpha = 1 / length.
sar(start=len, inc=0.02, max=0.02).------Parabolic SAR (parabolic stop and reverse) is a method to find potential reversals in the market price direction of traded goods.start=len, inc=p1, max=p2. ex: sar(0.02, 0.02, 0.02)
sma(src,len).----------------------------Smoothed Moving Average
smma(src,len).---------------------------Smoothed Moving Average
super2(src,len).-------------------------Ehlers super smoother, 2 pole
super3(src,len).-------------------------Ehlers super smoother, 3 pole
supertrend(src,len,period=3).------------Supertrend indicator
swma(src,len).---------------------------Sine-Weighted Moving Average
tema(src,len).---------------------------Triple EMA (Same as EMA with 3 factor)
tma(src,len).----------------------------Triangular Moving Average
vida(src,len).---------------------------Variable Index Dynamic Average
vwma(src,len).---------------------------Volume Weigted Moving Average
volstop(src,len,atrfactor=2).------------Volatility Stop is a technical indicator that is used by traders to help place effective stop-losses. atrfactor=p1
wma(src,len).----------------------------Weigted Moving Average
vwap(src_).------------------------------Volume Weighted Average Price (VWAP) is used to measure the average price weighted by volume
▼▼▼ NON OVERLAY INDICATORS ▼▼
adx(dilen=len, adxlen=14, adxtype=0).----adx. The Average Directional Index (ADX) is a used to determine the strength of a trend. len=>dilen, p1=adxlen (default=14), p2=adxtype 0:ADX, 1:+DI, 2:-DI (def:0)
angle(src,len).--------------------------angle of the series (Use its Input as another indicator output)
aroon(len,dir=0).------------------------aroon indicator. Aroons major function is to identify new trends as they happen.p1 = dir: 0=mid (default), 1=upper, 2=lower
atr(src,len).----------------------------average true range. RMA of true range.
awesome(fast=len=5,slow=34,type=0).------Awesome Oscilator is an indicator used to measure market momentum. defaults : fast=len= 5, p1=slow=34, p2=type: 0=Awesome, 1=difference
bbr(src,len,mult=1).---------------------bollinger %%
bbw(src,len,mult=2).---------------------Bollinger Bands Width. The Bollinger Band Width is the difference between the upper and the lower Bollinger Bands divided by the middle band.
cci(src,len).----------------------------commodity channel index
cctbbo(src,len).-------------------------CCT Bollinger Band Oscilator
change(src,len).-------------------------A.K.A. Momentum. Difference between current value and previous, source - source . is most commonly referred to as a rate and measures the acceleration of the price and/or volume of a security
cmf(len=20).-----------------------------Chaikin Money Flow Indicator used to measure Money Flow Volume over a set period of time. Default use is len=20
cmo(src,len).----------------------------Chande Momentum Oscillator. Calculates the difference between the sum of recent gains and the sum of recent losses and then divides the result by the sum of all price movement over the same period.
cog(src,len).----------------------------The cog (center of gravity) is an indicator based on statistics and the Fibonacci golden ratio.
copcurve(src,len).-----------------------Coppock Curve. was originally developed by Edwin Sedge Coppock (Barrons Magazine, October 1962).
correl(src,len).-------------------------Correlation coefficient. Describes the degree to which two series tend to deviate from their ta.sma values.
count(src,len).--------------------------green avg - red avg
cti(src,len).----------------------------Ehler s Correlation Trend Indicator by
dev(src,len).----------------------------ta.dev() Measure of difference between the series and its ta.sma
dpo(len).--------------------------------Detrended Price OScilator is used to remove trend from price.
efi(len).--------------------------------Elders Force Index (EFI) measures the power behind a price movement using price and volume.
eom(len=14,div=10000).-------------------Ease of Movement.It is designed to measure the relationship between price and volume.p1 = div: 10000= (default)
falling(src,len).------------------------ta.falling() Test if the `source` series is now falling for `length` bars long. (Use its Input as another indicator output)
fisher(len).-----------------------------Fisher Transform is a technical indicator that converts price to Gaussian normal distribution and signals when prices move significantly by referencing recent price data
histvol(len).----------------------------Historical volatility is a statistical measure used to analyze the general dispersion of security or market index returns for a specified period of time.
kcr(src,len,mult=2).---------------------Keltner Channels Range
kcw(src,len,mult=2).---------------------ta.kcw(). Keltner Channels Width. The Keltner Channels Width is the difference between the upper and the lower Keltner Channels divided by the middle channel.
klinger(type=len).-----------------------Klinger oscillator aims to identify money flow’s long-term trend. type=len: 0:Oscilator 1:signal
macd(src,len).---------------------------MACD (Moving Average Convergence/Divergence)
mfi(src,len).----------------------------Money Flow Index s a tool used for measuring buying and selling pressure
msi(len=10).-----------------------------Mass Index (def=10) is used to examine the differences between high and low stock prices over a specific period of time
nvi().-----------------------------------Negative Volume Index
obv().-----------------------------------On Balance Volume
pvi().-----------------------------------Positive Volume Index
pvt().-----------------------------------Price Volume Trend
ranges(src,upper=len, lower=-5).---------ranges of the source. src=src, upper=len, v1:lower=upper . returns: -1 source=upper otherwise 0
rising(src,len).-------------------------ta.rising() Test if the `source` series is now rising for `length` bars long. (Use its Input as another indicator output)
roc(src,len).----------------------------Rate of Change
rsi(src,len).----------------------------Relative strength Index
rvi(src,len).----------------------------The Relative Volatility Index (RVI) is calculated much like the RSI, although it uses high and low price standard deviation instead of the RSI’s method of absolute change in price.
smi_osc(src,len,fast=5, slow=34).--------smi Oscillator
smi_sig(src,len,fast=5, slow=34).--------smi Signal
stc(src,len,fast=23,slow=50).------------Schaff Trend Cycle (STC) detects up and down trends long before the MACD. Code imported from
stdev(src,len).--------------------------Standart deviation
trix(src,len) .--------------------------the rate of change of a triple exponentially smoothed moving average.
tsi(src,len).----------------------------The True Strength Index indicator is a momentum oscillator designed to detect, confirm or visualize the strength of a trend.
ultimateOsc(len.-------------------------Ultimate Oscillator indicator (UO) indicator is a technical analysis tool used to measure momentum across three varying timeframes
variance(src,len).-----------------------ta.variance(). Variance is the expectation of the squared deviation of a series from its mean (ta.sma), and it informally measures how far a set of numbers are spread out from their mean.
willprc(src,len).------------------------Williams %R
wad().-----------------------------------Williams Accumulation/Distribution.
wvad().----------------------------------Williams Variable Accumulation/Distribution.
HISTORY
v3.01
ADD: 23 new indicators added to indicators list from the library. Current Total number of Indicators are 93. (to be continued to adding)
ADD: 2 more Parameters (P1,P2) for indicator calculation added. Par:(Use Defaults) uses only indicator(Source, Length) with library's default parameters. Par:(Use Extra Parameters P1,P2) use indicator(Source,Length,p1,p2) with additional parameters if indicator needs.
ADD: log calculation (simple, log10) option added on indicator function entries
ADD: New Output Signals added for compatibility on exporting condition signals to different Strategy templates.
ADD: Alerts Added according to conditions results
UPD: Indicator source inputs now display with indicators descriptions
UPD: Most off the source code rearranged and some functions moved to the new library. Now system work like a little bit frontend/backend
UPD: Performance improvement made on factorization and other source code
UPD: Input GUI rearranged
UPD: Tooltips corrected
REM: Extended indicators removed
UPD: IND1-IND4 added to indicator data source. Now it is possible to create new indicators with the previously defined indicators value. ex: IND1=ema(close,14) and IND2=rsi(IND1,20) means IND2=rsi(ema(close,14),20)
UPD: Custom Indicator (CUST) added to indicator data source and Combination Indicator source.
UPD: Volume added to indicator data source and Combination Indicator source.
REM: Custom indicators removed and only one custom indicator left
REM: Plot Type "Org. Range (-1,1)" removed
UPD: angle, rising, falling type operators moved to indicator library

Market Breadth EMAsThis is the combined market breadth tickers: S5TW, S5FI, S5OH, and S5TH representing the percentage of S&P 500 stocks above their 20, 50, 100, and 200 EMA respectively. The colors go from green (20) to red (200) because if 20 crosses above the 200, the market's bullish, and if the 20 crosses below the 200, the market is bearish. So if green is on top = bull market. If red is on top = bear market. In general the market sentiment is whichever color is highest up.
The background is colored in depending on a few historical extremes in the 200. The darker the color the more significant the buy/sell signal. These can be adjusted by changing the hline's in the code.

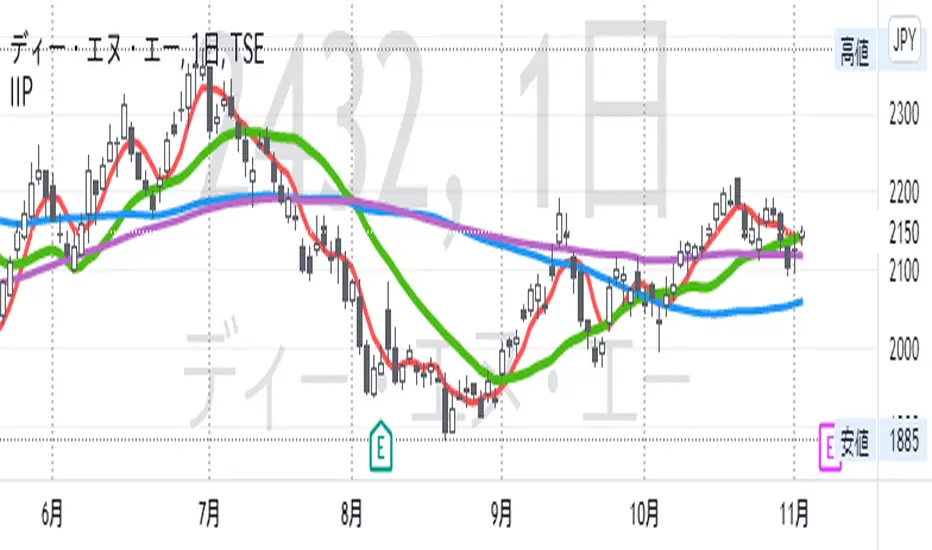
IIPThis indicator includes followings functions,
1. Close and SMA
Show 8 SMA (default: 3, 5, 7, 9, 20, 100, 300: each can be adjustable.)
2. Background color in Perfect Order (5, 20 ,60)
Perfect Order: Red
Reverse Perfect Order: Blue
3. Golden Cross and Dead Cross between SMA 5 and SMA 20
Golden Cross(GC):▲ with Green
Dead Cross(DC):▼ with Red
4. Show labels on 5 days, 20 days, 60 days and 100 days before today
5. Put dotted vertical line on first day in every month.
Chanu Delta IndicatorThe Chanu Delta Indicator was created as the price difference between the two markets using the principle that the Bitcoin price fluctuations in the BTCUSD market on the BYBIT exchange are greater in the BTCUSDT market. This indicator shows the strength of the current market's buys and sells, and helps in short-term trading.
Chanu Delta Indicator (Δ) = BTCUSD ($) - BTCUSDT ($) (Unit: Dollar, Source: Close)
● Δ > 100 : Strong Buy
● 20 < Δ < 100 : Buy
● -20 < Δ < 20 : Neutral
● -100 < Δ < -20 : Sell
● Δ < -100 : Strong Sell

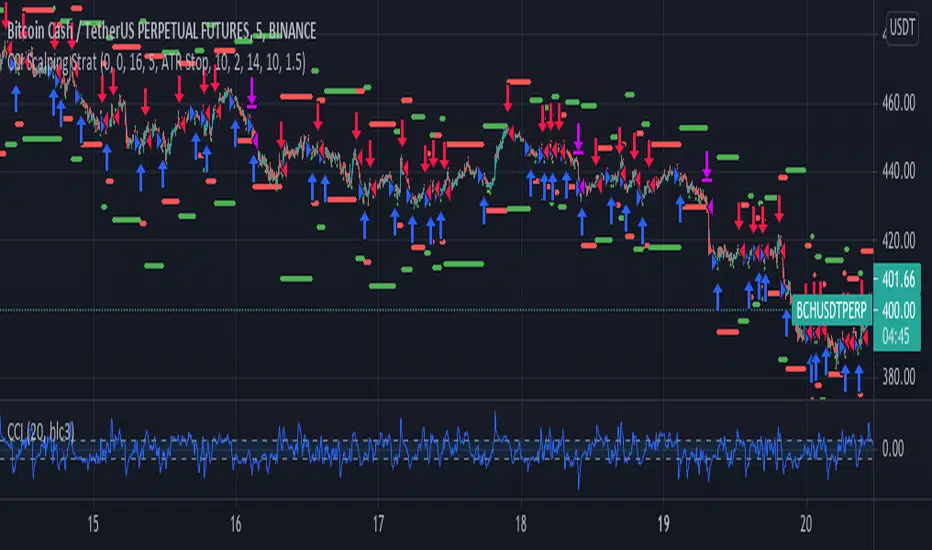
CCI Scalping Strategy---From the "Bitcoin Trading Strategies" book, by David Hanson---
After testing, works better with an ATR stop instead of the Strategy Stop. This parameter
can be changed from the strategy Inputs panel.
"CCI Scalping Strategy
Recommended Timeframe: 5 minutes
Indicators: 20 Period CCI, 20 WMA
Long when: Price closes above 20 WMA and CCI is below -100, enter when CCI crosses above -100.
Stop: Above 20 WMA"
Technical Analysis Consulting Table (TACT)Inspired by Tradingview's own "Technical Analysis Summary", I present to you a table with analogous logic.
You can track any ticker you want, no matter your chart. You can even have multiple tables to track multiple tickers. By default it tracks the Total Crypto Cap.
You can change the resolution you want to track. By default it is the same as the chart.
You can position the table to whichever corner of the chart you want. By default it draws in the bottom right corner.
Background colors and text size can be adjusted.
Indicators Used:
Oscillators
RSI(14)
STOCH(14, 3, 3)
CCI(20)
ADX(14)
AO
Momentum(10)
MACD(12, 26)
STOCH RSI(3, 3, 14, 14)
%R(14)
Bull Bear Power
UO(7,14,28)
Moving Averages
EMA(5)
SMA(5)
EMA(10)
SMA(10)
EMA(20)
SMA(20)
EMA(30)
SMA(30)
EMA(50)
SMA(50)
EMA(100)
SMA(100)
EMA(200)
SMA(200)
Ichimoku Cloud(9, 26, 52, 26)
VMWA(20)
HMA(9)
Pivots
Traditional
Fibonacci
Camarilla
Woodie
WARNING: I have observed up to a couple of seconds of signal jitter/delay, so use it with caution in very small resolutions (1s to 1m).
I hope you enjoy this and good luck with your trading. Suggestions and feedback are most welcome.

CPR, Camarilla & Moving AverageThis script is created primarily for Intraday trading but can also be used for short and long term trading. This is a combination of Central Pivot Range (CPR), Moving Averages and Camarilla Pivot levels (with inner levels). This helps you to combine the strategies of CPR and Moving Averages to identify the best trading opportunities with greater edge. Central Pivot Range and Camarilla pivots are taken from PivotBoss by Franc Ochoa.
Key features:
# Daily CPR levels
# Weekly CPR levels
# Monthly CPR levels
# Previous Day High and Lows
# Previous Week Highs and Lows
# Previous Month Highs and Lows
# Camarilla Pivots with inner Levels
# CPR Levels for the next Day, Week and Month
# 5 Simple moving averages and 5 Exponential Moving Averages
What separates this script from other scripts with CPR and Moving averages?
# One of the few indicators (if not the only one) which combines the 2 types of Moving Averages, CPR and also Camarilla Pivots.
# CPR Levels for not just the next Day, but for next Week(Weekly CPR) and Month(Monthly CPR) also.
# Hide the previous day's levels according to your wish. This is the most unique feature of this indicator. You can set the number of Daily CPR levels you want to load in the chart. This is not just for the Daily CPR but also for the Weekly and Monthly CPR also. This makes the chart less cluttered and prevents the candles from getting buried in the indicators. Please notice how the previous day's CPR levels are hidden in the displayed demo chart on the script page. In the chart, only one trading day's data is shown(by default).
# This script is OPEN SOURCE.
Strategies :
For CPR & Camarilla Strategies for intraday trading and swing trading refer to the book 'Secrets of a Pivot Boss: Revealing Proven Methods for Profiting in the Market' by Franklin O. Ochoa.
Moving averages strategies :
Moving averages can be combined and also used individually for several strategies
* 9 EMA can be used as trailing stop loss for strong moving trends that helps you to catch big moves.
* 20sma can be used not just trailing stop loss but also for taking re-entry to the trend.
* Golden cross - The golden cross occurs when a short-term moving average crosses over a major long-term moving average to the upside. This indicates a bullish turn in the market. Eg: 50 SMA cuts 200 SMA from below.
* Death Cross - The death cross occurs when the short term moving average crosses the long-term average from above. This indicates a bearish turn in the market. Eg: 50 SMA cuts 200 SMA from above.
* When 20 SMA is above 50 SMA and 20 SMA and 50 SMA are angling up like parallel lines, then it denotes bullish strength. If this happens right after Golden Cross, big moves to the upside can be expected.
* When 20 SMA is below 50 SMA and 20 SMA and 50 SMA are angling down like parallel lines, then it denotes bearish strength. If this happens right after Death Cross, big moves to the downside can be expected.
* When 20SMA and 50 SMA are going flat and crossing each other, then it denotes sideways sentiment.
Moving average strategies are taken from the book 'How to Make Money in Intraday Trading' by Ashwani Gujral. For learning more about how to combine CPR and Moving averages in your trading please refer to this book.

CT Moving Average Crossover IndicatorMoving Average Crossover Indicator
Here I present a moving average indicator with 9 user definable moving averages from which up to 5 pairs can be selected to show what prices would need to be closed at on the current bar to cross each individual pair.
I have put much emphasis here on simplicity of setting the parameters of the moving averages, selecting the crossover pairs and on the clarity of the displayed information in the optional “Moving Average Crossover Level” Information Box.
What Is a Moving Average (MA)?
According to Investopedia - “In statistics, a moving average is a calculation used to analyze data points by creating a series of averages of different subsets of the full data set.
In finance, a moving average (MA) is a stock indicator that is commonly used in technical analysis. The reason for calculating the moving average of a stock is to help smooth out the price data by creating a constantly updated average price.
By calculating the moving average, the impacts of random, short-term fluctuations on the price of a stock over a specified time-frame are mitigated.”
The user can set the color, type (SMA/EMA) and length of each of the 9 moving averages.
Then the user may choose 5 pairs of moving averages from the set of 9.
The script will then calculate the price needed to be crossed by the close of the current bar in order to crossover each of the user defined pairs and outputs the results as optional lineplots and/or an Infobox which shows the relevant information in a very clear way.
The user may switch the moving averages, crossover lineplots and infobox on and off easily with one click boxes in the settings menu.
The number of decimal places shown in the Infobox can be altered in the settings menu.
If the price required to cross a pair of moving averages is zero or less, the crossover level will display “Impossible” and the plots will plot at zero. (this helps ameliorate chart auto-focus issues)
Quoting a variety of online resources …….
Understanding Moving Averages (MA)
Moving averages are a simple, technical analysis tool. Moving averages are usually calculated to identify the trend direction of a stock or to determine its support and resistance levels. It is a trend-following—or lagging—indicator because it is based on past prices.
The longer the time period for the moving average, the greater the lag. So, a 200-day moving average will have a much greater degree of lag than a 20-day MA because it contains prices for the past 200 days. The 50-day and 200-day moving average figures for stocks are widely followed by investors and traders and are considered to be important trading signals.
Moving averages are a totally customizable indicator, which means that an investor can freely choose whatever time frame they want when calculating an average. The most common time periods used in moving averages are 15, 20, 30, 50, 100, and 200 days. The shorter the time span used to create the average, the more sensitive it will be to price changes. The longer the time span, the less sensitive the average will be.
Investors may choose different time periods of varying lengths to calculate moving averages based on their trading objectives. Shorter moving averages are typically used for short-term trading, while longer-term moving averages are more suited for long-term investors.
There is no correct time frame to use when setting up your moving averages. The best way to figure out which one works best for you is to experiment with a number of different time periods until you find one that fits your strategy.
Predicting trends in the stock market is no simple process. While it is impossible to predict the future movement of a specific stock, using technical analysis and research can help you make better predictions.
A rising moving average indicates that the security is in an uptrend, while a declining moving average indicates that it is in a downtrend. Similarly, upward momentum is confirmed with a bullish crossover, which occurs when a short-term moving average crosses above a longer-term moving average. Conversely, downward momentum is confirmed with a bearish crossover, which occurs when a short-term moving average crosses below a longer-term moving average.
Types of Moving Averages
Simple Moving Average (SMA)
The simplest form of a moving average, known as a simple moving average (SMA), is calculated by taking the arithmetic mean of a given set of values. In other words, a set of numbers–or prices in the case of financial instruments–are added together and then divided by the number of prices in the set.
Exponential Moving Average (EMA)
The exponential moving average is a type of moving average that gives more weight to recent prices in an attempt to make it more responsive to new information.
To calculate an EMA, you must first compute the simple moving average (SMA) over a particular time period. Next, you must calculate the multiplier for weighting the EMA (referred to as the "smoothing factor"), which typically follows the formula: 2/(selected time period + 1). So, for a 20-day moving average, the multiplier would be 2/(20+1)= 0.0952. Then you use the smoothing factor combined with the previous EMA to arrive at the current value.
The EMA thus gives a higher weighting to recent prices, while the SMA assigns equal weighting to all values.

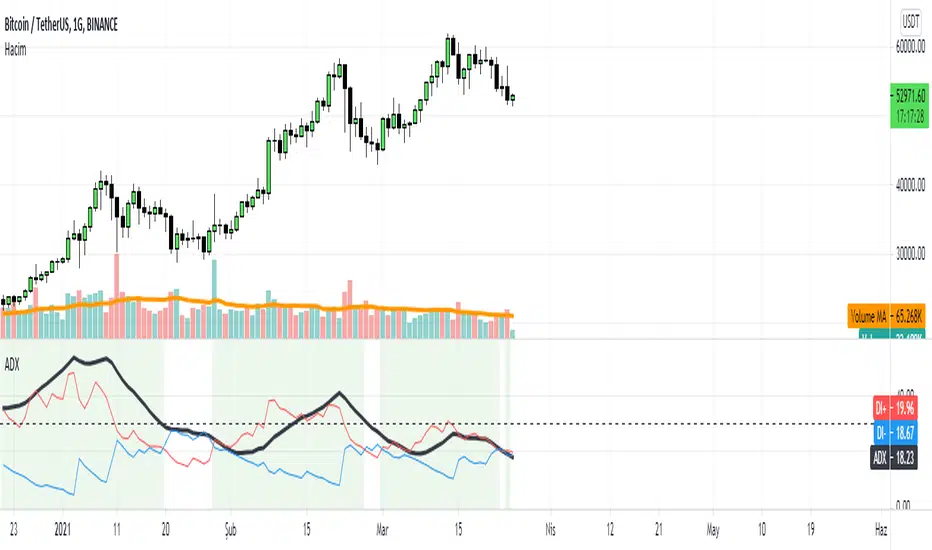
ADX with SignalsThis indicator basicly usind ADX ( Average Directional Index )
ADX can show us how trend is strong
ADX below 20: the market is currently not trending
ADX crosses above 20: signifies that a new trend is emerging. Traders may start placing sell or buy orders in the direction of the price movement.
ADX between 20 and 40: When the ADX is growing between 20 and 40 it is considered as a confirmation of an emerging trend. Traders should use this opportunity to buy or short sell in the trend's direction.
ADX above 40: the trend is very strong.
ADX crosses 50: the trend is extremely strong.
ADX crosses 70: a very rare occasion, which is called a “Power Trend.”
If we use ADX with DI+ and DI+ indactor can tell us to buy.
How can we calculate this all?
Directional Movement (DI) is defined as the largest part of the current period’s price range that lies outside the previous period’s price range. For each period calculate:
+DI = positive or plus DI = High - Previous High
-DI = negative or minus DI = Previous Low - Low
The smaller of the two values is reset to zero, i.e., if +DI > -DI , then -DI = 0. On an inside bar (a lower high and higher low), both +DI and -DI are negative values, so both get reset to zero as there was no directional movement for that period.
The True Range ( TR ) is calculated for each period, where:
TR = Max of ( High - Low ), ( High -PreviousClose ), ( PreviousClose - Low )
The +DI , -DI and TR are each accumulated and smoothed using a custom smoothing method proposed by Wilder. For an n period smoothing, 1/n of each period’s value is added to the total each period, similar to an exponential smoothing:
+DIt = (+DIt-1 - (+DIt-1 / n)) + (+DIt)
-DIt = (-DIt-1 - (-DIt-1 / n)) + (-DIt)
TRt = (TRt-1 - (TRt-1 / n)) + ( TRt )
Compute the positive/negative Directional Indexes, +DI and -DI , as a percentage of the True Range:
+DI = ( +DI / TR ) * 100
-DI = ( -DI / TR ) * 100
Compute the Directional Difference as the absolute value of the differences: DIdiff = | (( +DI ) - ( -DI )) |
Sum the directional indicator values: DIsum = (( +DI ) + ( -DI )) .
Calculate the Directional Movement index: DX = ( DIdiff / DIsum ) * 100 . The DX is always between 0 and 100.
Finally, apply Wilder’s smoothing technique to produce the final ADX value:
ADXt = ( ( ADXt-1 * ( n - 1) ) + DXt ) / n
When indicator tell us to buy?
If when DI+ crosses DI- and ADX is bigger than DI- indicator tell us to buy.
KAMA Strategy - Kaufman's Adaptive Moving AverageThis strategy combines Kaufman's Adaptive Moving Average for entry with optional KAMA, PSAR, and Trailing ATR stops for exits.
Kaufman's Adaptive Moving Average is, in my opinion, a gem among the plethora of indicators. It is underrated considering it offers a solution that intuitively makes a lot of sense. When I first read about it, it was a real 'aha!' moment. Look at the top, pink line. Notice how during trending times it follows the trend quickly and closely, but during choppy, non-trending periods, the KAMA stays absolutely flat? Interesting! To trade with it, we simply follow the direction the KAMA is pointing. Is it up? Go long. Is it down? Go short. Is it flat? Hold on.
How does it manage to quickly follow real trends like a fast EMA but ignore choppy conditions that would whipsaw a fast EMA back and forth? It analyses whether recent price moves are significant relative to recent noise and then adapts the length of the EMA window accordingly. If price movement is big compared to the recent noise, the EMA window gets smaller. If price movement is relatively small or average compared to the recent noise, the EMA window gets bigger. In practice it means:
The KAMA would be flat if a 20 point upwards move occurred during a period that has had, on average, regular 20 point moves BUT
the KAMA would point up if a 20 point move occurred during a period that has, on average, had moves of only around 5 points.
In other words, it's a slow EMA during choppy flat / quiet flat periods, and a fast EMA as soon as significant volatility occurs. Perfect!
-----
The Strategy
The strategy is more than just a KAMA indicator. It contains:
KAMA exit (optional)
ATR trailing stop loss exit (optional)
PSAR stop loss exit (optional)
KAMA filter for entry and exits
All features are adjustable in the strategy settings
The Technical Details:
Check out the strategy's 'Inputs' panel. The buy and sell signals are based on the 'KAMA 1' there.
KAMA 1: Length -- 14 is the default. This is the length of the window the KAMA looks back over. In this instance, it c
KAMA 1: Fast KAMA Length -- 2 is the default. This is the tightest the EMA length is allowed to get. It will tend towards this length when volatility is high.
KAMA 1: Slow KAMA Length -- 20 is the default. This is the biggest the EMA length is allowed to get. It will tend towards this length when volatility is low.
KAMA Filter
The strategy buys when the KAMA begins to point up and sells when the KAMA points down. Generally, the KAMA is very good at filtering out the noise itself - it will go flat during noisy/choppy periods. But to add another layer of safety, its author, Perry Kaufman, proposed a KAMA filter. It works by taking the standard deviation of returns over the length of the the 'KAMA 1: Length' I mentioned above and multiplying it by an 'Entry Filter' (1 by default) and 'Exit Filter' (0.5 by default). The entry condition to go long is that the KAMA is pointing up and and it moved up more than 1 x St. Dev. of Returns. The exit condition is when the KAMA is pointing down and it moved down by more than 0.5 x St. Dev. of Returns.
Thanks
Thanks to ChuckBanger, cheatcountry, millerrh, and racer8 for parts of the code. I was able to build upon their good work.
-----
I hope this strategy is helpful to you.
Do you have any thoughts, ideas, or questions? Let me know in the comments or send me a message! I'd be glad to help you out.
If you need an indicator or strategy to be built or customised for you, let me know! I'll be glad to help and it'll probably be cheaper than you think!

Donchian DipThe Donchian Dip
This strategy is designed to look for good "Buy the Dip" entries on stocks that are clearly in a strong 1-year upward trend. If you do not know how to identify those stocks on your own please do not use this system or continue your education until you do. The Donchian Dip strategy was designed on the daily time frame but works amazingly well on both daily and weekly timeframes. It does still work on intraday charts also if the current trend on the daily chart is in a strong uptrend.
Chart Setup:
3-period Donchian Channel with a 1-period offset (hide basis)
Bollinger Bands with the default settings of 20/2 (display basis)
Entry Signals:
There are 3 different entry signals that will be printed on the chart that have similar underlying criteria but are ranked based on skill level just like ski slope skill levels! I recommend only taking green entries until you are familiar with the system and the stocks you are trading.
Green Easy Entry:
This is the safest buy the dip entry that is normally found at or near a large retracement bottom. You might get one or two bad entries but be persistent and eventually, a great entry will present itself!
These are the specifics for the conditions that trigger a Green entry if you want to know what they are:
1. The current bar is an up bar (green or white bar) and closed above the lower Donchian channel
2. Previous bar or 2 bars back closed below the lower Donchian channel
3. Previous bar or 2 bars back closed below the Bollinger Band Basis (20 SMA )
4. The low of the previous bar or 2 bars back was below the lower Bollinger Band
Blue Intermediate Entry:
This is a decent entry if you missed the green entry, want to add to an existing position, or are not sure it will pull back far enough to even give a green entry. I would suggest only trade these entries to add to an existing pyramid position or get back into a trade that you were recently stopped out of. However, on high-flying stocks like TSLA these signals and the Black Diamond entry signals might be the only ones you get for a long time. Also, on the weekly chart, Blue or Black entries are sometimes all you will get for a year or more.
These are the specifics for the conditions that trigger a Blue entry if you want to know what they are:
1. The current bar is an up bar (green or white bar) and closed above the lower Donchian channel
2. Previous bar or 2 bars back closed below the lower Donchian channel
3. Previous bar or 2 bars back closed below the Bollinger Band Basis (20 SMA )
Black Diamond Advanced Rule:
This is normally just a small pullback re-entry signal on a strong trending stock like TSLA ...trade with extreme caution!!! You have been warned but daredevils feel free to give it a shot. I sometimes do trade these entries if the market and sector of the stock I am trading are extremely bullish or if I am looking to add to a position but I use a conservative stop.
These are the specifics for the conditions that trigger a Black entry if you want to know what they are:
1. The current bar is an up bar (green or white bar) and closed above the lower Donchian channel
2. Previous bar or 2 bars back closed below the lower Donchian channel
3. Previous bar or 2 bars back closed above the Bollinger Band Basis (20 SMA )
Exit Criteria:
The goal of this strategy is to buy the dip and hold as long as possible...let's practice some Paytience and exercise those holding muscles! RLT!!!
So, we don't want to exit early but we also want to protect our profits somehow. We do this by using the built-in trailing stops that are defined by dots of three different shades of purple on the chart (feel free to change these in the settings). Simply move your trailing stop to the highest current dot price level. Do not move the trailing stop down ever even if a lower dot is printed later. These are simply the suggested trailing stops and definitely use your own judgment for exits but if you backtest this strategy enough you will most likely discover that in the long run, these trailing stops work really well.
I hope this strategy helps you to identify good "Buy the Dip" entries on stocks you love as well as trains you to hold your winners longer for bigger gains.
***HOW TO ADD TO YOUR CHARTS***
1) Click the "Add to Favorite Scripts" button
2) Go to a stock chart and click the "Indicators" icon at the top
3) Next, on the left, click the "Favorites" and then click the "Naked Put - Growth Indicator v2"
4) It should appear on your charts, and you can click the "gear" icon on the study to edit a few settings.
5) Read the release notes above so you understand how it works.

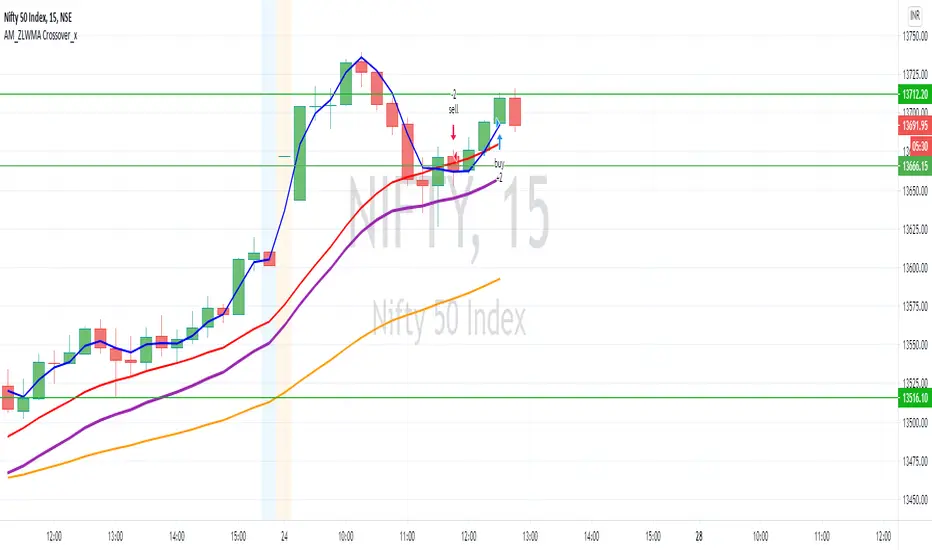
AM_ZLWMA Crossover_xDear All,
Please find updated version of Zero lag WMA crossover. In addition to this added 20/50 EMA to get better results.
Settings:
ZLWMA = 8 identified by Blue line
Fast WMA = 21 identified by Red line
EMA Period 20/50
How to Trade:
Buy: Wait for positive crossover (Blue cross above Red) to happen trade can be taken there but to get better results post crossover once price move above EMA 20 then buy can be initiated.
Sell: Wait for negative crossover (Blue cross below Red) to happen trade can be taken there but to get better results post crossover once price move below EMA 20 then sell can be initiated.
Reason to wait for confirmation of price action above / Below moving average is most of the time it happens that even after crossover happens sometimes it was just a pull back and from there it could be a possibility for reversal. Once price action confirms moving above / below EMA20 then trade will be initiated.
Please comment and ask for any doubt
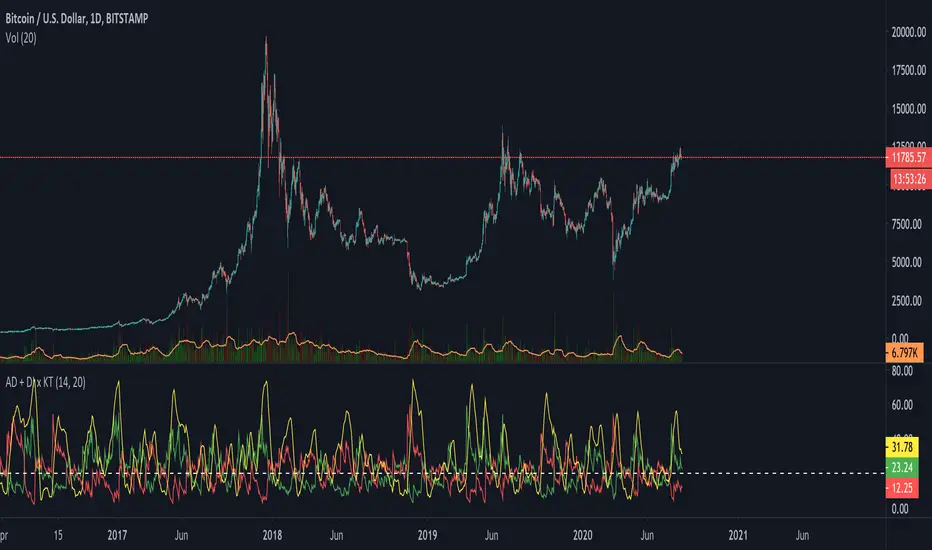
DMI-ADX HistogramThe Average Direction Index (ADX) coupled with the Direction Movement Index (DMI), developed by J. Welles Wilder, is a popular indicator that measures trend direction and strength.
The AX line (blue) is used to show the strength of the current trend. It does not tell you the trend direction. The under laid histogram shows relative movements of the price with green showing positive momentum and red showing negative momentum. Use these ADX and DMI together to find trend strength and direction.
- ADX line below 20 indicates that the underlying is in accumulation/distribution.
- ADX line above 20 mean that the underlying is trending with over 60 being very strong.
*When the ADX line is below 20 it is likely to see many reversal signals on the DMI Histogram. It is best to use the DMI signals when the ADX line is above 20 or higher. This is also a good level to play around with.
Motivation
Normally the direction movements are plotted as lines with the DI+ being green and the DI- being red. When the DI+ (green) crosses over DI- (red) this may indicate a buy signal, and vice versa. I found this visual representation made it difficult to see signals as well as lacked the ability to easy see the relative strength of other moves.
I have also noticed that the histogram values will periodically cross the ADX line, but not for very long periods. This could be a useful signal to explore further in the future.
In this image the top indicator is using the normal DI+/- lines, where the bottom indicator is using an absolute histogram.

angle bar colors [LM]Hello guys,
I would like to introduce you angle bar colors indicator. It colors bars depending the angle of the bar x length back and current one
lime angle > 70 degrees
green 20 < angle < 70 degrees
orange 0 > angle <= 20 degrees
purple 0 > angle >= -20 degrees
red -20 > angle > -70 degrees
maroon angle < -70 degrees
Any suggestions are welcome
ADX + DI x Upgraded to Pine v4 x KingThiesAverage Directional Movement Index
Momentum based tool to measure trend strength on scale of 1-100
Similar to the aroon but incorporates a 3rd measure, while aroon uses two
The majority of these calculations were pre-existing in older pine scripts but have since been updated
signals are given when -DI and +DI cross, ADX illustrates corresponding strength at time of cross
Full Intro
ADX can help investors to identify trend strengths, as di - di determines the trend direction, while d - d is an impulse indicator. If the ADX is below 20, it can be considered impulsive, while it is above 25 on a trend line.
A trading signal can be generated when the di - DI line is switched to d - d and vice versa. If the di-line crosses and the ADX is above 20 (ideally 25), a potential buy signal could ebb away.
If the ADX is above 20, there is the possibility of potential short selling if the DI crosses over DI. You can also use crosses to get out of the current deal if you need it for a long time.
If the di-line is crossed and the Adx is below 20 (or 25), there may be opportunities to enter the potential for short trading, but only if di are above or below DI or if the price is trendy and may not prove to be the ideal time to start trading.
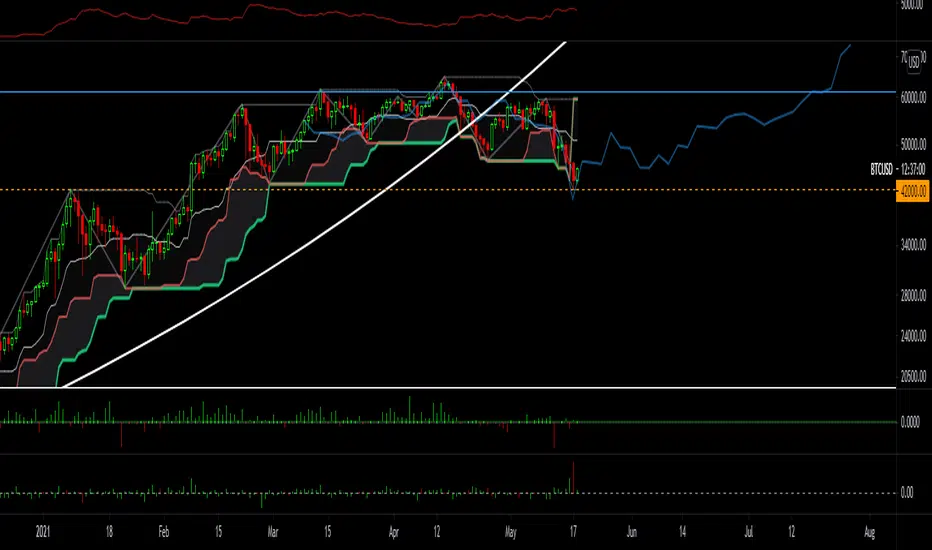
Weeknights Donchian CloudDonchian Channel Trading system visualised as a cloud.
Regular/Quick inputs;
Length: 20
Entry Length: 20
Stop Length: 10
Alternate/Slower Inputs;
Length: 55
Entry Length: 55
Stop Length: 20
For a more in-depth review, look up "Turtle Trading" rules
The simplest way to use the cloud;
-When the cloud flips from above to below (support), close any shorts and open a long
-When the cloud flips from below to above (resistance), close any longs and open a short
-Cloud is flipped based on a breakout on the high / low
-Most effectively used on the daily, but can be used on any time frame
-For traditional markets, an input of 20 is most commonly used
-For 24/7 markets, an input of 28 is most commonly used
-Find an input that makes the most sense to you!
I appreciate any feedback, feel free to message me on twitter / comment!
Twitter ; @ImWeeknight
Credit to user KivancOzbilgic for helping with the script