CalendarEurLibrary "CalendarEur"
This library provides date and time data of the important events on EUR. Data source is csv exported from www.fxstreet.com and transformed into perfered format by C# script.
HighImpactNews2015To2019()
EUR high impact news date and time from 2015 to 2019
HighImpactNews2020To2023()
EUR high impact news date and time from 2020 to 2023
Cerca negli script per "2015年黄金价格走势"
CalendarGbpLibrary "CalendarGbp"
This library provides date and time data of the important events on GBP. Data source is csv exported from www.fxstreet.com and transformed into perfered format by C# script.
HighImpactNews2015To2019()
GBP high impact news date and time from 2015 to 2019
HighImpactNews2020To2023()
GBP high impact news date and time from 2020 to 2023

CalendarJpyLibrary "CalendarJpy"
This library provides date and time data of the important events on JPY. Data source is csv exported from www.fxstreet.com and transformed into perfered format by C# script.
HighImpactNews2015To2023()
JPY high impact news date and time from 2015 to 2023
CalendarUsdLibrary "CalendarUsd"
This library provides date and time data of the important events on USD. Data source is csv exported from www.fxstreet.com and transformed into perfered format by C# script.
HighImpactNews2015To2019()
USD high impact news date and time from 2015 to 2019
HighImpactNews2020To2023()
USD high impact news date and time from 2020 to 2023

NewsEventsGbpLibrary "NewsEventsGbp"
This library provides date and time data of the high imact news events on GBP. Data source is csv exported from www.fxstreet.com and transformed into perfered format by C# script.
gbpNews2015To2019()
GBP high imact news date and time from 2015 to 2019
gbpNews2020To2023()
GBP high imact news date and time from 2020 to 2023

NewsEventsEurLibrary "NewsEventsEur"
This library provides date and time data of the high imact news events on EUR. Data source is csv exported from www.fxstreet.com and transformed into perfered format by C# script.
eurNews2015To2019()
EUR high imact news date and time from 2015 to 2019
eurNews2020To2023()
EUR high imact news date and time from 2020 to 2023

NewsEventsJpyLibrary "NewsEventsJpy"
This library provides date and time data of the high imact news events on JPY. Data source is csv exported from www.fxstreet.com and transformed into perfered format by C# script.
jpyNews2015To2023()
JPY high imact news date and time from 2015 to 2023

NewsEventsCadLibrary "NewsEventsCad"
This library provides date and time data of the high imact news events on CAD. Data source is csv exported from www.fxstreet.com and transformed into perfered format by C# script.
cadNews2015To2023()
CAD high imact news date and time from 2015 to 2023
NewsEventsUsdLibrary "NewsEventsUsd"
This library provides date and time data of the high imact news events on USD. Data source is csv exported from www.fxstreet.com and transformed into perfered format by C# script.
usdNews2015To2019()
USD high imact news date and time from 2015 to 2019
usdNews2020To2023()
USD high imact news date and time from 2020 to 2023
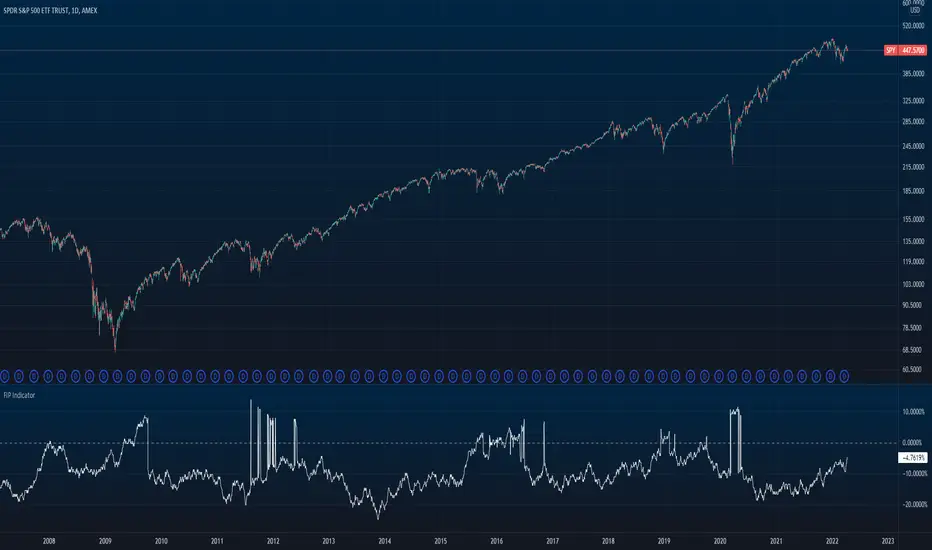
Price Distance RatioThis study plots the ratio between current price and the price N days ago.
With N input that is configurable, users can find optimal long/short entries when price is in an established trend and price has diverge far from a given local peak or all time high.
With many years of stock trading the analysis indicates a connection between the distance of price and subsequent returns.
Portfolios of stocks with lower price to local highes ratios generally underperformed portfolios of stocks with higher prices to peaks reached similar N days ago.
The highest returns to previous peak are recorded when buying at the biggest dip.
For example, the purchase at 20% drawdown could generate 25% when price returns to the peak. The purchase at 50% drawdown could generate bigger, i.e. 100% return, when price returns to the peak. And the purchase at 90% drawdown could generate much bigger, i.e. 900% return, in a case the price returns to the peak.
However, buying very far below local peaks on almost all holding periods produces lower CAGR returns because of "timing adjustment". In simple words, typically the drawdown takes less time vs. further recovery.
For example:
👉 The largest BTC drawdown in 2013-2015 took 410 days (Peak-to-Valley) . And the recovery of BTC to new highs took 771 days (Valley-to-Peak) after that.
👉 The 3rd longest drawdown in BTC took 363 days (observed from December 17, 2017 to December 15, 2018). And further recovery in BTC to its new high took almost two years - 716 days .
👉The 4th longest drawdown in BTC took 162 days (observed from June 08, 2011 to November 17, 2011). And further recovery in BTC to its new high took more than a year - 469 days .
The concept of this study could recognizes at least 4 different modes of action.
👉 In a clearly established upward trend traders should be buying (following the trend) when Ratio is above 100% and reducing the size when Ratio turns below 100%.
👉 Conversely, in a clearly established downward trend traders should be shorted when Ratio is below 100% and covering when the Ratio turns back to 100%.
👉 In a sideways movement traders are advised to wait carefully if the Ratio near 100% for a long time, and take a position the trend is clear.
👉 Chartists can analyze the dynamic of the indicator - both in terms of trends and overall level. For example as it shown at the chart.
The understading of the study and rules of "timing adjustments" could genarate the awesome opportunities for stock options traders also, with strategies of selling uncovered call options and vertical call spreads.
// Many thanks to @HPotter and @Wheeelman wizards for their continious support and assistance.

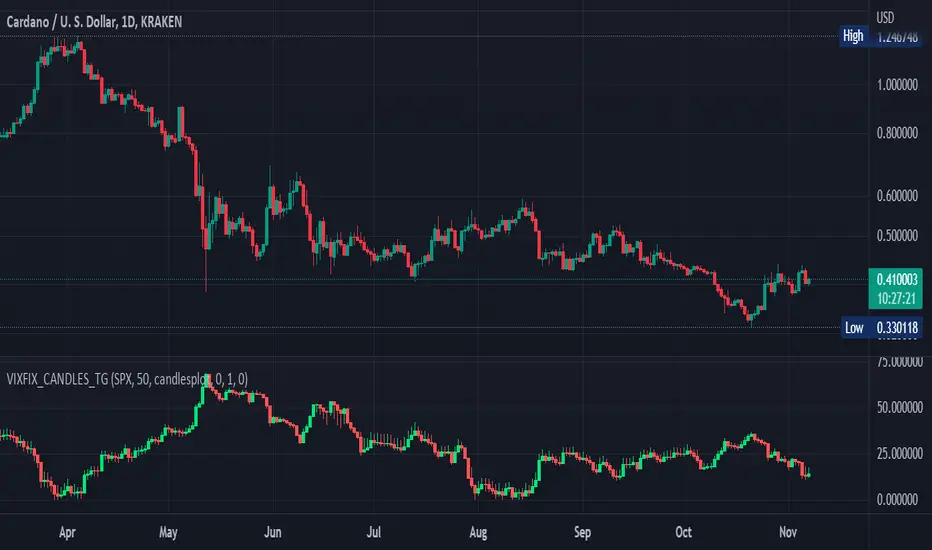
Williams Vix Fix OHLC candles plot indicator (Tartigradia)OHLC candles plot of the Williams VixFix indicator, which allows to draw trend lines.
Williams VixFix is a realized volatility indicator developed by Larry Williams, and can help in finding market bottoms.
Indeed, as Williams describe in his paper, markets tend to find the lowest prices during times of highest volatility, which usually accompany times of highest fear. The VixFix is calculated as how much the current low price statistically deviates from the maximum within a given look-back period.
The Williams VixFix indicator is usually presented as a curve or histogram. The novelty of this indicator is to present the data as a OHLC candles plot: whereas the original Williams VixFix calculation only involves the close value, we here use the open, high and low values as well. This led to some mathematical challenges because some of these calculations led to absurd values, so workarounds had to be found, but in the end I think the result was worth it, it reproduces the VIX chart quite well.
A great additional value of the OHLC chart is that it shows not just the close value, but all the values during the session: open, high and low in addition to close. This allows to draw trend lines and can provide additional information on momentum and sentiment. In addition, other indicators can be used on it, as if it was a price chart, such as RSI indicators (see RSI+ (alt) indicator for example).
For more information on the Vix Fix, which is a strategy published under public domain:
The VIX Fix, Larry Williams, Active Trader magazine, December 2007, web.archive.org
Fixing the VIX: An Indicator to Beat Fear, Amber Hestla-Barnhart, Journal of Technical Analysis, March 13, 2015, ssrn.com
Replicating the CBOE VIX using a synthetic volatility index trading algorithm, Dayne Cary and Gary van Vuuren, Cogent Economics & Finance, Volume 7, 2019, Issue 1, doi.org
This indicator includes only the Williams VixFix as an OHLC candles or bars plot, and price / vixfix candles plot, as well as the typical vixfix histogram. Indeed, it is much more practical for unbounded range indicators to be plotted in their own separate panel, hence why this indicator is released separately, so that it can work and be scaled adequately out of the box.
Note that the there are however no bottom buy signals. For a more complete indicator, which also includes the OHLC candles plots present here, but also bottom signals and Inverse VixFix (top signals), see:
Set Index symbol to SPX, and index_current = false, and timeframe Weekly, to reproduce the original VIX as close as possible by the VIXFIX (use the Add Symbol option, because you want to plot CBOE:VIX on the same timeframe as the current chart, which may include extended session / weekends). With the Weekly timeframe, off days / extended session days should not change much, but with lower timeframes this is important, because nights and weekends can change how the graph appears and seemingly make them different because of timing misalignment when in reality they are not when properly aligned.
Williams Vix Fix ultra complete indicator (Tartigradia)Williams VixFix is a realized volatility indicator developed by Larry Williams, and can help in finding market bottoms.
Indeed, as Williams describe in his paper, markets tend to find the lowest prices during times of highest volatility, which usually accompany times of highest fear. The VixFix is calculated as how much the current low price statistically deviates from the maximum within a given look-back period.
Although the VixFix originally only indicates market bottoms, its inverse may indicate market tops. As masa_crypto writes : "The inverse can be formulated by considering "how much the current high value statistically deviates from the minimum within a given look-back period." This transformation equates Vix_Fix_inverse. This indicator can be used for finding market tops, and therefore, is a good signal for a timing for taking a short position." However, in practice, the Inverse VixFix is much less reliable than the classical VixFix, but is nevertheless a good addition to get some additional context.
For more information on the Vix Fix, which is a strategy published under public domain:
* The VIX Fix, Larry Williams, Active Trader magazine, December 2007, web.archive.org
* Fixing the VIX: An Indicator to Beat Fear, Amber Hestla-Barnhart, Journal of Technical Analysis, March 13, 2015, ssrn.com
* Replicating the CBOE VIX using a synthetic volatility index trading algorithm, Dayne Cary and Gary van Vuuren, Cogent Economics & Finance, Volume 7, 2019, Issue 1, doi.org
Created By ChrisMoody on 12-26-2014...
V3 MAJOR Update on 1-05-2014
tista merged LazyBear's Black Dots filter in 2020:
Extended by Tartigradia in 10-2022:
* Can select a symbol different from current to calculate vixfix, allows to select SP:SPX to mimic the original VIX index.
* Inverse VixFix (from masa_crypto and web.archive.org)
* VixFix OHLC Bars plot
* Price / VixFix Candles plot (Pro Tip: draw trend lines to find good entry/exit points)
* Add ADX filtering, Minimaxis signals, Minimaxis filtering (from samgozman )
* Convert to pinescript v5
* Allow timeframe selection (MTF)
* Skip off days (more accurate reproduction of original VIX)
* Reorganized, cleaned up code, commented out parts, commented out or removed unused code (eg, some of the KC calculations)
* Changed default Bollinger Band settings to reduce false positives in crypto markets.
Set Index symbol to SPX, and index_current = false, and timeframe Weekly, to reproduce the original VIX as close as possible by the VIXFIX (use the Add Symbol option, because you want to plot CBOE:VIX on the same timeframe as the current chart, which may include extended session / weekends). With the Weekly timeframe, off days / extended session days should not change much, but with lower timeframes this is important, because nights and weekends can change how the graph appears and seemingly make them different because of timing misalignment when in reality they are not when properly aligned.

Bitcoin Golden Pi CyclesTops are signaled by the fast top MA crossing above the slow top MA, and bottoms are signaled by the slow bottom MA crossing above the fast bottom MA. Alerts can be set on top and bottom prints. Does not repaint.
Similar to the work of Philip Swift regarding the Bitcoin Pi Cycle Top, I’ve recently come across a similar mathematically curious ratio that corresponds to Bitcoin cycle bottoms. This ratio was extracted from skirmantas’ Bitcoin Super Cycle indicator . Cycle bottoms are signaled when the 700D SMA crosses above the 137D SMA (because this indicator is closed source, these moving averages were reverse-engineered). Such crossings have historically coincided with the January 2015 and December 2018 bottoms. Also, although yet to be confirmed as a bottom, a cross occurred June 19, 2022 (two days prior to this article)
The original pi cycle uses the doubled 350D SMA and the 111D SMA . As pointed out this gives the original pi cycle top ratio:
350/111 = 3.1532 ≈ π
Also, as noted by Swift, 111 is the best integer for dividing 350 to approximate π. What is mathematically interesting about skirmanta’s ratio?
700/138 = 5.1095
After playing around with this for a while I realized that 5.11 is very close to the product of the two most numerologically significant geometrical constants, π and the golden ratio, ϕ:
πϕ = 5.0832
However, 138 turns out to be the best integer denominator to approximate πϕ:
700/138 = 5.0725 ≈ πϕ
This is what I’ve dubbed the Bitcoin Golden Pi Bottom Ratio.
In the spirit of numerology I must mention that 137 does have some things going for it: it’s a prime number and is very famously almost exactly the reciprocal of the fine structure constant (α is within 0.03% of 1/137).
Now why 350 and 700 and not say 360 and 720? After all, 360 is obviously much more numerologically significant than 350, which is proven by the fact that 360 has its own wikipedia page, and 350 does not! Using 360/115 and 720/142, which are also approximations of π and πϕ respectively, this also calls cycle tops and bottoms.
There are infinitely many such ratios that could work to approximate π and πϕ (although there are a finite number whose daily moving averages are defined). Further analysis is needed to find the range(s) of numerators (the numerator determines the denominator when maintaining the ratio) that correctly produce bottom and top signals.

Frog in Pan IndicatorWhat is it?
This indicator is the percent of negative days minus the percent of positive days in a year multiplied by the sign of the overall return of the lookback (365 days for crypto and 252 days for stocks).
FIP = sign(return of lookback) *
What is it used for?
This indicator is used as a quality screener for momentum stocks. It is based behind the ideas in Wesley Gray & Jack Vogel's book: Quantitative Momentum: A Practitioner's Guide to Building a Momentum-Based Stock Selection System that iterates that quality momentum stocks consist of steady uptrends (where more days are positive rather than negative) as opposed to characteristics of "lottery-like" stocks that are "jumpy" and more volatile. More research behind this indicator can be found here
How to use
In the indicator settings, the default lookback parameter is set to 365 days for analysis on cryptocurrencies and was used on a daily timeframe. If you want to use this indicator on individual stocks, it is best to change this lookback to 252 days. The more negative the value is, the higher quality of momentum it is.
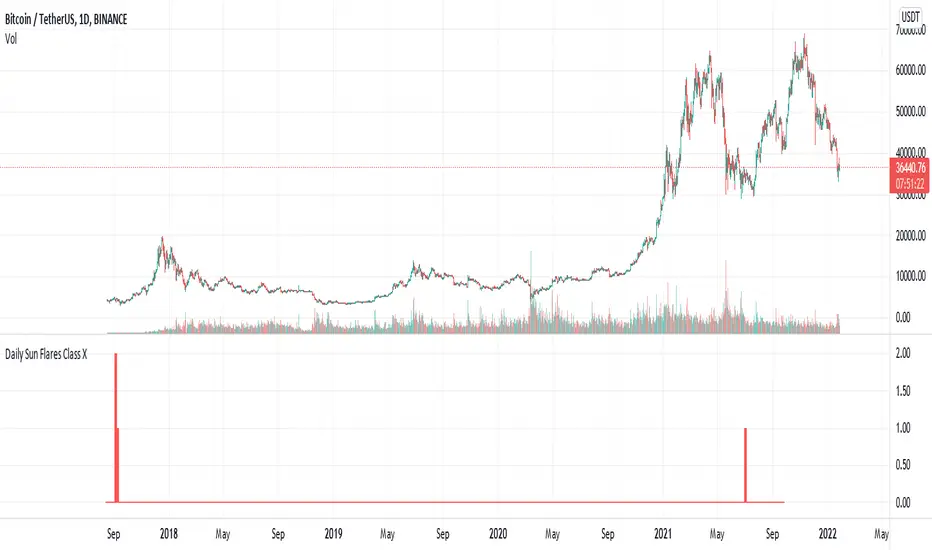
Daily Sun Flares Class XThe classification system for solar flares uses the letters A, B, C, M or X, according to the peak flux as measured at the Earth by the GOES spacecraft.
These are daily Class X sun flares. The data was created by counting daily flares of this class based on the peak time of the flare.
2015-01-01 until 2021-08-25
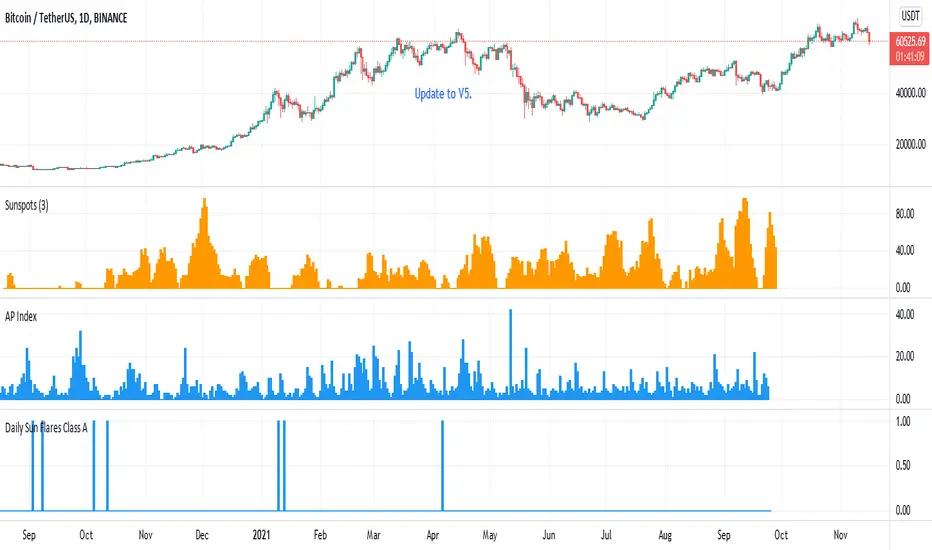
Daily Sun Flares Class AThe classification system for solar flares uses the letters A, B, C, M or X, according to the peak flux as measured at the Earth by the GOES spacecraft.
These are daily Class A sun flares. The data was created by counting daily flares of this class based on the peak time of the flare.
2015-01-01 until 2021-08-25
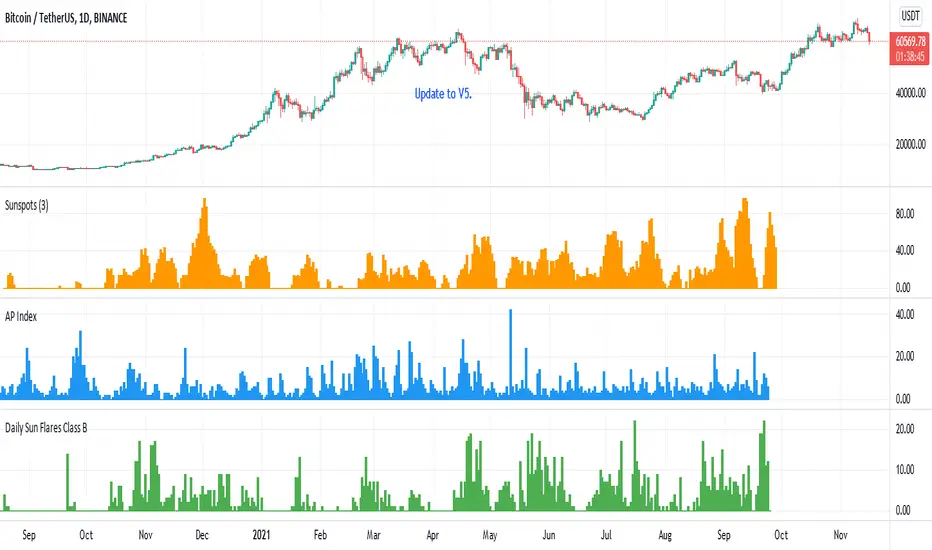
Daily Sun Flares Class BThe classification system for solar flares uses the letters A, B, C, M or X, according to the peak flux as measured at the Earth by the GOES spacecraft.
These are daily Class B sun flares. The data was created by counting daily flares of this class based on the peak time of the flare.
2015-01-01 until 2021-08-25
AP Index - Geomagnetic disturbancesDaily AP index back to 2015-01-01.
Geomagnetic disturbances can be monitored by ground-based magnetic observatories recording the three magnetic field components. The global Kp index is obtained as the mean value of the disturbance levels in the two horizontal field components, observed at 13 selected, subauroral stations . The name Kp originates from "planetarische Kennziffer" ( = planetary index).
The three-hour index ap and the daily indices Ap, Cp and C9 are directly related to the Kp index. In order to obtain a linear scale from Kp, J. Bartels gave the following table to derive a three-hour equivalent range, named ap index.
Geomagnetic Ap Index: The daily index Ap is obtained by averaging the eight values of ap for each day.
Based on the data from Helmholtz Centre Potsdam GFZ German Research Centre for Geosciences.

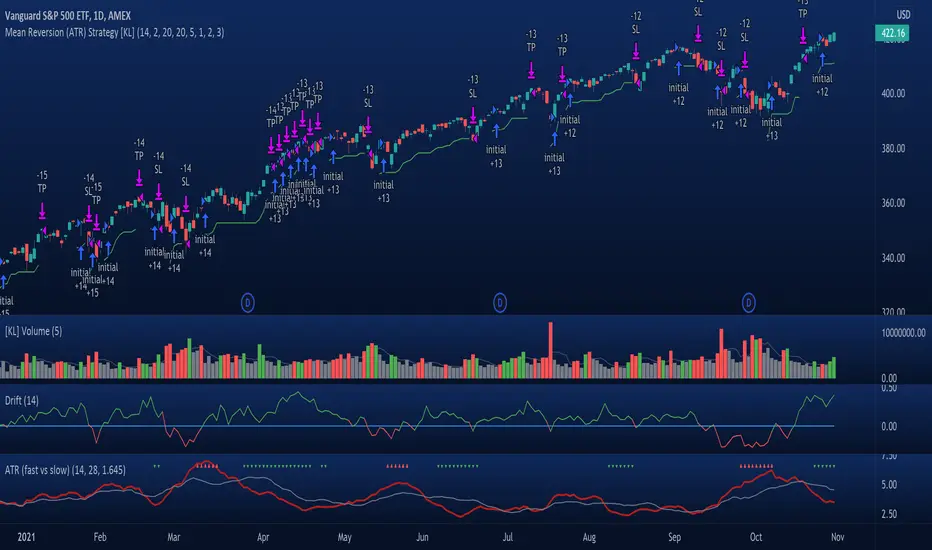
[KL] Mean Reversion (ATR) StrategyThis strategy will enter into a position when price volatility is relative high, betting that price will subsequently trend in a favourable direction.
Hypothesis : During periods of high price volatility, ATR will divert from its moving average by at least +/- one standard deviation. Eventually, ATR will revert back to the mean. However, just knowing the magnitude of increase/decrease of ATR does not give a trend signal, so we need to introduce a model in this script to predict whether the next bars will be up/down.
Trend Prediction : This strategy calculates the expected logarithmic return of the security (the "Drift") and considers prices to be moving in uptrend if the drift curve is upward sloping or if the drift value is positive.
Entry Conditions : Long position is entered when:
(a) ATR has diverted from mean by one standard deviation, and
(b) trend is predicted to move in our favor.
Exit Condition : When trailing stop loss is hit.
Results from backtesting against VOO (1H timeframe):
- approx 46% win rate over 491 trades, on average holding for 20 hours per trade
- price at the beginning of backtest (Jan. 2015) was $187.52, giving holding period return of ~120% had we not sold in between ("HPR of HODL'ing")
- this strategy gained ~159%, exceeding ~120% HPR of HODL'ing
Pi Cycle bitcoin bottomFull credits go to the owner, but for reasons i cannot diclose.
Introduction
With the adoption of cryptographic assets reaching new heights, it is undeniably important to continuously expand and improve current indicators just like how these assets update with new lines of code over time.
Philip Swift’s Pi-Cycle Top Indicator has effectively signaled market and local tops to within 3 days, with the most recent occurrence being on May 12th 2021.
If it were possible to find the cycle/local top of each cycle, a similar analogy could be used to pinpoint the bottom of Bitcoin’s price.
These Pi-Cycle indicators are merely just two moving averages which, when divided by each other, are equal to the value of π.
π = Long MA / Short MA
350/111 = 3.153; as per the existing Bitcoin Pi-Cycle Top indicator.
Pi-Cycle Bottom for Bitcoin
At first, the existing “Pi moving average” pair (350/111) was realigned to see whether they cross at the bottom of the Bitcoin price.
They did not, only to be a lagging indicator in both 2015 and 2018 cycle bottoms.
A possible pair was discovered when the short MA was set to 150:
π = Long MA / 150
Long MA = π * 150
Long MA = 471 (rounded to the nearest whole number)
This resulted in a Pi MA pair of 471/150.
Using the multiple x0.745 of the 471-day SMA and the 150-day EMA (exponential average to take into account of short term volatility ), the price of Bitcoin bottoms at where they two moving averages cross:
When the 150-day EMA crossed below the 471 SMA *0.475, Bitcoin’s price had bottomed for the market cycle.
Over the last two market cycles, this indicator has been accurate to within 3 days also.

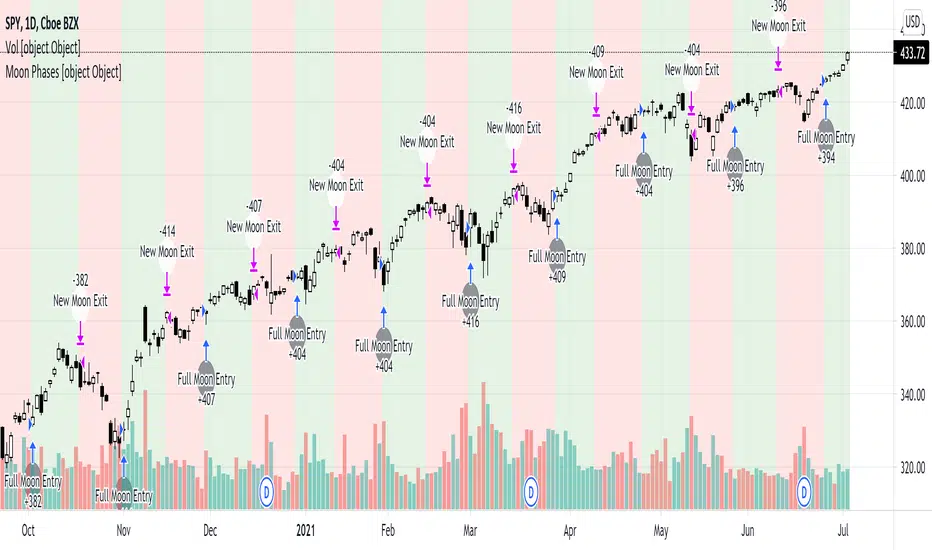
Simple Moon Phases StrategySimple Moon Phases Strategy
This strategy is very basic and needs some filters to improve results. It was created to test the Moon Phase theory compared to just a buy and hold strategy and it did not beat the buy and hold. However, if you flip the entry and exit signals to the opposite signals it performs a lot worse, so there might be some validity to the Moon Phases having an effect on the markets. I might try to add some filters and increase hold times with trailing stops in a separate version.
WARNING: This strategy uses hard-coded dates from 1/1/2015 until 12/31/2021 only! Any dates outside of that range need to be added manually in the code or it will not work. I may or may not update this so please don't be upset if it stops working after 12/31/2021.
Feel free to use any part of this code and please let me know if you can improve on this strategy.
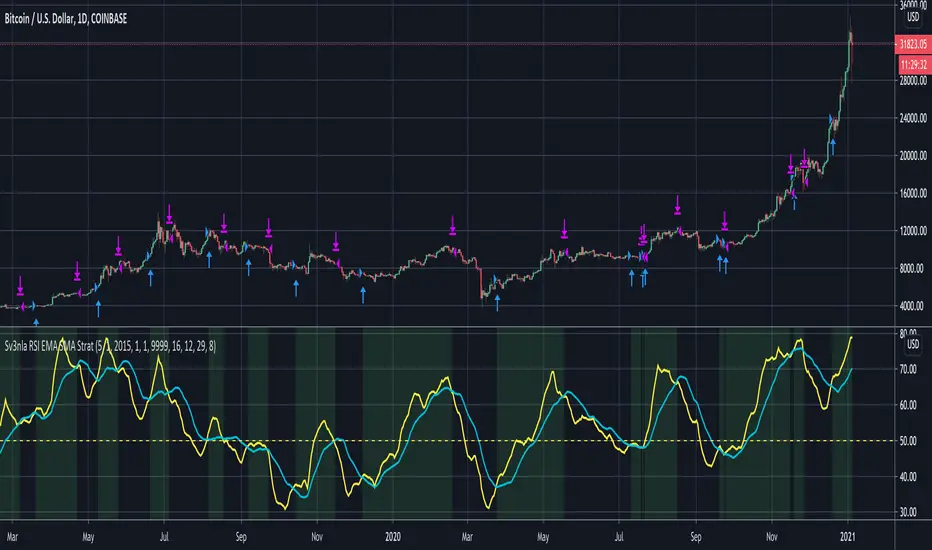
RSI EMA SMA StratThis script looks at the RSI EMA and RSI SMA crossovers when above a certain price EMA
It was mainly written for swingtrading and only for long positions on a daily timeframe for BTC and ETH. They idea is to have a script that indicates when to convert your BTC /ETC to a stable coin and when to buy in again.
You could try to use it for other positions (short, long, etc..) and other coins but I didn't test these.
When the RSI EMA & SMA hover around 50 for a few days in flat lines and you get a buy signal it may be best to wait a few days longer to see what direction they take.
The default values for RSI EMA , RSI SMA and price EMA gave the best return (start out with an amount of x coins in 2015 and end up with the biggest possible amount of coins today). Again, this was only tested on daily. Feel free to tweak these when using other timeframes or other coins
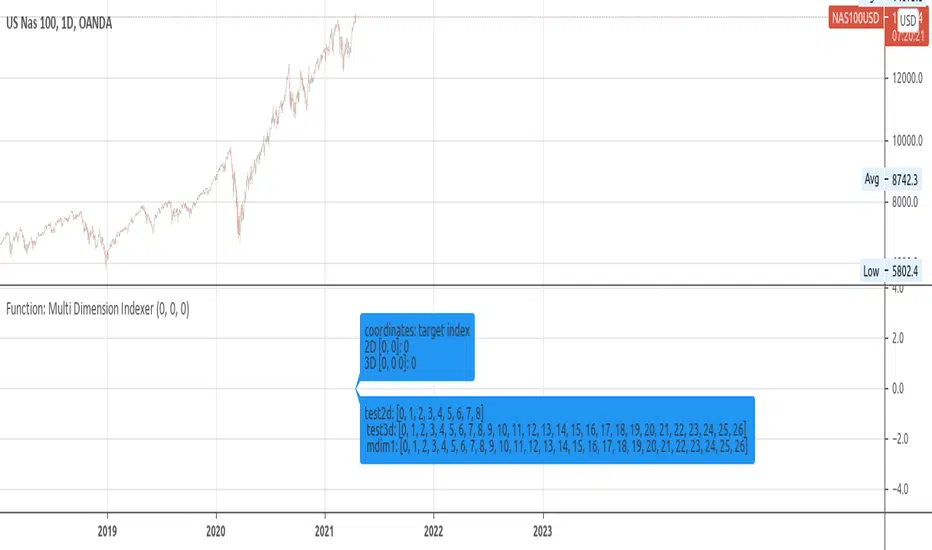
Function: Multi Dimension IndexerDescription:
A Function that returns the flat index of a N dimensions array.
Inputs:
_indices: Array containing dimension indices.¹
_limits: Array containing dimension size.¹
Note:
¹: _indices and _limits size must match. indices must be within dimension size.
Outputs:
_offset: the flat 1D index.
Resources:
eli.thegreenplace.net