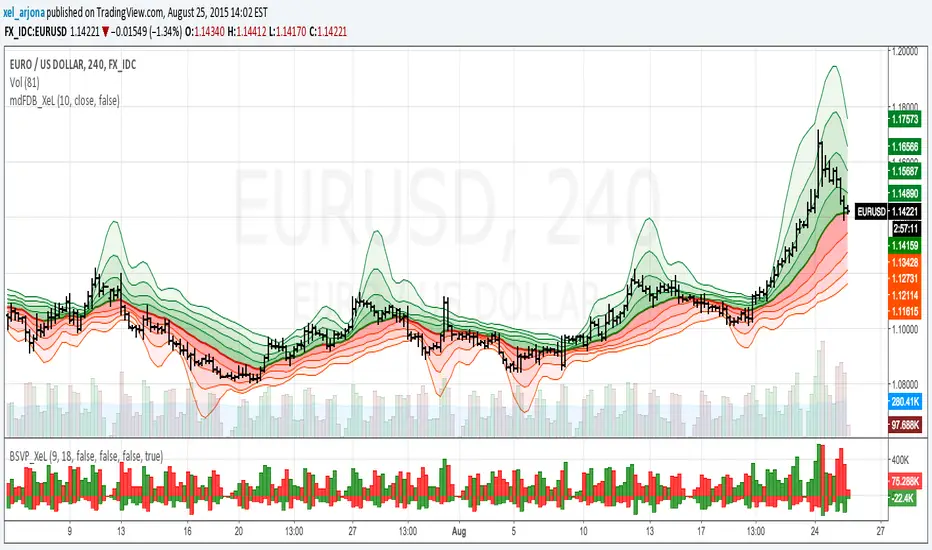
EVWMA Acc/Dist. Pressure & FRACTAL BANDS by @XeL_ArjonaEVWMA ACCUMULATION/DISTRIBUTION PRESSURE & FRACTAL BANDS
Version: 3.0 @ 4.11.2015
By Ricardo M Arjona @XeL_Arjona
DISCLAIMER:
The following indicator IS NOT INTENDED TO BE A FORMAL INVESTMENT ADVICE OR TRADING RECOMMENDATION BY THE AUTHOR, nor should be construed as such. Users will be fully responsible by their use regarding any kind of trading vehicles or assets.
The following script and ideas within this work are FREELY AND PUBLICLY availables on the Web for NON LUCRATIVE ACTIVITIES and must remain as is.
-== IMPORTANT: THIS IS AN EXPERIMENTAL INDICATOR ==-
What is this?
This work is a derivation of my previous Accumulation/Distribution scripts publicly available in TradingView in an effort to clean, speedup and make the indicator cleaner as possible.
The current indicator is based on already tested and Mathematically proof concepts as described below:
The MAIN Rolling back median line or "Vortex" is constructed by a simple and equal weighting of distributed volume along the candle range (This approach is just an "estimator" of Buyers Vs. Sellers given the lack of tick resolution in TradingView, a real "DELTA" can only be 100% reliable with Market Depth (Ask/Bid ticks)), Given this, with each "volume weights", the price is post-processed against a true statistical Average calculation formerly: ELASTIC VOLUME WEIGHTED MOVING AVERAGE.
The FRACTAL BANDS are just Standard Deviation's with GOLDEN RATIO as multiplier (1.618) derived one from each other within it's origin on the former "Vortex Median".
The Standard Error Bands comply as the original indicator described by Jon Andersen but given the true statistical nature of EVWMA, the original LinReg line has been substituted by the former.
ALL NEW IDEAS OR MODIFICATIONS to this indicator are welcome in favor to deploy a better technical tool. Any important addition to this work MUST REMAIN PUBLIC by means of CreativeCommons CC & TradingView user rules. (C) 2015 @XeL_Arjona
Cerca negli script per "2015年黄金价格走势"
Simple RSI-MA Algo Beats DOW By Huge Margin Over Past 100 Years!This simple RSI-MA long/short algorithm beats the Dow by a FREAKING HUGE margin over the past century (excluding dividends and trading costs).
The algorithm uses a fast SMA of the RSI as a buy/cover signal and a slow SMA of the RSI as a sell/short signal.
Backtest period = 09/17/1916 - 11/02/2015
Dow = 98 --> 17,830 = +18,094% = 5.38% CAGR
Algorithm = net profit + open P/L = +43,349% = 6.31% CAGR
Notice how the algorithm dodged both the 30s' Great Depression and the 2008 Crisis. Pretty cool huh? :)
ALGORITHM'S FORMULA (use weekly chart):
Buy/Cover = MA10(RSI10) cross> 50
Sell/Short = MA50(RSI10) cross< 50
STRATEGY TESTER'S SETTINGS:
- Initial cash = $10,000
- Pyramiding disabled
- Re-investment enabled (order size = 100% of equity )
- Trade re-calculations disabled
DISCLAIMER: None of my ideas and posts are investment advice. Past performance is not an indication of future results. This strategy was constructed with the benefit of hindsight and its future performance cannot be guaranteed.

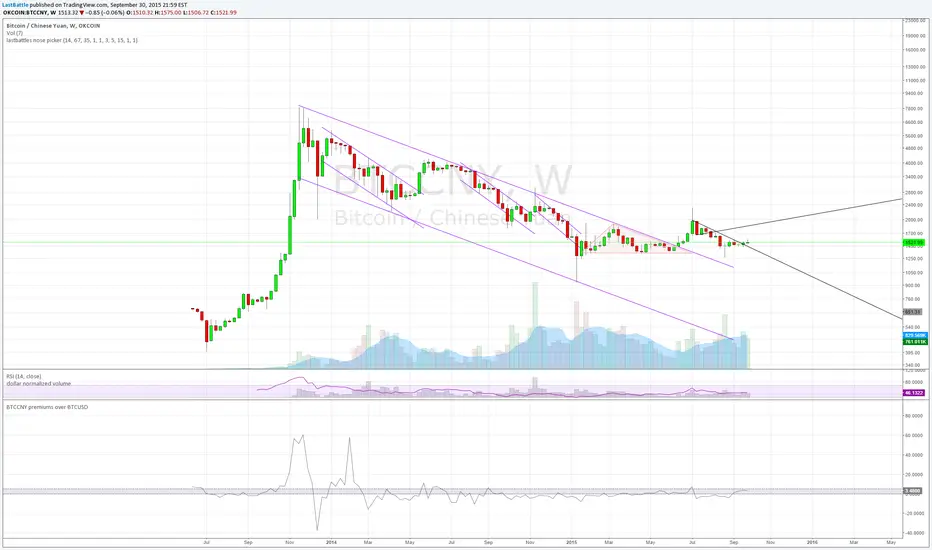
BTCCNY premiums over BTCUSD - yuan devaluationBitcoin as an alternative to capital outflows, with a market cap of just 2 billion can easily be up by multiples from the outflow of yuan from mainland China alone.
People simply do not want yuan if their purchasing power is going down over time.
Current methods of taking capital off mainland China via overseas cash withdrawals are quickly being closed out by the communist government.
------------------------------------------------------------
www.zerohedge.com
China has capped the amount of money Chinese holders of bank and credit cards can withdraw outside the country, in its latest effort to discourage people from moving badly needed capital offshore.
China’s foreign-exchange regulator put a new annual cap on overseas cash withdrawals using China UnionPay Co. bank cards, a UnionPay official said on Tuesday. Under the new rules, UnionPay cardholders can withdraw up to 50,000 yuan ($7,854) overseas during the last three months of this year, and the amount will be capped at 100,000 yuan for all of next year, the official said.
State-run UnionPay has a virtual monopoly on processing card transactions in China, meaning the limits extend to nearly all Chinese bank- and credit-card holders. It wasn’t clear when the new cap was issued.
The new cap is in addition to an existing 10,000 yuan daily withdrawal limit, part of China’s curbs on how much money can flow across its borders.
The move by China’s State Administration of Foreign Exchange is the latest by Beijing to scrutinize capital outflows.
The People’s Bank of China, the country’s central bank, said earlier this month that its foreign-exchange reserves fell by $93.9 billion, the biggest monthly drop ever, after it surprised the market on Aug. 11 with its decision to devalue the yuan by around 2%.
Key takeaway from the yuan devaluation and capital control:
The collapse of 2 bubbles: housing and stock market.
Weakness in commodities such as steel, copper and oil are seen which signals a weakening economy of which China are the core driver of that expansion since 2008. I suspect that China's GDP is never 8% as it is reported, but rather near 2~4% right now.
China have spent over 100 billion USD in US treasury proceeds to stabilize the yuan collapsing faster due to speculators. The amount of reserves spent at the current rate is unsustainable, it will take just 2 years for them to be used up completely.
Over time yuan will still be heading downwards.
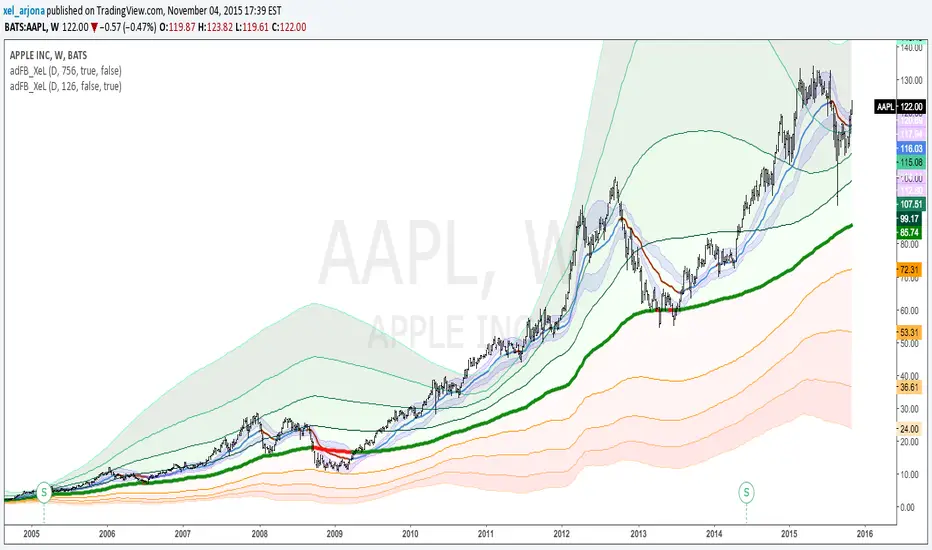
Acc/DistAMA with FRACTAL DEVIATION BANDS by @XeL_ArjonaACCUMULATION/DISTRIBUTION ADAPTIVE MOVING AVERAGE with FRACTAL DEVIATION BANDS
Ver. 2.5 @ 16.09.2015
By Ricardo M Arjona @XeL_Arjona
DISCLAIMER:
The Following indicator/code IS NOT intended to be a formal investment advice or recommendation by the
author, nor should be construed as such. Users will be fully responsible by their use regarding their own trading vehicles/assets.
The embedded code and ideas within this work are FREELY AND PUBLICLY available on the Web for NON LUCRATIVE ACTIVITIES and must remain as is.
Pine Script code MOD's and adaptations by @XeL_Arjona with special mention in regard of:
Buy (Bull) and Sell (Bear) "Power Balance Algorithm" by:
Stocks & Commodities V. 21:10 (68-72): "Bull And Bear Balance Indicator by Vadim Gimelfarb"
Fractal Deviation Bands by @XeL_Arjona.
Color Cloud Fill by @ChrisMoody
CHANGE LOG:
Following a "Fractal Approach" now the lookback window is hardcode correlated with a given timeframe. (Default @ 126 days as Half a Year / 252 bars)
Clean and speed up of Adaptive Moving Average Algo.
Fractal Deviation Band Cloud coloring smoothed.
>
ALL NEW IDEAS OR MODIFICATIONS to these indicator(s) are Welcome in favor to deploy a better and more accurate readings. I will be very glad to be notified at Twitter or TradingVew accounts at: @XeL_Arjona
Any important addition to this work MUST REMAIN PUBLIC by means of CreativeCommons CC & TradingView. Copyright 2015
extended session - Regular Opening-Range- JayyOpening Range and some other scripts updated to plot correctly (see comments below.) There are three variations of the fibonacci expansion beyond the opening range and retracements within the opening range of the US Market session - I have not put in the script for the other markets yet.
The three scripts have different uses and strengths:
The extended session script (with the script here below) will plot the opening range whether you are using the extended session or the regular session. (that is to say whether "ext" in the lower right hand corner is highlighted or not.). While in the extended session the opening range has some plotting issues with periods like 13 minutes or any period that is not divisible into 330 mins with a round number outcome (eg 330/60 =5.5. Therefore an hour long opening range has problems in the extended session.
The pre session script is only for the premarket. You can select any opening range period you like. I have set the opening range to be the full premarket session. If you select a different session you will have to unselect "pre open to 9:30 EST for Opening Range?" in the format section. The script defaults to 15 minutes in the "period Of Pre Opening Range?". To go back to the 4 am to 9:30 pre opening range select "pre open to 9:30 EST for Opening Range?" there is no automatic 330 minute selection.
The past days offset script only works in 5 min or 15 minute period. It will show the opening range from up to 20 days past over the current days price action. Use this for the regular session only. 0 shows the current day's opening range. Use the positive integers for number of days back ie 1, 2, 3 etc not -1, -2, -3 etc. The script is preprogrammed to use the current day (0).
Scripts updated to plot correctly: One thing they all have in common is a way of they deal with a somewhat random problem that shifts the plots 4 hours in one direction or the other ie the plot started at 9:30 EST or 1:30PM EST. This issue started to occur approximately June 22, 2015 and impacts any script that tried to use "session" times to manage a plot in my scripts. The issue now seems to have been resolved during this past week.
Just in case the problem reoccurs I have added a "Switch session plot?" to each script. If the plot looks funny check or uncheck the "Switch session plot?" and see the difference. Of course if a new issue crops up it will likely require a different fix.
I have updated all of the scripts shown on this chart. If you are using a script of mine that suffers from the compiler issue then you will find an update on this chart. You can get any and all of the scripts by clicking on the small sideways wishbone on the left middle of the chart. You will see a dialogue box. Then click "make it mine". This will import all of the scripts to your computer and you can play around with them all to decide what you want and what you don't want. This is the easiest way to get all of the scripts in one fell swoop. It is also the easiest way for me to make all of the scripts available. I do not have all of the plots visible since it is too messy and one of the scripts (pre OR) is only for the regular session. To view the scripts click on the blue eye to the right of the script title to show it on this script. If you can only use the regular session. The scripts will all (with the exception of the pre OR) work fine.
If for any reason this script seems flakey refresh the page r try a slightly different period. I have noticed that sometimes randomly the script loves to return to the 5 min OR. This is a very new issue transient issue. As always if you see an issue please let me know.
Cheers Jayy

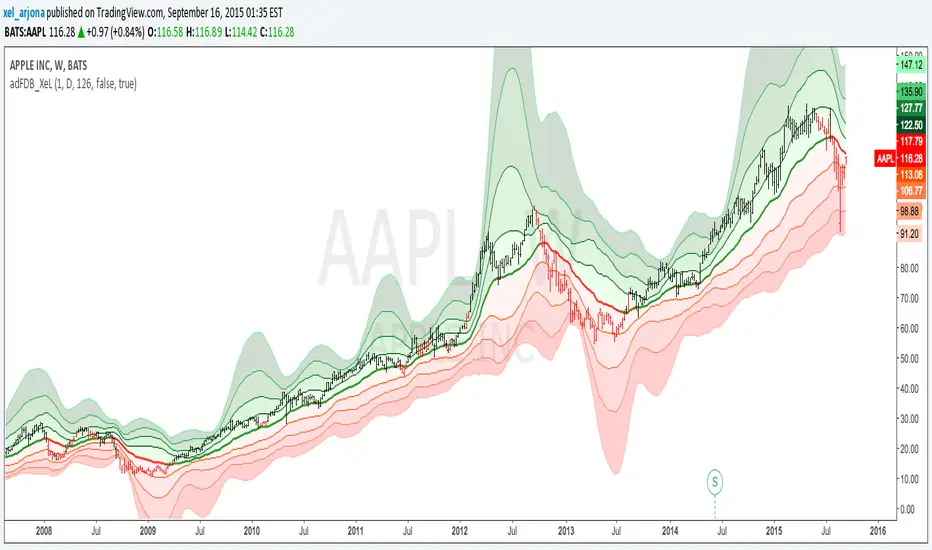
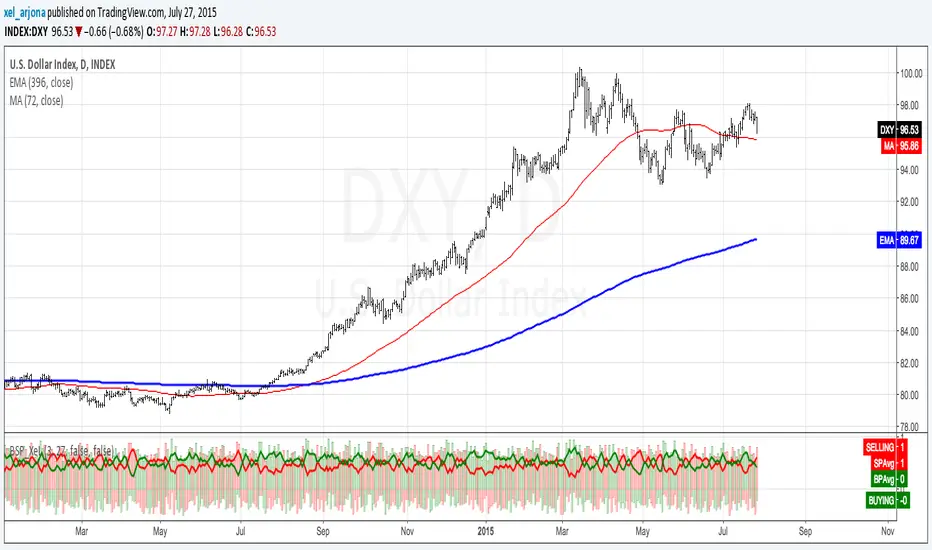
EMA & SMA with FRACTAL DEVIATION BANDS by @XeL_ArjonaEMA & SMA with FRACTAL DEVIATION BANDS
Ver. 1.0.25.08.2015
By Ricardo M Arjona @XeL_Arjona
DISCLAIMER:
DISCLAIMER:
The Following indicator/code IS NOT intended to be a formal investment advice or recommendation by the author, nor should be construed as such. Users will be fully responsible by their use regarding their own trading vehicles/assets. The embedded code and ideas within this work are FREELY AND PUBLICLY available on the Web for NON LUCRATIVE ACTIVITIES and must remain as is.
WHAT IS THIS?
This is the adaptation of the FRACTAL DEVIATION BANDS to be used on Traditional Moving Averages (Simple & Exponential).
ALL NEW IDEAS OR MODIFICATIONS to these indicator(s) are Welcome in favor to deploy a better and more accurate readings. I will be very glad to be notified at Twitter or TradingVew accounts at: @XeL_Arjona
Any important addition to this work MUST REMAIN PUBLIC by means of CreativeCommons CC & TradingView.
2015

McGinley Dynamic with FRACTAL DEVIATION BANDS by @XeL_ArjonaMcGINLEY DYNAMIC with FRACTAL DEVIATION BANDS.
Ver. 1.0.beta.25.08.2015
By Ricardo M Arjona @XeL_Arjona
DISCLAIMER
The Following indicator/code IS NOT intended to be a formal investment advice or recommendation by the author, nor should be construed as such. Users will be fully responsible by their use regarding their own trading vehicles/assets. -- The embedded code and ideas within this work are FREELY AND PUBLICLY available on the Web for NON LUCRATIVE ACTIVITIES and must remain as is.
WHAT IS THIS?
This is my first adaptation of the FRACTAL DEVIATION BANDS to the "McGinley Dynamic Line". Be advised that the nature of this line tend to need some adjustments at the "Smooth Factor" if you see a flat line with tiny values.
Pine Script code MOD's and adaptations by @XeL_Arjona with special mention in regard of:
Morphic Numbers: (PHI & Plastic) Pine Script adaptation from it's algebraic generation formulas by @XeL_Arjona.
FRACTAL DEVIATION BANDS: main idea by @XeL_Arjona
ALL NEW IDEAS OR MODIFICATIONS to these indicator(s) are Welcome in favor to deploy a better and more accurate readings. I will be very glad to be notified at Twitter or TradingVew accounts at: @XeL_Arjona. Any important addition to this work MUST REMAIN PUBLIC by means of CreativeCommons CC & TradingView.
2015
Acc/Dist. Cloud with Fractal Deviation Bands by @XeL_ArjonaACCUMULATION / DISTRIBUTION CLOUD with MORPHIC DEVIATION BANDS
Ver. 2.0.beta.23:08:2015
by Ricardo M. Arjona @XeL_Arjona
DISCLAIMER
The Following indicator/code IS NOT intended to be a formal investment advice or recommendation by the author, nor should be construed as such. Users will be fully responsible by their use regarding their own trading vehicles/assets.
The embedded code and ideas within this work are FREELY AND PUBLICLY available on the Web for NON LUCRATIVE ACTIVITIES and must remain as is.
Pine Script code MOD's and adaptations by @XeL_Arjona with special mention in regard of:
Buy (Bull) and Sell (Bear) "Power Balance Algorithm by Vadim Gimelfarb published at Stocks & Commodities V. 21:10 (68-72).
Custom Weighting Coefficient for Exponential Moving Average (nEMA) adaptation work by @XeL_Arjona with contribution help from @RicardoSantos at TradingView @pinescript chat room.
Morphic Numbers (PHI & Plastic) Pine Script adaptation from it's algebraic generation formulas by @XeL_Arjona
Fractal Deviation Bands idea by @XeL_Arjona
CHANGE LOG:
ACCUMULATION / DISTRIBUTION CLOUD: I decided to change it's name from the Buy to Sell Pressure. The code is essentially the same as older versions and they are the center core (VORTEX?) of all derived New stuff which are:
MORPHIC NUMBERS: The "Golden Ratio" expressed by the result of the constant "PHI" and the newer and same in characteristics "Plastic Number" expressed as "PN". For more information about this regard take a look at: HERE!
CUSTOM(K) EXPONENTIAL MOVING AVERAGE: Some code has cleaned from last version to include as custom function the nEMA , which use an additional input (K) to customise the way the "exponentially" is weighted from the custom array. For the purpose of this indicator, I implement a volatility algorithm using the Average True Range of last 9 periods multiplied by the morphic number used in the fractal study. (Golden Ratio as default) The result is very similar in response to classic EMA but tend to accelerate or decelerate much more responsive with wider bars presented in trending average.
FRACTAL DEVIATION BANDS: The main idea is based on the so useful Standard Deviation process to create Bands in favor of a multiplier (As John Bollinger used in it's own bands) from a custom array, in which for this case is the "Volume Pressure Moving Average" as the main Vortex for the "Fractallitly", so then apply as many "Child bands" using the older one as the new calculation array using the same morphic constant as multiplier (Like Fibonacci but with other approach rather than %ratios). Results are AWSOME! Market tend to accelerate or decelerate their Trend in favor of a Fractal approach. This bands try to catch them, so please experiment and feedback me your own observations.
EXTERNAL TICKER FOR VOLUME DATA: I Added a way to input volume data for this kind of study from external tickers. This is just a quicky-hack given that currently TradingView is not adding Volume to their Indexes so; maybe this is temporary by now. It seems that this part of the code is conflicting with intraday timeframes, so You are advised.
This CODE is versioned as BETA FOR TESTING PROPOSES. By now TradingView Admins are changing lot's of things internally, so maybe this could conflict with correct rendering of this study with special tickers or timeframes. I will try to code by itself just the core parts of this study in order to use them at discretion in other areas. ALL NEW IDEAS OR MODIFICATIONS to these indicator(s) are Welcome in favor to deploy a better and more accurate readings. I will be very glad to be notified at Twitter or TradingView accounts at: @XeL_Arjona

Volume Pressure Composite Average with Bands by @XeL_ArjonaVOLUME PRESSURE COMPOSITE AVERAGE WITH BANDS
Ver. 1.0.beta.10.08.2015
By Ricardo M Arjona @XeL_Arjona
DISCLAIMER:
The Following indicator/code IS NOT intended to be a formal investment advice or recommendation by the author, nor should be construed as such. Users will be fully responsible by their use regarding their own trading vehicles/assets.
The embedded code and ideas within this work are FREELY AND PUBLICLY available on the Web for NON LUCRATIVE ACTIVITIES and must remain as is.
Pine Script code MOD's and adaptations by @XeL_Arjona with special mention in regard of:
Buy (Bull) and Sell (Bear) "Power Balance Algorithm" by :
Stocks & Commodities V. 21:10 (68-72):
"Bull And Bear Balance Indicator by Vadim Gimelfarb"
Adjusted Exponential Adaptation from original Volume Weighted Moving Average (VEMA) by @XeL_Arjona with help given at the @pinescript chat room with special mention to @RicardoSantos
Color Cloud Fill Condition algorithm by @ChrisMoody
WHAT IS THIS?
The following indicators try to acknowledge in a K-I-S-S approach to the eye (Keep-It-Simple-Stupid), the two most important aspects of nearly every trading vehicle: -- PRICE ACTION IN RELATION BY IT'S VOLUME --
A) My approach is to make this indicator both as a "Trend Follower" as well as a Volatility expressed in the Bands which are the weighting basis of the trend given their "Cross Signal" given by the Buy & Sell Volume Pressures algorithm. >
B) Please experiment with lookback periods against different timeframes. Given the nature of the Volume Mathematical Monster this kind of study is and in concordance with Price Action; at first glance I've noted that both in short as in long term periods, the indicator tends to adapt quite well to general price action conditions. BE ADVICED THIS IS EXPERIMENTAL!
C) ALL NEW IDEAS OR MODIFICATIONS to these indicator(s) are Welcome in favor to deploy a better and more accurate readings. I will be very glad to be notified at Twitter or TradingVew accounts at: @XeL_Arjona
Any important addition to this work MUST REMAIN PUBLIC by means of CreativeCommons CC & TradingView. --- All Authorship Rights RESERVED 2015 ---

Humble Student OB/OS Trifecta indicatorAfter reading Cam Hui's blog post about his "Trifecta" bottom spotting model I thought I'd try my hand at scripting it as an indicator. The results are pretty close to what he describes. Though the data TradingView feeds me doesn't seem to be identical to what he's using on StockCharts.com the results are close enough that I will call the effort a success worth publishing.

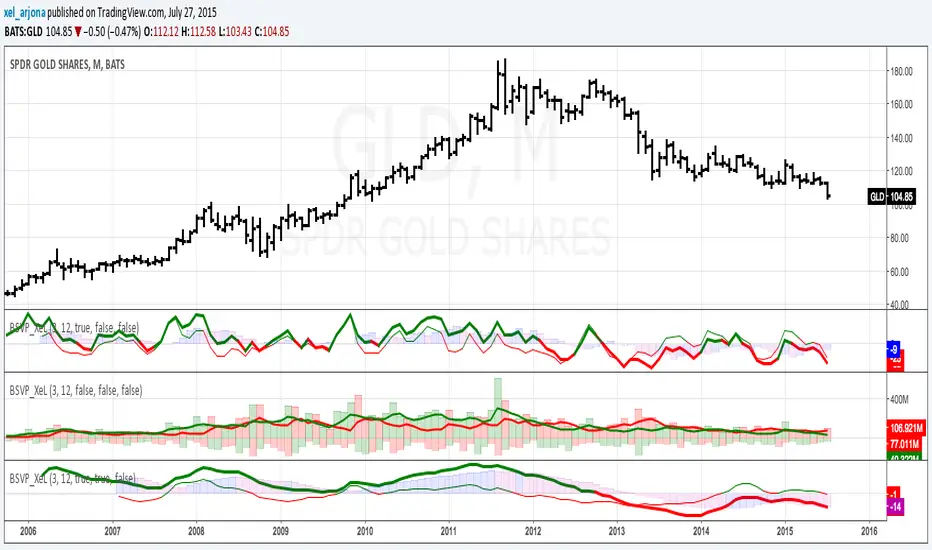
BUY & SELL VOLUME TO PRICE PRESSURE by @XeL_ArjonaBUY & SELL PRICE TO VOLUME PRESSURE
By Ricardo M Arjona @XeL_Arjona
DISCLAIMER:
The Following indicator/code IS NOT intended to be a formal investment advice or recommendation by the author, nor should be construed as such. Users will be fully responsible by their use regarding their own trading vehicles/assets.
The embedded code and ideas within this work are FREELY AND PUBLICLY available on the Web for NON LUCRATIVE ACTIVITIES and must remain as is.
Pine Script code MOD's and adaptations by @XeL_Arjona with special mention in regard of:
Buy (Bull) and Sell (Bear) "Power Balance Algorithm" by: Stocks & Commodities V. 21:10 (68-72): "Bull And Bear Balance Indicator by Vadim Gimelfarb"
Normalisation (Filter) from Karthik Marar's VSA work: karthikmarar.blogspot.mx
Buy to Sell Convergence / Divergence and Volume Pressure Counterforce Histogram Ideas by: @XeL_Arjona
WHAT IS THIS?
The following indicators try to acknowledge in a K-I-S-S approach to the eye (Keep-It-Simple-Stupid), the two most important aspects of nearly every trading vehicle: -- PRICE ACTION IN RELATION BY IT'S VOLUME --
Volume Pressure Histogram: Columns plotted in positive are considered the dominant Volume Force for the given period. All "negative" columns represents the counterforce Vol.Press against the dominant.
Buy to Sell Convergence / Divergence: It's a simple adaptation of the popular "Price Percentage Oscillator" or MACD but taking Buying Pressure against Selling Pressure Averages, so given a Positive oscillator reading (>0) represents Bullish dominant Trend and a Negative reading (<0) a Bearish dominant Trend. Histogram is the diff between RAW Volume Pressures Convergence/Divergence minus Normalised ones (Signal) which helps as a confirmation.
Volume bars are by default plotted from RAW Volume Pressure algorithms, but they can be as well filtered with Karthik Marar's approach against a "Total Volume Average" in favor to clean day to day noise like HFT.
ALL NEW IDEAS OR MODIFICATIONS to these indicators are Welcome in favor to deploy a better and more accurate readings. I will be very glad to be notified at Twitter: @XeL_Arjona
Any important addition to this work MUST REMAIN PUBLIC by means of CreativeCommons CC & TradingView. -- 2015

BUY & SELL VOLUME PRESSURE by @XeL_ArjonaBUY & SELL PRICE TO VOLUME PRESSURE
By Ricardo M Arjona @XeL_Arjona
DISCLAIMER:
The Following indicator/code IS NOT intended to be a formal investment advice or recommendation by the author, nor should be construed as such. Users will be fully responsible by their use regarding their own trading vehicles/assets.
The embedded code and ideas within this work are FREELY AND PUBLICLY available on the Web for NON LUCRATIVE ACTIVITIES and must remain as is.
Pine Script code MOD's and adaptations by @XeL_Arjona with special mention in regard of:
Buy (Bull) and Sell (Bear) "Power Balance Algorithm" by: Stocks & Commodities V. 21:10 (68-72): "Bull And Bear Balance Indicator by Vadim Gimelfarb"
Normalisation (Filter) from Karthik Marar's VSA work: karthikmarar.blogspot.mx
Buy to Sell Convergence / Divergence and Volume Pressure Counterforce Histogram Ideas by: @XeL_Arjona
WHAT IS THIS?
The following indicators try to acknowledge in a K-I-S-S approach to the eye (Keep-It-Simple-Stupid), the two most important aspects of nearly every trading vehicle: -- PRICE ACTION IN RELATION BY IT'S VOLUME --
Volume Pressure Histogram: Columns plotted in positive are considered the dominant Volume Force for the given period. All "negative" columns represents the counterforce Vol.Press against the dominant.
Buy to Sell Convergence / Divergence: It's a simple adaptation of the popular "Price Percentage Oscillator" or MACD but taking Buying Pressure against Selling Pressure Averages, so given a Positive oscillator reading (>0) represents Bullish dominant Trend and a Negative reading (<0) a Bearish dominant Trend. Histogram is the diff between RAW Volume Pressures Convergence/Divergence minus Normalised ones (Signal) which helps as a confirmation.
Volume bars are by default plotted from RAW Volume Pressure algorithms, but they can be as well filtered with Karthik Marar's approach against a "Total Volume Average" in favor to clean day to day noise like HFT.
ALL NEW IDEAS OR MODIFICATIONS to these indicators are Welcome in favor to deploy a better and more accurate readings. I will be very glad to be notified at Twitter: @XeL_Arjona
Any important addition to this work MUST REMAIN PUBLIC by means of CreativeCommons CC & TradingView. -- 2015
Apirine Slow RSI [LazyBear]The slow relative strength index (SRSI) indicator created by Vitali Apirine is a momentum price oscillator similar to RSI in its application and interpretation. Oscillating between 0 and 100, it generates both OB/OS signals and midline (50) cross over signals and divergences.
As author suggests, bullish/bearish divergences generated by SRSI are not as effective during strong trends. To avoid fading an established trend, the system is used in conjunction with a trend confirmation tool like ADX indicator.
You can configure the OB/OS levels, default are 70/30.
More info:
The slow relative strength index, TASC 2015-07
List of my public indicators: bit.ly
List of my app-store indicators: blog.tradingview.com

BACKTEST SCRIPT 0.999 ALPHATRADINGVIEW BACKTEST SCRIPT by Lionshare (c) 2015
THS IS A REAL ALTERNATIVE FOR LONG AWAITED TV NATIVE BACKTEST ENGINE.
READY FOR USE JUST RIGHT NOW.
For user provided trading strategy, executes the trades on pricedata history and continues to make it over live datafeed.
Calculates and (plots on premise) the next performance statistics:
profit - i.e. gross profit/loss.
profit_max - maximum value of gross profit/loss.
profit_per_trade - each trade's profit/loss.
profit_per_stop_trade - profit/loss per "stop order" trade.
profit_stop - gross profit/loss caused by stop orders.
profit_stop_p - percentage of "stop orders" profit/loss in gross profit/loss.
security_if_bought_back - size of security portfolio if bought back.
trades_count_conseq_profit - consecutive gain from profitable series.
trades_count_conseq_profit_max - maxmimum gain from consecutive profitable series achieved.
trades_count_conseq_loss - same as for profit, but for loss.
trades_count_conseq_loss_max - same as for profit, but for loss.
trades_count_conseq_won - number of trades, that were won consecutively.
trades_count_conseq_won_max - maximum number of trades, won consecutively.
trades_count_conseq_lost - same as for won trades, but for lost.
trades_count_conseq_lost_max - same as for won trades, but for lost.
drawdown - difference between local equity highs and lows.
profit_factor - profit-t-loss ratio.
profit_factor_r - profit(without biggest winning trade)-to-loss ratio.
recovery_factor - equity-to-drawdown ratio.
expected_value - median gain value of all wins and loss.
zscore - shows how much your seriality of consecutive wins/loss diverges from the one of normal distributed process. valued in sigmas. zscore of +3 or -3 sigmas means nonrandom realitonship of wins series-to-loss series.
confidence_limit - the limit of confidence in zscore result. values under 0.95 are considered inconclusive.
sharpe - sharpe ratio - shows the level of strategy stability. basically it is how the profit/loss is deviated around the expected value.
sortino - the same as sharpe, but is calculated over the negative gains.
k - Kelly criterion value, means the percentage of your portfolio, you can trade the scripted strategy for optimal risk management.
k_margin - Kelly criterion recalculated to be meant as optimal margin value.
DISCLAIMER :
The SCRIPT is in ALPHA stage. So there could be some hidden bugs.
Though the basic functionality seems to work fine.
Initial documentation is not detailed. There could be english grammar mistakes also.
NOW Working hard on optimizing the script. Seems, some heavier strategies (especially those using the multiple SECURITY functions) call TV processing power limitation errors.
Docs are here:
docs.google.com

DiNapoli MACD & Stoch [LazyBear] --- Updated: May 19 2015 ----
Applicable only If you are setting up alerts:
I noticed I have switched the plot names. Histo shd be the MACD and DMACD shd be the Signal.
Replace lines 16 & 17 with these to get the correct names. NOTE that no functionality is affected, just the names.
plot(r, style=columns, color=r>0?green:red, transp=80, title="Dinapoli MACD")
plot(s, color=teal, linewidth=2, title="Trigger")
--- Original Description ---
These two indicators are from one of my favorite books - DiNapoli's Levels. These are custom MACD and Stoch used by him. There are more indicators - Detrended Osc, DisplacedMA - that he uses, will publish them all later.
The settings of normal MACD/Stoch can be tuned to obtain these DiNapoli indicators, or if you are lazy (like me!) just use these :)
DiNapoli Preferred Stoch source: pastebin.com
More info:
www.amazon.com
List of my public indicators: bit.ly
List of my app-store indicators: blog.tradingview.com

Belkhayate Timing [LazyBear]--- Update April 11, 2015 ----
I have merged in @TheMighyChicken's code (Thanks!) and added some more options. Updated source here - pastebin.com
Changes:
--------------
- Switch between plain candles and colored oscillator candles.
- Switch between candles and plain oscillator view.
--- Original Description ---
Belkhayate Timing, by Mostafa Belkhayate, is very famous in the Forex groups. This is a port from one of the MT4 versions available. If you have used this in other platforms, do let me know if this looks compared to those.
The usage is similar to that of ValueChart (). The middle area is the centroid or neutral area, the shaded regions (red/green) are extreme and beyond those are AlertZones. This seems to be used in conjunction with his other indicators, but, in my limited testing, I have seen this give a lot of good signals, especially on divergences.
Indicator allows coloring bars based on the oscillator position or show oscillator histogram (Check the options page).
Histogram=ON:
No Oscillator Smoothing:
@TheMightyChicken Can you do your candle magic on this oscillator too, just like you did for ValueChart? :)
More Info:
www.forexfactory.com
List of my public indicators: bit.ly
List of my app-store indicators: blog.tradingview.com

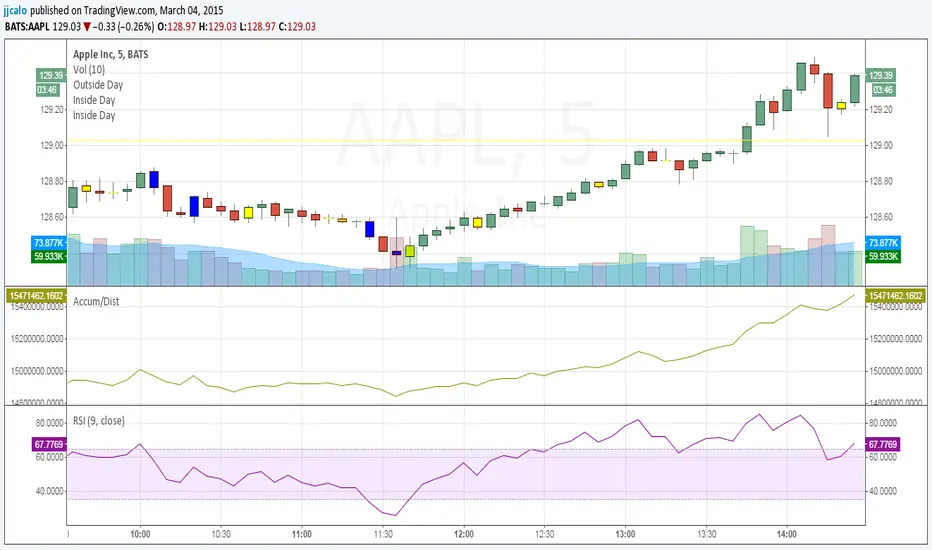
jc-Inside_BarCopyright by jack calo -- v1.0 -- 03/04/2015 -- Paint the bar yellow when it's an inside day. When the full range of a candle is equal or within the full range of the previous bar. Credit to Rob Smith and his In The Black Strategy.
LBR Paintbars [LazyBear]
Added coloring of LB bars above/below Keltner Channel (as suggested by user @20813 below in the comments).
Updated code: pastebin.com
See comments section below for a sample chart. Copy the code from the pastebin above and update your local copy (TV doesn't allow me to update an already published code -- yet!).
Added features:
- Switch ON/OFF KC
- Mark LB bars above/below KC
----------------------------------------------------------------------
The LBR PaintBars indicator changes the colour of the price bars based on the trend direction (derived from price & volatility bands). This is mostly used as a confirmation indicator.
For the Pine coders: I suggest trying stdev() in lieu of atr()...some wild combinations can be derived from this simple idea :)
Indicator supports the following options:
- Switching on/off volatility bands
- Switching on/off LBR colors (lime/maroon).
- Color non-LBR bars (blue).
Thanks @mseaworthy for pinging me with this idea.
Complete list of my indicators:
-----------------------------
docs.google.com

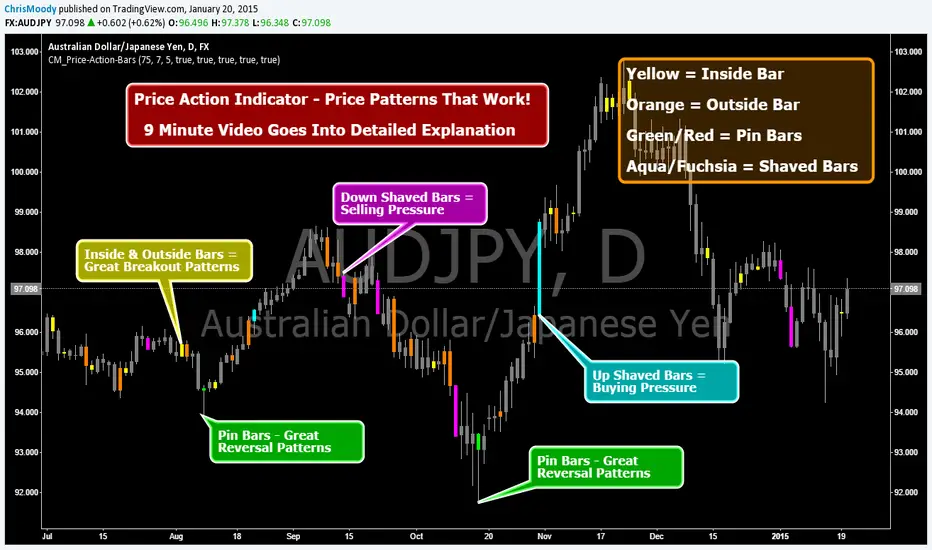
CM_Price-Action-Bars-Price Patterns That Work!Price Action Indicator - Price Patterns That Work!
9 Minute Video Goes Into Detailed Explanation
4 Simple but Effective Price Patterns!
Yellow = Inside Bar – Breakout Patterns
Orange = Outside Bar – Breakout Patterns
Green/Red = Pin Bars
Aqua/Fuchsia = Shaved Bars
***MANY Features and Customizing Options…Detailed Overview In Video.
How To Turn Bars Patterns On And Off.
Ways To Customize.
General Thought Process of the 4 Price Action Patterns.
What Each Setting in the Inputs Tab Does.
***Special Announcement. Video Below Just Updated. Received a Special Promotion from the creator of these Price Action Bars and Many other Price Action Setups. Hedge Fund Manager and Founder of 2ndSkiesForex.com Chris Capre.
1st 10 minutes of Video is covering throughout process and how to implement the Indicators.
2nd 12 minutes covers a Special Promotion offered to TradingView members directly from Chris Capre.
Video Link Below.
vimeopro.com
This Version of the video will be taken down 2/01/2015 and the original video will be uploaded again.
CM_Williams_Vix_Fix_V3_Ultimate_Filtered_AlertsNew Williams Vix Fix - Major Update - Filtered Entries - Additional Alerts - And Much More...
***01-05-2015 Major Updates Include:
***ALL Features Available To Turn On/Off On The INPUTS Tab!!!
FILTERED ENTRIES -- Plus AGGRESSIVE FILTERED ENTRIES - HIGHLIGHT BARS AND ALERTS
*Alerts Enabled for 4 Different Criteria
*Ability To Plot Alerts True/False Conditions on top of the WVF Histogram
*Ability To Turn Off the Histogram and just see True/False Alerts Conditions.
*Ability to Turn All Price Bars Gray, and Color the Price Bars to Match the WVF Colors Exactly, Including All 3 Entry Types.
*Added Inputs To Adjust the 3 Numerical Inputs That Define The PRICE ACTION FILTER! Explained in Video.
*Main Video is 34 Minutes…However, the New Features Are Extensive and I Go Thru All Features In Depth.
*I Recommend Using the VSTOP Indicator. I Go Through How To Customize It In Video.
Videos:
Video: The Evolution of the Williams Vix Fix - 12 Minutes.
vimeopro.com
Video: Williams Vix Fix V3 - Major Update - Additional Alerts and Filtered Entries - 34 Minutes.
***Video Covers In Detail How To Use The Multiple Alerts And Plot Styles Available.
vimeopro.com
Posts To Reference…
New Video on How to Create Alerts W/ Any Custom Indicator.
www.tradingview.com
Great Confirming Indicator for the Williams Vix Fix
CM_WILLIAMS_VIX_FIX FINDS MARKET BOTTOMS

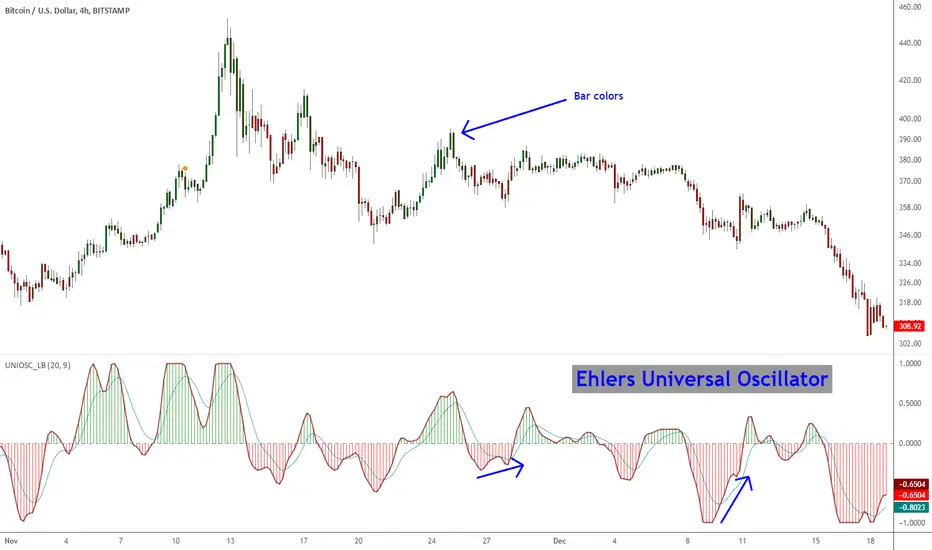
Ehlers Universal Oscillator [LazyBear]Universal Oscillator by Mr. Ehlers is an evolution of his SuperSmoother filter. The new indicator follows the swings in price without introducing extra delay.
It is controlled through one single input – the band edge – which basically is frequency. The smaller it is set, the less lag there is, but you may see lot of whipsaws. Built-in automatic gain control normalizes the output to vary between the range of -1 to +1.
Mr. Ehlers suggests a straightforward system:
- Buy when long-term Universal Oscillator crosses above zero
- Sell when long-term Universal Oscillator crosses below zero
I have added options to draw a signal line, histogram and bar coloring. Bar coloring, if enabled, is done using the histogram color, but you can change it easily to signal_cross by uncommenting a line (check the source).
More info:
Whiter is Brighter - Ehlers
List of my other indicators:
- GDoc: docs.google.com
- Chart: