Sexy RSI for sexy tradersHello fellow sexy traders.
I was tired of constantly having to add my own horizontals/MAs to the default RSI so I decided to make this modification.
The default settings include channels from 40-80 (green horizontals) for a bullish range, and 20-60 (red horizontals) for the bearish range.
Also includes white line at 50 level, and blue horizontals at extremes (90 and 10).
If RSI stays in one of the red or green range that can signify the trend direction, as directed by Andrew Cardwell (inventor of the RSI).
If you wish for other levels to be included, just let me know! Comment on here or dm me on twitter @boss_charts and I can add the settings for you, so all you have to do is click a button and it will set it to your desired config. I want this to be a tool that is useful for heavy traders to save them time.
Additionally, in order to tell the level of the RSI and how overextended it might be, I added the setting for the RSI to change color depending on its level. Current settings are as follows:
Normal RSI (30-70) = PURPLE
Conventional Overbought/Oversold (30-20 + 70-80) = RED
1st extended (20-15 + 80-85) = PINK
2nd extended (15-10 + 85-90) = ORANGE
VERY EXTENDED (<10 + >90) = YELLOW
That way you can get an idea of how drastic a move is by the color alone. According to Dr. Cardwell, a drastic move to over/under extended can be a sign of strength.
Finally, there are the default MAs added that Mr. Cardwell defines as useful for defining the trend. These being the 9 MA and 45 EMA/WMA.
The strategy with these is to have the MAs on both price and RSI. If the 9MA is above the 45 MA on both price and RSI, then this is bullish and you can look for longs.
Conversely, if the 9 is below the 45 on both RSI and price that is bearish, and you can look for shorts.
I added the background color change for the points where the MAs cross each other, so you do not have to have the MAs fogging up your charts to know where they are relative to one another. This is similar to my MA cross indicator which contains the same functionality.
Never financial advice. Backtest it for yourself and find MA configurations that work for you.
Enjoy! Feel free to send feedback/requests whenever.
Cerca negli script per "20蒙古币兑换人民币"

Multi SMA EMA WMA HMA BB (5x8 MAs Bollinger Bands) MAX MTF - RRBMulti SMA EMA WMA HMA 4x7 Moving Averages with Bollinger Bands MAX MTF by RagingRocketBull 2019
Version 1.0
All available MAX MTF versions are listed below (They are very similar and I don't want to publish them as separate indicators):
ver 1.0: 4x7 = 28 MTF MAs + 28 Levels + 3 BB = 59 < 64
ver 2.0: 5x6 = 30 MTF MAs + 30 Levels + 3 BB = 63 < 64
ver 3.0: 3x10 = 30 MTF MAs + 30 Levels + 3 BB = 63 < 64
ver 4.0: 5(4+1)x8 = 8 CurTF MAs + 32 MTF MAs + 20 Levels + 3 BB = 63 < 64
ver 5.0: 6(5+1)x6 = 6 CurTF MAs + 30 MTF MAs + 24 Levels + 3 BB = 63 < 64
ver 6.0: 4(3+1)x10 = 10 CurTF MAs + 30 MTF MAs + 20 Levels + 3 BB = 63 < 64
Fib numbers: 8, 13, 21, 34, 55, 89, 144, 233, 377
This indicator shows multiple MAs of any type SMA EMA WMA HMA etc with BB and MTF support, can show MAs as dynamically moving levels.
There are 4 MA groups + 1 BB group, a total of 4 TFs * 7 MAs = 28 MAs. You can assign any type/timeframe combo to a group, for example:
- EMAs 9,12,26,50,100,200,400 x H1, H4, D1, W1 (4 TFs x 7 MAs x 1 type)
- EMAs 8,13,21,30,34,50,55,89,100,144,200,233,377,400 x M15, H1 (2 TFs x 14 MAs x 1 type)
- D1 EMAs and SMAs 8,13,21,30,34,50,55,89,100,144,200,233,377,400 (1 TF x 14 MAs x 2 types)
- H1 WMAs 13,21,34,55,89,144,233; H4 HMAs 9,12,26,50,100,200,400; D1 EMAs 12,26,89,144,169,233,377; W1 SMAs 9,12,26,50,100,200,400 (4 TFs x 7 MAs x 4 types)
- +1 extra MA type/timeframe for BB
There are several versions: Simple, MTF, Pro MTF, Advanced MTF, MAX MTF and Ultimate MTF. This is the MAX MTF version. The Differences are listed below. All versions have BB
- Simple: you have 2 groups of MAs that can be assigned any type (5+5)
- MTF: +2 custom Timeframes for each group (2x5 MTF) +1 TF for BB, TF XY smoothing
- Pro MTF: 4 custom Timeframes for each group (4x3 MTF), 1 TF for BB, MA levels and show max bars back options
- Advanced MTF: +4 extra MAs/group (4x7 MTF), custom Ticker/Symbols, Timeframe <>= filter, Remove Duplicates Option
- MAX MTF: +2 subtypes/group, packed to the limit with max possible MAs/TFs: 4x7, 5x6, 3x10, 4(3+1)x10, 5(4+1)x8, 6(5+1)x6
- Ultimate MTF: +individual settings for each MA, custom Ticker/Symbols
MAX MTF version tests the limits of Pinescript trying to squeeze as many MAs/TFs as possible into a single indicator.
It's basically a maxed out Advanced version with subtypes allowing for mixed types within a group (i.e. both emas and smas in a single group/TF)
Pinescript has the following limits:
- max 40 security calls (6 calls are reserved for dupe checks and smoothing, 2 are used for BB, so only 32 calls are available)
- max 64 plot outputs (BB uses 3 outputs, so only 61 plot outputs are available)
- max 50000 (50kb) size of the compiled code
Based on those limits, you can only have the following MAs/TFs combos in a single script:
1. 4x7, 5x6, 3x10 - total number of MTF MAs must always be <= 32, and you can still have BB and Num Levels = total MAs, without any compromises
2. 5(4+1)x8, 6(5+1)x6, 4(3+1)x10 - you can use the Current Symbol/Timeframe as an extra (+1) fixed TF with the same number of MTF MAs
- you don't need to call security to display MAs on the Current Symbol/Timeframe, so the total number of MTF MAs remains the same and is still <= 32
- to fit that many MAs into the max 64 plot outputs limit you need to reduce the number of levels (not every MA Group will have corresponding levels)
Features:
- 4x7 = 28 MAs of any type
- 4x MTF groups with XY step line smoothing
- +1 extra TF/type for BB MAs
- 2 MA subtypes within each group/TF
- 4x7 = 28 MA levels with adjustable group offsets, indents and shift
- supports any existing type of MA: SMA, EMA, WMA, Hull Moving Average (HMA)
- custom tickers/symbols for each group
- show max bars back option
- show/hide both groups of MAs/levels/BB and individual MAs
- timeframe filter: show only MAs/Levels with TFs <>= Current TF
- hide MAs/Levels with duplicate TFs
- support for custom TFs that are not available in free accounts: 2D, 3D etc
- support for timeframes in H: H, 2H, 4H etc
Notes:
- Uses timeframe textbox instead of input resolution dropdown to allow for 240 120 and other custom TFs
- Uses symbol textbox instead of input symbol to avoid establishing multiple dummy security connections to the current ticker - otherwise empty symbols will prevent script from running
- Possible reasons for missing MAs on a chart:
- there may not be enough bars in history to start plotting it. For example, W1 EMA200 needs at least 200 bars on a weekly chart.
- for charts with low/fractional prices i.e. 0.00002 << 0.001 (default Y smoothing step) decrease Y smoothing as needed (set Y = 0.0000001) or disable it completely (set X,Y to 0,0)
- for charts with high price values i.e. 20000 >> 0.001 increase Y smoothing as needed (set Y = 10-20). Higher values exceeding MAs point density will cause it to disappear as there will be no points to plot. Different TFs may require diff adjustments
- TradingView Replay Mode UI and Pinescript security calls are limited to TFs >= D (D,2D,W,MN...) for free accounts
- attempting to plot any TF < D1 in Replay Mode will only result in straight lines, but all TFs will work properly in history and real-time modes. This is not a bug.
- Max Bars Back (num_bars) is limited to 5000 for free accounts (10000 for paid), will show error when exceeded. To plot on all available history set to 0 (default)
- Slow load/redraw times. This indicator becomes slower, its UI less responsive when:
- Pinescript Node.js graphics library is too slow and inefficient at plotting bars/objects in a browser window. Code optimization doesn't help much - the graphics engine is the main reason for general slowness.
- the chart has a long history (10000+ bars) in a browser's cache (you have scrolled back a couple of screens in a max zoom mode).
- Reload the page/Load a fresh chart and then apply the indicator or
- Switch to another Timeframe (old TF history will still remain in cache and that TF will be slow)
- in max possible zoom mode around 4500 bars can fit on 1 screen - this also slows down responsiveness. Reset Zoom level
- initial load and redraw times after a param change in UI also depend on TF. For example: D1/W1 - 2 sec, H1/H4 - 5-6 sec, M30 - 10 sec, M15/M5 - 4 sec, M1 - 5 sec. M30 usually has the longest history (up to 16000 bars) and W1 - the shortest (1000 bars).
- when indicator uses more MAs (plots) and timeframes it will redraw slower. Seems that up to 5 Timeframes is acceptable, but 6+ Timeframes can become very slow.
- show_last=last_bars plot limit doesn't affect load/redraw times, so it was removed from MA plot
- Max Bars Back (num_bars) default/custom set UI value doesn't seem to affect load/redraw times
- In max zoom mode all dynamic levels disappear (they behave like text)
- Dupe check includes symbol: symbol, tf, both subtypes - all must match for a duplicate group
- For the dupe check to work correctly a custom symbol must always include an exchange prefix. BB is not checked for dupes
Good Luck! Feel free to learn from/reuse the code to build your own indicators.

Multi SMA EMA WMA HMA BB (4x5 MAs Bollinger Bands) Adv MTF - RRBMulti SMA EMA WMA HMA 4x5 Moving Averages with Bollinger Bands Advanced MTF by RagingRocketBull 2019
Version 1.0
This indicator shows multiple MAs of any type SMA EMA WMA HMA etc with BB and MTF support, can show MAs as dynamically moving levels.
There are 4 MA groups + 1 BB group, a total of 4 TFs * 5 MAs = 20 MAs. You can assign any type/timeframe combo to a group, for example:
- EMAs 12,26,50,100,200 x H1, H4, D1, W1 (4 TFs x 5 MAs x 1 type)
- EMAs 8,10,13,21,30,50,55,100,200,400 x M15, H1 (2 TFs x 10 MAs x 1 type)
- D1 EMAs and SMAs 8,10,12,26,30,50,55,100,200,400 (1 TF x 10 MAs x 2 types)
- H1 WMAs 7,77,89,167,231; H4 HMAs 12,26,50,100,200; D1 EMAs 89,144,169,233,377; W1 SMAs 12,26,50,100,200 (4 TFs x 5 MAs x 4 types)
- +1 extra MA type/timeframe for BB
There are several versions: Simple, MTF, Pro MTF, Advanced MTF and Ultimate MTF. This is the Advanced MTF version. The Differences are listed below. All versions have BB
- Simple: you have 2 groups of MAs that can be assigned any type (5+5)
- MTF: +2 custom Timeframes for each group (2x5 MTF) +1 TF for BB, TF XY smoothing
- Pro MTF: 4 custom Timeframes for each group (4x3 MTF), 1 TF for BB, MA levels and show max bars back options
- Advanced MTF: +2 extra MAs/group (4x5 MTF), custom Ticker/Symbols, Timeframe <>= filter, Remove Duplicates Option
- Ultimate MTF: +individual settings for each MA, custom Ticker/Symbols
Features:
- 4x5 = 20 MAs of any type
- 4x MTF groups with XY step line smoothing
- +1 extra TF/type for BB MAs
- 4x5 = 20 MA levels with adjustable group offsets, indents and shift
- supports any existing type of MA: SMA, EMA, WMA, Hull Moving Average (HMA)
- custom tickers/symbols for each group - you can compare MAs of the same symbol across exchanges
- show max bars back option
- show/hide both groups of MAs/levels/BB and individual MAs
- timeframe filter: show only MAs/Levels with TFs <>= Current TF
- hide MAs/Levels with duplicate TFs
- support for custom TFs that are not available in free accounts: 2D, 3D etc
- support for timeframes in H: H, 2H, 4H etc
Notes:
- Uses timeframe textbox instead of input resolution dropdown to allow for 240 120 and other custom TFs
- Uses symbol textbox instead of input symbol to avoid establishing multiple dummy security connections to the current ticker - otherwise empty symbols will prevent script from running
- Possible reasons for missing MAs on a chart:
- there may not be enough bars in history to start plotting it. For example, W1 EMA200 needs at least 200 bars on a weekly chart.
- price << default Y smoothing step 5. For charts with low/fractional prices (i.e. 0.00002 << 5) adjust X Y smoothing as needed (set Y = 0.0000001) or disable it completely (set X,Y to 0,0)
- TradingView Replay Mode UI and Pinescript security calls are limited to TFs >= D (D,2D,W,MN...) for free accounts
- attempting to plot any TF < D1 in Replay Mode will only result in straight lines, but all TFs will work properly in history and real-time modes. This is not a bug.
- Max Bars Back (num_bars) is limited to 5000 for free accounts (10000 for paid), will show error when exceeded. To plot on all available history set to 0 (default)
- Slow load/redraw times. This indicator becomes slower, its UI less responsive when:
- Pinescript Node.js graphics library is too slow and inefficient at plotting bars/objects in a browser window. Code optimization doesn't help much - the graphics engine is the main reason for general slowness.
- the chart has a long history (10000+ bars) in a browser's cache (you have scrolled back a couple of screens in a max zoom mode).
- Reload the page/Load a fresh chart and then apply the indicator or
- Switch to another Timeframe (old TF history will still remain in cache and that TF will be slow)
- in max possible zoom mode around 4500 bars can fit on 1 screen - this also slows down responsiveness. Reset Zoom level
- initial load and redraw times after a param change in UI also depend on TF. For example:
D1/W1 - 2 sec, H1/H4 - 5-6 sec, M30 - 10 sec, M15/M5 - 4 sec, M1 - 5 sec.
M30 usually has the longest history (up to 16000 bars) and W1 - the shortest (1000 bars).
- when indicator uses more MAs (plots) and timeframes it will redraw slower. Seems that up to 5 Timeframes is acceptable, but 6+ Timeframes can become very slow.
- show_last=last_bars plot limit doesn't affect load/redraw times, so it was removed from MA plot
- Max Bars Back (num_bars) default/custom set UI value doesn't seem to affect load/redraw times
- In max zoom mode all dynamic levels disappear (they behave like text)
1. based on 3EmaBB, uses plot*, barssince and security functions
2. you can't set certain constants from input due to Pinescript limitations - change the code as needed, recompile and use as a private version
3. Levels = trackprice implementation
4. Show Max Bars Back = show_last implementation
5. swma has a fixed length = 4, alma and linreg have additional offset and smoothing params
6. Smoothing is applied by default for visual aesthetics on MTF. To use exact ma mtf values (lines with stair stepping) - disable it
Good Luck! You can explore, modify/reuse the code to build your own indicators.

ADX +- DiThis Adx +-Di is just a complete version of what the ADX is supposed to signal.
So you have:
15 (contraction), 20 (threshold), 30 (expansion), 40 (resistance) levels.
Below 20 the price is not trending
Above 30 the price is trending
Below 15 price has been in contraction for too long
Between 20 and 30 price is in a "transition zone".
I finally added a "Resistance" level (40), which has to be adapted to best represent the historical levels where price usually encounters resistance, and where the price can be declared "overtrending", which means a return to lower levels is likely to happen.
I've chosen mild colors, and set the Adx Color to White, because I use black background, you can easily change that.
Enjoy
-Maurice

Average Directional Index with DI SpreadThis indicator converts conventional triple lined ADX, DI+ and DI- into two lines. First line is the
original ADX line and second line is obtained by subtracting DI- from DI+ which named DI Spread(DIS)
If ADX is greater than 20 there is a trend and if greater than 40 there is a strong trend but ADX does not tell
the trend direction
To determine trend direction, DIS can be used with ADX; Sımply; If DIS is greater than 0, it is an uptrend and If DIS
is less than 0, it is a downtrend.
To sum up;
If ADX is greater than 20 and especially greater than 40 with positive DIS value, this implies an uptrend.
If ADX is greater than 20 and especially greater than 40 with negative DIS value, this implies a downtrend.
*Because of coloration and reference levels used, this indicator is really simple and efficient to analyze trend direction.

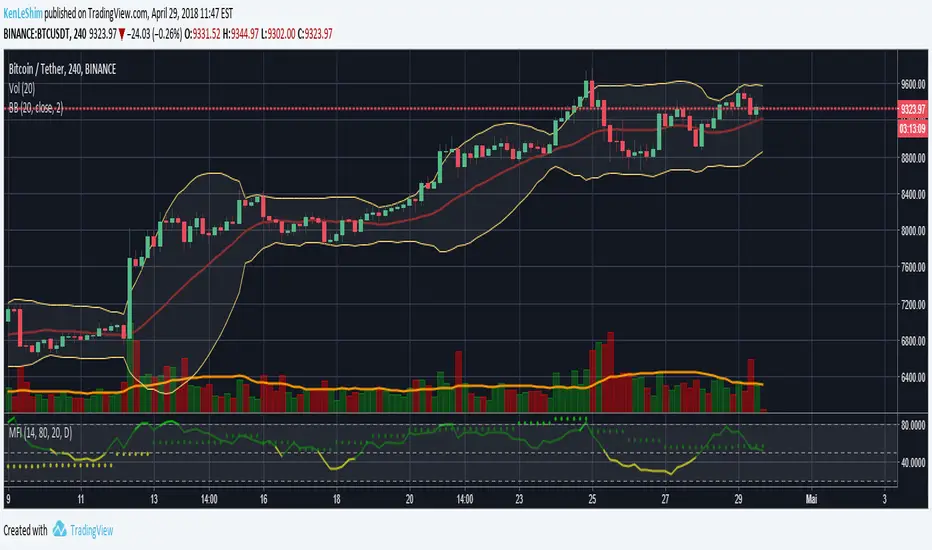
MFI Multi-TimeframeThe Money Flow Index (MFI) is an oscillating momentum and market strength indicator that was developed by Gene Quong and Avrum Soudack. It is also a leading indicator, which means it tends to lead price action, and is similar in calculation as J. Welles Wilder's Relative Strength Index (RSI) with the significant difference being that the MFI uses both price and volume. Like the RSI, the MFI is a range-bound oscillator that oscillates between zero and 100 and is interpreted in a similar way as the RSI. The ultimate aim of the MFI is to determine whether money is flowing in or out of a security over a specified look-back period.
HOW IS IT USED ?
The MFI oscillates between 0 and 100 and a security is considered overbought when its MFI rises above 80 and oversold when its MFI falls below 20. These levels are the suggested overbought and oversold levels as suggested by Quong and Soudack, though they do not suggest these levels as entry signals. Instead, these caution levels warn that the price action and the current trend have reached extremes that may be unsustainable. Quong and Soudack also recommend using the 90 and 10 lines as truly overbought and truly oversold levels respectively. MFI movements above 90 and below 10 are rare and indicate a higher level of unsustainability.
Finally, failure swings from the 20 or 80 levels can also be used to identify potential price reversals and trade entries. A failure swing occurs when the MFI moves over the overbought or oversold level but reverses back before reaching the opposite level. Thus, when the MFI crosses up over the 20 (oversold) level but reverses before it reaches the 80 (overbought) level, it indicates that the uptrend is weak and that it may reverse soon. This signals that you should cover any long positions or go short. Similarly, when the MFI crosses down over the 80 (overbought) level but reverses before it reaches the 20 (oversold) level, it indicates a weakness in the down trend and the probability that the trend will reverse. This would be a signal to close of any short positions; or a signal to long buy.
I added the possibility to add on the chart a 2nd timeframe for confirmation.
If you found this script useful, a tip is always welcome... :)
Exponential Moving Average (Set of 3) [Krypt] + 13/34 EMAsI took Krypt's script and essentially added on to it.
the 20/50/100/200 EMAs should be used together as support and resistance as normal.
Wait for price to break 200 EMA
Wait for 50 EMA to cross 200 EMA
Wait for pullback to 50 EMA to open position
20 and 100 EMAs are for extra information about moving support and resistance
and 13/34 EMAs should be used in conjunction
When 13 EMA crosses 34 EMA, open position
When price gets far from 13/34, close position (because price will attempt to revert back to mean)
This is better for scalping and swing trades than the 20/50/100/200 setup.
Twitter: @AzorAhai06

Gap Gain Test V1.0 by @overratedtraderOddball indicators for entertainment purposes only. This is best used on daily chart.
Look at the 20 ALMA to gauge likelihood of stock following its up or down gap.
- if above the 20 ALMA , follow the gap direction
- if below the 20 ALMA , take counter trend trade
If stock gaps up AND closes higher than it opens, that gain % (close/open) is colored green and if stock gaps down and closes lower than it opens, that gain % (close/open) is colored green
Conversely if the stock gaps up BUT closes lower than it opens, red and if a stop gaps down but closes higher than it opens, red.
Enjoy and follow me on twitter @overratedtrader for more nonsensical and out-of-the-box ideas.

Adaptive Donchian ChannelThis indicator adds a level of adaptivity to the simple Donchian Channel by adjusting the sensitivity (lookback periods) of the channel's upper and lower bounds based on the amount of time that has elapsed since the price has hit/expanded the channel boundaries. Comparing the results of this indicator to the standard Donchian Channel, the readier level of responsiveness may prove self-evident.
METHODOLOGY:
Specifically, the more recently the channel was expanded in one direction, the longer the lookback period grows in that direction. Conversely, if the channel has not been expanded in a given direction, the lookback period will contract so as to allow for a tighter channel.
For example, let the initial lookback period be 20 bars and let the factor argument be 0.1 (or 2 bars to start, as 20*0.1 = 2). Now say the current bar sets a new 20-period high. Then the lookback period for the upper bound is expanded by 2 bars to 22, and the lookback period for the lower bound is contracted by 2 bars to 18, thereby making it simultaneously harder to set new highs and easier to set new lows (and vice versa for hitting new lows). If neither a new high nor a new low is formed, both periods contract by the given factor.

TonyUX EMA Scalper - Buy / SellThis is a simple scalping strategy that works for all time frames... I have only tested it on FOREX
It works by checking if the price is currently in an uptrend and if it crosses the 20 EMA.
If it crosses the 20 EMA and its in and uptrend it will post a BUY SIGNAL.
If it crosses the 20 EMA and its in and down it will post a SELL SIGNAL.
The red line is the highest close of the previous 8 bars --- This is resistance
The green line is the lowest close of the previous 8 bars -- This is support

EMA_ConvergenceFirst I have to give kudos to my son who I asked to take a shot at creating this little indicator. Nice work son!
While trading, one of the things I look for is when price or certain EMA's approach another EMA. The example that I use on this 1 minute SPY chart is an 8 EMA and 20 EMA. I am looking for when the 8 and 20 are within' 3 cents of each other. Many times when they are getting close, price is approaching a top or bottom. I am looking for a candlestick reversal around that area. You may want to know when PRICE is near the 50 EMA: Use EMA 1 and 50 for that. Having it light up on top of the page, or elsewhere, makes it easier to look for the convergence when it occurs. If it lights up for a long period, price may be going sideways. I don't enter into a trade until the EMA starts separating, usually with another candlestick formation.
You are able to change the distance for convergence and two EMA's. Unfortunately you will have to adjust the convergence number up as you increase in time frames. This is designed to see when they are close, not when they cross.
The bars on top of this example are lit up purple due to the 8 and 20 EMA are within' 3 cents of each other.
If you want to overlay the price bars, instead of having it separate, just change overlay to "true"
Enjoy.

Signal Hunter Pro - GKDXLSignal Hunter Pro - GKDXL combines four powerful technical indicators with trend strength filtering and volume confirmation to generate reliable BUY/SELL signals. This indicator is perfect for traders who want a systematic approach to market analysis without the noise of conflicting signals.
🔧 Core Features
📈 Multi-Indicator Signal System
Moving Averages: EMA 20, EMA 50, and SMA 200 for trend analysis
Bollinger Bands: Dynamic support/resistance with price momentum detection
RSI: Enhanced RSI logic with smoothing and multi-zone analysis
MACD: Traditional MACD with signal line crossovers and zero-line analysis
🎛️ Advanced Filtering System
ADX Trend Strength Filter: Only signals when trend strength exceeds threshold
Volume Confirmation: Ensures signals occur with adequate volume participation
Multi-Timeframe Logic: Works on any timeframe from 1m to 1D and beyond
🚨 Intelligent Signal Generation
Requires 3 out of 4 indicators to align for signal confirmation
Separate bullish and bearish signal conditions
Real-time signal strength scoring (1/4 to 4/4)
Built-in alert system for automated notifications
⚙️ Customizable Parameters
📊 Technical Settings
Moving Averages: Adjustable EMA and SMA periods
Bollinger Bands: Configurable length and multiplier
RSI: Customizable length, smoothing, and overbought/oversold levels
MACD: Flexible fast, slow, and signal line settings
🎯 Risk Management
Risk Percentage: Set your risk per trade (0.1% to 10%)
Reward Ratio: Configure risk-to-reward ratios (1:1 to 1:5)
ADX Threshold: Control minimum trend strength requirements
🖥️ Display Options
Indicator Visibility: Toggle individual indicators on/off
Information Table: Optional detailed status table (off by default)
Volume Analysis: Real-time volume vs. average comparison
🎨 Visual Elements
📈 Chart Indicators
EMA Lines: Blue (20) and Orange (50) exponential moving averages
SMA 200: Gray long-term trend line
Bollinger Bands: Upper/lower bands with semi-transparent fill
Clean Interface: Minimal visual clutter for clear analysis
📋 Information Table (Optional)
Real-time indicator status with ✓/✗/— symbols
Current signal strength and direction
ADX trend strength measurement
Volume confirmation status
No-signal reasons when conditions aren't met
🔔 Alert System
📢 Three Alert Types
BUY Signal: Triggered when 3+ indicators align bullishly
SELL Signal: Triggered when 3+ indicators align bearishly
General Alert: Any signal detection for broader monitoring
📱 Alert Messages
Clear, actionable alert text
Includes indicator name for easy identification
Compatible with webhook integrations
🎯 How It Works
📊 Signal Logic
Indicator Assessment: Each of the 4 indicators is evaluated as Bullish/Bearish/Neutral
Consensus Building: Counts aligned indicators (minimum 3 required)
Filter Application: Applies trend strength and volume filters
Signal Generation: Generates BUY/SELL when all conditions are met
🔍 Indicator States
Moving Averages: Price position, EMA alignment, and crossovers
Bollinger Bands: Price relative to bands and momentum shifts
RSI: Multi-zone analysis with momentum and crossover detection
MACD: Signal line crossovers and zero-line positioning
🎉 Why Choose Signal Hunter Pro?
✅ Multi-Indicator Confirmation reduces false signals
✅ Trend Strength Filtering improves win rate
✅ Volume Confirmation ensures market participation
✅ Customizable Parameters adapt to any trading style
✅ Clean Visual Design doesn't clutter your charts
✅ Professional Alert System for automated trading
✅ No Repainting - reliable historical signals
✅ Works on All Timeframes from scalping to investing

Setup Cripto EMA + Volume//@version=5 indicator("Sinais Multi-Cripto – EMA+Volume (BTC/ETH/BNB/SOL/XRP)", overlay=false)
// Inputs emaFast = input.int(50, "EMA Curta") emaSlow = input.int(200, "EMA Longa") emaPull = input.int(20, "EMA Pullback") volLen = input.int(20, "Média Volume")
symBTC = input.symbol(defval="BINANCE:BTCUSDT", title="BTC") symETH = input.symbol(defval="BINANCE:ETHUSDT", title="ETH") symBNB = input.symbol(defval="BINANCE:BNBUSDT", title="BNB") symSOL = input.symbol(defval="BINANCE:SOLUSDT", title="SOL") symXRP = input.symbol(defval="BINANCE:XRPUSDT", title="XRP")
f_sig(sym) => c = request.security(sym, timeframe.period, close) v = request.security(sym, timeframe.period, volume) e50 = ta.ema(c, emaFast) e200 = ta.ema(c, emaSlow) e20 = ta.ema(c, emaPull) vma = ta.sma(v, volLen) long = (e50 > e200) and (c > e20) and (v > vma) short = (e50 < e200) and (c < e20) and (v > vma)
= f_sig(symBTC) = f_sig(symETH) = f_sig(symBNB) = f_sig(symSOL) = f_sig(symXRP)
// Exibição plotchar(btcL, title="BTC Long", char="▲", location=location.top) plotchar(btcS, title="BTC Short", char="▼", location=location.bottom) plotchar(ethL, title="ETH Long", char="▲", location=location.top) plotchar(ethS, title="ETH Short", char="▼", location=location.bottom) plotchar(bnbL, title="BNB Long", char="▲", location=location.top) plotchar(bnbS, title="BNB Short", char="▼", location=location.bottom) plotchar(solL, title="SOL Long", char="▲", location=location.top) plotchar(solS, title="SOL Short", char="▼", location=location.bottom) plotchar(xrpL, title="XRP Long", char="▲", location=location.top) plotchar(xrpS, title="XRP Short", char="▼", location=location.bottom)

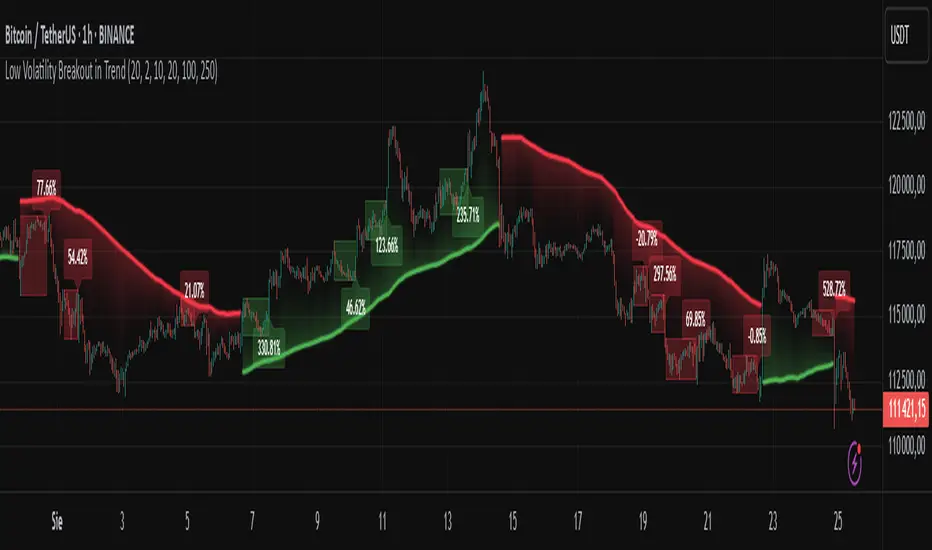
Low Volatility Breakout in Trend
█ OVERVIEW
"Low Volatility Breakout in Trend" is a technical analysis tool that identifies periods of low-volatility consolidation within an ongoing trend and signals potential breakouts aligned with the trend's direction. The indicator detects trends using a simple moving average (SMA) of price, identifies consolidation zones based on the size of candle bodies, and displays the percentage change in volume (volume delta) at the breakout moment.
█ CONCEPTS
The core idea of the indicator is to pinpoint moments where traders can join an ongoing trend by capitalizing on breakouts from consolidation zones, supported by additional information such as volume delta. It provides clear visualizations of trends, consolidation zones, and breakout signals to facilitate trading decisions.
Why Use It?
* Breakout Identification: The indicator locates low-volatility consolidation zones (measured by the size of individual candle bodies, not the price range of the consolidation) and signals breakouts, enabling traders to join the trend at key moments.
* Volume Analysis: Displays the percentage change in volume (delta) relative to its simple moving average, providing insight into market activity rather than acting as a signal filter.
* Visual Clarity: Colored trend lines, consolidation boxes (drawn only after the breakout candle closes, not on subsequent candles), and volume delta labels enable quick chart analysis.
* Flexibility: Adjustable parameters, such as the volatility window length or SMA period, allow customization for various trading strategies and markets.
How It Works
* Trend Detection: The indicator calculates a simple moving average (SMA) of price (default: based on the midpoint of high/low) and creates dynamic trend bands, offset by a percentage of the average candle height (band scaling). A price above the upper band signals an uptrend, while a price below the lower band indicates a downtrend. Trend changes occur not when the price crosses the SMA but when it crosses above the upper band or below the lower band (offset by the average candle height multiplied by the scaling factor).
* Consolidation Identification: Identifies low-volatility zones when the candle body size is smaller than the average body size over a specified period (default: 20 candles) multiplied by a volatility threshold — the maximum allowable body size as a percentage of the average body (e.g., 2 means the candle body must be less than twice the average body to be considered low-volatility).
* Breakout Signals: A breakout occurs when the candle body exceeds the volatility threshold, is larger than the maximum body in the consolidation, and aligns with the trend direction (bullish in an uptrend, bearish in a downtrend).
* Visualization: Draws a trend line with a gradient, consolidation boxes (appearing only after the breakout candle closes, marking the consolidation zone), and volume delta labels. Optionally displays breakout signal arrows.
* Signals and Alerts: The indicator generates signals for bullish and bearish breakouts, including the volume delta percentage. Alerts are an additional feature that can be enabled for notifications.
Settings and Customization
* Volatility Window: Length of the period for calculating the average candle body size (default: 20).
* Volatility Threshold: Maximum candle body size as a percentage of the average body (default: 2).
* Minimum Consolidation Bars: Number of candles required for a consolidation (default: 10).
* SMA Length for Trend: Period of the SMA for trend detection (default: 100).
* Band Scaling: Offset of trend bands as a percentage of the average candle height (default: 250%), determining the distance from the SMA.
* Visualization Options: Enable/disable consolidation boxes (Show Consolidation Boxes, drawn after the breakout candle closes), volume delta labels (Show Volume Delta Labels), and breakout signals (Show Breakout Signals, e.g., triangles).
* Colors: Customize colors for the trend line, consolidation boxes, and volume delta labels.
█ OTHER SECTIONS
Usage Examples
* Joining an Uptrend: When the price breaks out of a consolidation in an uptrend with a volume delta of +50%, open a long position; the signal is stronger if the breakout candle surpasses a local high.
* Avoiding False Breakouts: Ignore breakout signals with low volume delta (e.g., below 0%) and combine the indicator with other tools (e.g., support/resistance levels or oscillators) to confirm moves in low-activity zones.
Notes for Users
* On markets that do not provide volume data, the indicator will not display volume delta — disable volume labels and enable breakout signals (e.g., triangles) instead.
* Adjust parameters to suit the market's characteristics to minimize noise.
* Combine with other tools, such as Fibonacci levels or oscillators, for greater precision.
Instant Breakout Strategy with RSI & VWAPInstant Breakout Strategy with RSI & VWAP
This TradingView strategy (Pine Script v6) trades breakouts using pivot points, with optional filters for volume, momentum, RSI, and VWAP. It’s optimized for the 1-second timeframe.
Overview
The strategy identifies breakouts when price crosses above resistance (pivot highs) or below support (pivot lows). It can use basic pivot breakouts or add filters for stronger signals. Take-profit and stop-loss levels are set using ATR, and signals are shown on the chart.
Inputs
Left/Right Pivot Bars: Bars to detect pivots (default: 3). Lower values increase sensitivity.
Volume Surge Multiplier: Volume threshold vs. 20-period average (default: 1.5).
Momentum Threshold: Minimum % price change from bar open (default: 1%).
Take-Profit ATR Multiplier: ATR multiplier for take-profit (default: 9.0).
Stop-Loss ATR Multiplier: ATR multiplier for stop-loss (default: 1.0).
Use Filters: Enable/disable volume, momentum, RSI, and VWAP filters (default: off).
How It Works
1. Pivot Detection
Finds pivot highs (resistance) and lows (support) using ta.pivothigh and ta.pivotlow.
Tracks the latest pivot levels.
2. Volume Surge
Compares current volume to a 20-period volume average.
A surge occurs if volume exceeds the average times the multiplier.
3. Momentum
Measures price change from the bar’s open.
Bullish: Price rises >1% from open.
Bearish: Price falls >1% from open.
4. RSI and VWAP
RSI: 3-period RSI. Above 50 is bullish; below 50 is bearish.
VWAP: Price above VWAP is bullish; below is bearish.
5. ATR
14-period ATR sets take-profit (close ± atr * 9.0) and stop-loss (close ± atr * 1.0).
Trading Rules
Breakout Conditions
Bullish Breakout:
Price crosses above the latest pivot high.
With filters: Volume surge, bullish momentum, RSI > 50, price > VWAP.
Without filters: Only the crossover is needed.
Bearish Breakout:
Price crosses below the latest pivot low.
With filters: Volume surge, bearish momentum, RSI < 50, price < VWAP.
Without filters: Only the crossunder is needed.
Entries and Exits
Long: Enter on bullish breakout. Set take-profit and stop-loss. Close any short position.
Short: Enter on bearish breakout. Set take-profit and stop-loss. Close any long position.
Visuals
Signals: Green triangles (bullish) below bars, red triangles (bearish) above bars.
Pivot Levels: Green line (resistance), red line (support).
Indicators: RSI (blue, separate pane), VWAP (purple, on chart).
How to Use
Apply to a 1-second chart in TradingView for best results.
Adjust inputs (e.g., pivot bars, multipliers). Enable filters for stricter signals.
Watch for buy/sell triangles and monitor RSI/VWAP.
Use ATR-based take-profit/stop-loss for risk management.
Notes
Best on 1-second timeframe due to fast RSI and responsiveness.
Disable filters for more signals (less confirmation).
Backtest before live trading to check performance.
This strategy uses pivots, volume, momentum, RSI, and VWAP for clear breakout trades on the 1-second timeframe.

Master Candle# Master Candle Indicator
## Overview
The Master Candle Indicator identifies and highlights significant price consolidation patterns where multiple candles trade within the high-low range of a single "master" candle. This technical analysis tool helps traders spot potential breakout zones and key support/resistance levels.
## What is a Master Candle?
A Master Candle is a candlestick that contains 4 or more subsequent candles completely within its high-low range. These formations often indicate:
- Market consolidation phases
- Potential breakout areas
- Strong support and resistance levels
- Areas of price compression before significant moves
## Features
✅ **Automatic Detection**: Scans historical data to identify Master Candle patterns
✅ **Visual Highlighting**: Draws colored boxes around detected Master Candles
✅ **Customizable Parameters**: Adjust minimum candles required (2-20)
✅ **Candle Counter**: Shows exact number of candles contained within each Master Candle
✅ **Performance Optimized**: Efficient lookback system with memory management
✅ **Clean Interface**: Non-intrusive visual design that doesn't clutter charts
## How to Use
1. Add the indicator to your chart
2. Adjust the "Minimum candles inside" parameter (default: 4)
3. Set the lookback period for historical scanning (default: 50)
4. Master Candles will be automatically highlighted with colored boxes
5. Use these levels as potential support/resistance zones for your trading strategy
## Settings
- **Minimum candles inside**: Set how many candles must be contained (2-20)
- **Lookback period**: How far back to scan for patterns (10-200 bars)
## Educational Purpose
This indicator is designed for educational and analysis purposes. It helps traders:
- Understand market consolidation patterns
- Identify potential breakout zones
- Recognize key support and resistance areas
- Improve market structure analysis skills
## Technical Details
- Compatible with all timeframes
- Works on any trading instrument
- Optimized for performance with automatic memory management
- Uses historical data analysis for pattern detection
## Important Notes
- This indicator is for educational and analytical purposes only
- Past patterns do not guarantee future results
- Always combine with other analysis tools
- Practice proper risk management in your trading
- Not financial advice - for educational use only

FlowStateTrader FlowState Trader - Advanced Time-Filtered Strategy
## Overview
FlowState Trader is a sophisticated algorithmic trading strategy that combines precision entry signals with intelligent time-based filtering and adaptive risk management. Built for traders seeking to achieve their optimal performance state, FlowState identifies high-probability trading opportunities within user-defined time windows while employing dynamic trailing stops and partial position management.
## Core Strategy Philosophy
FlowState Trader operates on the principle that peak trading performance occurs when three elements align: **Focus** (precise entry signals), **Flow** (optimal time windows), and **State** (intelligent position management). This strategy excels at finding reversal opportunities at key support and resistance levels while filtering out suboptimal trading periods to keep traders in their optimal flow state.
## Key Features
### 🎯 Focus Entry System
**Support/Resistance Zone Trading**:
- Dynamic identification of key price levels using configurable lookback periods
- Entry signals triggered when price interacts with these critical zones
- Volume confirmation ensures genuine breakout/reversal momentum
- Trend filter alignment prevents counter-trend disasters
**Entry Conditions**:
- **Long Signals**: Price closes above support buffer, touches support level, with above-average volume
- **Short Signals**: Price closes below resistance buffer, touches resistance level, with above-average volume
- Optional trend filter using EMA or SMA for directional bias confirmation
### ⏰ FlowState Time Filtering System
**Comprehensive Time Controls**:
- **12-Hour Format Trading Windows**: User-friendly AM/PM time selection
- **Multi-Timezone Support**: UTC, EST, PST, CST with automatic conversion
- **Day-of-Week Filtering**: Trade only weekdays, weekends, or both
- **Lunch Hour Avoidance**: Automatically skips low-volume lunch periods (12-1 PM)
- **Visual Time Indicators**: Background coloring shows active/inactive trading periods
**Smart Time Features**:
- Handles overnight trading sessions seamlessly
- Prevents trades during historically poor performance periods
- Customizable trading hours for different market sessions
- Real-time trading window status in dashboard
### 🛡️ Adaptive Risk Management
**Multi-Level Take Profit System**:
- **TP1**: First profit target with optional partial position closure
- **TP2**: Final profit target for remaining position
- **Flexible Scaling**: Choose number of contracts to close at each level
**Dynamic Trailing Stop Technology**:
- **Three Operating Modes**:
- **Conservative**: Earlier activation, tighter trailing (protect profits)
- **Balanced**: Optimal risk/reward balance (recommended)
- **Aggressive**: Later activation, wider trailing (let winners run)
- **ATR-Based Calculations**: Adapts to current market volatility
- **Automatic Activation**: Engages when position reaches profitability threshold
### 📊 Intelligent Position Sizing
**Contract-Based Management**:
- Configurable entry quantity (1-1000 contracts)
- Partial close quantities for profit-taking
- Clear position tracking and P&L monitoring
- Real-time position status updates
### 🎨 Professional Visualization
**Enhanced Chart Elements**:
- **Entry Zone Highlighting**: Clear visual identification of trading opportunities
- **Dynamic Risk/Reward Lines**: Real-time TP and SL levels with price labels
- **Trailing Stop Visualization**: Live tracking of adaptive stop levels
- **Support/Resistance Lines**: Key level identification
- **Time Window Background**: Visual confirmation of active trading periods
**Dual Dashboard System**:
- **Strategy Dashboard**: Real-time position info, settings status, and current levels
- **Performance Scorecard**: Live P&L tracking, win rates, and trade statistics
- **Customizable Sizing**: Small, Medium, or Large display options
### ⚙️ Comprehensive Customization
**Core Strategy Settings**:
- **Lookback Period**: Support/resistance calculation period (5-100 bars)
- **ATR Configuration**: Period and multipliers for stops/targets
- **Reward-to-Risk Ratios**: Customizable profit target calculations
- **Trend Filter Options**: EMA/SMA selection with adjustable periods
**Time Filter Controls**:
- **Trading Hours**: Start/end times in 12-hour format
- **Timezone Selection**: Four major timezone options
- **Day Restrictions**: Weekend-only, weekday-only, or unrestricted
- **Session Management**: Lunch hour avoidance and custom periods
**Risk Management Options**:
- **Trailing Stop Modes**: Conservative/Balanced/Aggressive presets
- **Partial Close Settings**: Enable/disable with custom quantities
- **Alert System**: Comprehensive notifications for all trade events
### 📈 Performance Tracking
**Real-Time Metrics**:
- Net profit/loss calculation
- Win rate percentage
- Profit factor analysis
- Maximum drawdown tracking
- Total trade count and breakdown
- Current position P&L
**Trade Analytics**:
- Winner/loser ratio tracking
- Real-time performance scorecard
- Strategy effectiveness monitoring
- Risk-adjusted return metrics
### 🔔 Alert System
**Comprehensive Notifications**:
- Entry signal alerts with price and quantity
- Take profit level hits (TP1 and TP2)
- Stop loss activations
- Trailing stop engagements
- Position closure notifications
## Strategy Logic Deep Dive
### Entry Signal Generation
The strategy identifies high-probability reversal points by combining multiple confirmation factors:
1. **Price Action**: Looks for price interaction with key support/resistance levels
2. **Volume Confirmation**: Ensures sufficient market interest and liquidity
3. **Trend Alignment**: Optional filter prevents counter-trend positions
4. **Time Validation**: Only trades during user-defined optimal periods
5. **Zone Analysis**: Entry occurs within calculated buffer zones around key levels
### Risk Management Philosophy
FlowState Trader employs a three-tier risk management approach:
1. **Initial Protection**: ATR-based stop losses set at strategy entry
2. **Profit Preservation**: Trailing stops activate once position becomes profitable
3. **Scaled Exit**: Partial profit-taking allows for both security and potential
### Time-Based Edge
The time filtering system recognizes that not all trading hours are equal:
- Avoids low-volume, high-spread periods
- Focuses on optimal liquidity windows
- Prevents trading during news events (lunch hours)
- Allows customization for different market sessions
## Best Practices and Optimization
### Recommended Settings
**For Scalping (1-5 minute charts)**:
- Lookback Period: 10-20
- ATR Period: 14
- Trailing Stop: Conservative mode
- Time Filter: Major session hours only
**For Day Trading (15-60 minute charts)**:
- Lookback Period: 20-30
- ATR Period: 14-21
- Trailing Stop: Balanced mode
- Time Filter: Extended trading hours
**For Swing Trading (4H+ charts)**:
- Lookback Period: 30-50
- ATR Period: 21+
- Trailing Stop: Aggressive mode
- Time Filter: Disabled or very broad
### Market Compatibility
- **Forex**: Excellent for major pairs during active sessions
- **Stocks**: Ideal for liquid stocks during market hours
- **Futures**: Perfect for index and commodity futures
- **Crypto**: Effective on major cryptocurrencies (24/7 capability)
### Risk Considerations
- **Market Conditions**: Performance varies with volatility regimes
- **Timeframe Selection**: Lower timeframes require tighter risk management
- **Position Sizing**: Never risk more than 1-2% of account per trade
- **Backtesting**: Always test on historical data before live implementation
## Educational Value
FlowState serves as an excellent learning tool for:
- Understanding support/resistance trading
- Learning proper time-based filtering
- Mastering trailing stop techniques
- Developing systematic trading approaches
- Risk management best practices
## Disclaimer
This strategy is for educational and informational purposes only. Past performance does not guarantee future results. Trading involves substantial risk of loss and is not suitable for all investors. Users should thoroughly backtest the strategy and understand all risks before live trading. Always use proper position sizing and never risk more than you can afford to lose.
---
*FlowState Trader represents the evolution of systematic trading - combining classical technical analysis with modern risk management and intelligent time filtering to help traders achieve their optimal performance state through systematic, disciplined execution.*

Smarter Money Concepts - Wyckoff Springs & Upthrusts [PhenLabs]📊Smarter Money Concepts - Wyckoff Springs & Upthrusts
Version: PineScript™v6
📌Description
Discover institutional manipulation in real-time with this advanced Wyckoff indicator that detects Springs (accumulation phases) and Upthrusts (distribution phases). It identifies when price tests support or resistance on high volume, followed by a strong recovery, signaling potential reversals where smart money accumulates or distributes positions. This tool solves the common problem of missing these subtle phase transitions, helping traders anticipate trend changes and avoid traps in volatile markets.
By combining volume spike detection, ATR-normalized recovery strength, and a sigmoid probability model, it filters out weak signals and highlights only high-confidence setups. Whether you’re swing trading or day trading, this indicator provides clear visual cues to align with institutional flows, improving entry timing and risk management.
🚀Points of Innovation
Sigmoid-based probability threshold for signal filtering, ensuring only statistically significant Wyckoff patterns trigger alerts
ATR-normalized recovery measurement that adapts to market volatility, unlike static recovery checks in traditional indicators
Customizable volume spike multiplier to distinguish institutional volume from retail noise
Integrated dashboard legend with position and size options for personalized chart visualization
Hidden probability plots for advanced users to analyze underlying math without chart clutter
🔧Core Components
Support/Resistance Calculator: Scans a user-defined lookback period to establish dynamic levels for Spring and Upthrust detection
Volume Spike Detector: Compares current volume to a 10-period SMA, multiplied by a configurable factor to identify significant surges
Recovery Strength Analyzer: Uses ATR to measure price recovery after breaks, normalizing for different market conditions
Probability Model: Applies sigmoid function to combine volume and recovery data, generating a confidence score for each potential signal
🔥Key Features
Spring Detection: Spots accumulation when price dips below support but recovers strongly, helping traders enter longs at potential bottoms
Upthrust Detection: Identifies distribution when price spikes above resistance but falls back, alerting to possible short opportunities at tops
Customizable Inputs: Adjust lookback, volume multiplier, ATR period, and probability threshold to match your trading style and market
Visual Signals: Clear + (green) and - (red) labels on charts for instant recognition of accumulation and distribution phases
Alert System: Triggers notifications for signals and probability thresholds, keeping you informed without constant monitoring
🎨Visualization
Spring Signal: Green upward label (+) below the bar, indicating strong recovery after support break for accumulation
Upthrust Signal: Red downward label (-) above the bar, showing failed breakout above resistance for distribution
Dashboard Legend: Customizable table explaining signals, positioned anywhere on the chart for quick reference
📖Usage Guidelines
Core Settings
Support/Resistance Lookback
Default: 20
Range: 5-50
Description: Sets bars back for S/R levels; lower for recent sensitivity, higher for stable long-term zones – ideal for spotting Wyckoff phases
Volume Spike Multiplier
Default: 1.5
Range: 1.0-3.0
Description: Multiplies 10-period volume SMA; higher values filter to significant spikes, confirming institutional involvement in patterns
ATR for Recovery Measurement
Default: 5
Range: 2-20
Description: ATR period for recovery strength; shorter for volatile markets, longer for smoother analysis of post-break recoveries
Phase Transition Probability Threshold
Default: 0.9
Range: 0.5-0.99
Description: Minimum sigmoid probability for signals; higher for strict filtering, ensuring only high-confidence Wyckoff setups
Display Settings
Dashboard Position
Default: Top Right
Range: Various positions
Description: Places legend table on chart; choose based on layout to avoid overlapping price action
Dashboard Text Size
Default: Normal
Range: Auto to Huge
Description: Adjusts legend text; larger for visibility, smaller for minimal space use
✅Best Use Cases
Swing Trading: Identify Springs for long entries in downtrends turning to accumulation
Day Trading: Catch Upthrusts for short scalps during intraday distribution at resistance
Trend Reversal Confirmation: Use in conjunction with other indicators to validate phase shifts in ranging markets
Volatility Plays: Spot signals in high-volume environments like news events for quick reversals
⚠️Limitations
May produce false signals in low-volume or sideways markets where volume spikes are unreliable
Depends on historical data, so performance varies in unprecedented market conditions or gaps
Probability model is statistical, not predictive, and cannot account for external factors like news
💡What Makes This Unique
Probability-Driven Filtering: Sigmoid model combines multiple factors for superior signal quality over basic Wyckoff detectors
Adaptive Recovery: ATR normalization ensures reliability across assets and timeframes, unlike fixed-threshold tools
User-Centric Design: Tooltips, customizable dashboard, and alerts make it accessible yet powerful for all trader levels
🔬How It Works
Calculate S/R Levels:
Uses the highest high and the lowest low over the lookback period to set dynamic zones
Establishes baseline for detecting breaks in Wyckoff patterns
Detect Breaks and Recovery:
Checks for price breaking support/resistance, then recovering on volume
Measures recovery strength via ATR for volatility adjustment
Apply Probability Model:
Combines volume spike and recovery into a sigmoid function for confidence score
Triggers signal only if above threshold, plotting visuals and alerts
💡Note:
For optimal results, combine with price action analysis and test settings on historical charts. Remember, Wyckoff patterns are most effective in trending markets – use lower probability thresholds for practice, then increase for live trading to focus on high-quality setups.

Range Percent Histogram📌 Range Percent Histogram – Indicator Description
The Range Percent Histogram is a custom indicator that behaves like a traditional volume histogram, but instead of showing traded volume it displays the percentage range of each candle.
In other words, the height of each bar represents how much the price moved (in percentage terms) within that candle, from its low to its high.
🔧 What it shows
The indicator has two main components:
Component Description
Histogram Bars Columns plotted in red or green depending on the candle direction (green = bullish candle, red = bearish). The height of each bar = (high - low) / low * 100. That means a candle that moved, for example, 1 % from its lowest point to its highest point will show a bar with 1 % height.
Moving Average (optional) A 20-period Simple Moving Average applied directly to the bar values. It can be turned ON/OFF via a checkbox and helps you detect whether current range activity is above or below the average range of the past candles.
⚙️ How it works
Every time a new candle closes, the indicator calculates its range and converts it into a percentage.
This value is drawn as a column under the chart.
If the closing price is above the opening price → the bar is green (bullish range).
If the closing price is below the opening price → the bar is red (bearish range).
When the Show Moving Average option is enabled, a smooth line is plotted on top of the histogram representing the average percentage range of the last 20 candles.
📈 How to use it
This indicator is very helpful for detecting moments of range expansion or contraction.
One powerful way to use it is similar to a volume exhaustion / low-volume pattern:
Situation Interpretation
Consecutive bars with very low height Price is in a period of low volatility → possible accumulation or "pause" phase.
A sudden large bar after a series of small ones Indicates a strong pickup in volatility → often marks the start of a new impulse in the direction of the breakout.

RRG Relative Strength# RRG Relative Strength (RRG RS)
Compare any symbol to a benchmark using two RRG-style lines: **RS-Ratio** (trend of relative strength) and **RS-Momentum** (momentum of that trend). Both are centered at **100**:
- **RS-Ratio > 100** → outperforming the benchmark
- **RS-Ratio < 100** → underperforming
- **RS-Momentum** often **leads** RS-Ratio (crosses 100 earlier)
# How it works
1) Relative Strength (RS): RS = Close(symbol) / Close(benchmark)
2) Normalize around 100: smooth RS with EMA and divide RS by that EMA
3) RS-Ratio: EMA( RS / EMA(RS, Length), LenSmooth ) * 100
4) RS-Momentum: RS-Ratio / EMA(RS-Ratio, LenSmooth) * 100
# Inputs
- Length (default 14): normalization window for RS
- Length Smooth (default 20): smoothing window for RS-Ratio & RS-Momentum
# Benchmark (auto)
- US: SP:SPX (S&P 500)
- Vietnam: HOSE:VNINDEX
- Crypto: INDEX:BTCUSD
(Modify the mapping if needed, or replace with your own input.symbol().)
# How to read
- Improving: RS-Momentum crosses above 100 while RS-Ratio turns up
- Leading: RS-Ratio > 100 with RS-Momentum ≥ 100
- Weakening: RS-Momentum drops below 100; RS-Ratio often follows
# Timeframes & presets
- Works on Daily and Weekly charts
- Daily (fast): 14 / 20
- Approx. weekly behavior on Daily: 50 / 60
Note: Values usually hover near 100 (e.g., ~90–110) but are not strictly bounded. Ensure your symbol and benchmark trade in comparable sessions/currencies.

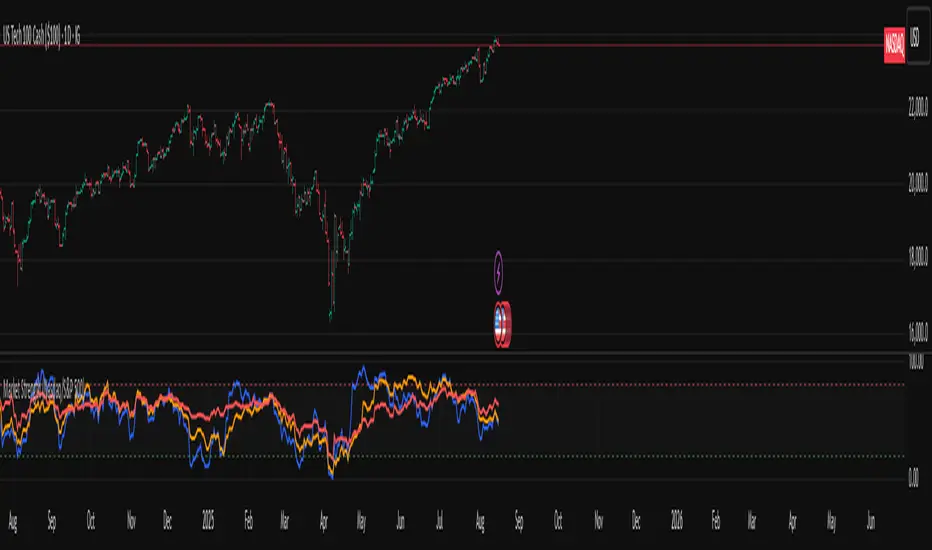
Market Internal Strength (Nasdaq/S&P 500)### Summary
This indicator is a versatile tool designed to measure the "internal health" or "market breadth" of a major stock index. Instead of just looking at the index's price, it analyzes the percentage of its constituent stocks that are participating in the trend. Users can easily switch between the **Nasdaq 100** and the **S&P 500** directly from the settings.
The data is displayed as an oscillator (scaled 0-100), similar to the RSI, making it intuitive to identify broad market **Overbought** and **Oversold** conditions and spot potential **Divergences** against the index price.
---
### What does it measure?
The indicator plots three lines based on the selected index's market breadth data:
* **% > 20D MA (Blue Line):** The percentage of stocks trading above their 20-day moving average (short-term trend).
* **% > 50D MA (Orange Line):** The percentage of stocks trading above their 50-day moving average (medium-term trend).
* **% > 200D MA (Red Line):** The percentage of stocks trading above their 200-day moving average (long-term trend).
---
### How to Use and Interpret
**1. Overbought / Oversold Conditions:**
* **Approaching the Overbought Zone (Value > 80):** This indicates that a very high number of stocks are in an uptrend, suggesting the market may be overheated or in a state of "Greed." This can signal a potential pullback or consolidation ahead.
* **Approaching the Oversold Zone (Value < 20):** This indicates that a large number of stocks have been sold off heavily, suggesting the market may be in a state of "Extreme Fear." This could present an opportunity for a technical rebound.
**2. Trend Confirmation:**
* When an index (e.g., QQQ or SPY) is making new highs and the **% > 200D MA** line is also rising, it confirms that the uptrend is healthy and broadly supported by the majority of stocks.
**3. Divergence Signals:**
* **Bearish Divergence:** If the index price reaches a new high but the indicator (especially the 50D and 200D lines) forms a lower high, it's a warning sign. This suggests that fewer stocks are participating in the rally and the trend's foundation is weakening, which could precede a reversal.
* **Bullish Divergence:** Conversely, if the index price makes a new low but the indicator forms a higher low, it signals that selling pressure is exhausting. Fewer stocks are making new lows, which could be an early sign of a potential bottom and a reversal to the upside.
---
### Settings
* **Index:** Choose between the "Nasdaq 100" and "S&P 500" as your data source.
* **Timeframe:** Allows you to select the data's timeframe (Daily "D" is recommended as the minimum).
* **Overbought/Oversold Level:** Lets you customize the threshold for the OB/OS zones.
* **Line Visibility:** You can toggle the visibility of each of the three lines.
Nasdaq 100 Internal Strength### Summary
This indicator is designed to measure the "health" or "internal strength" of the Nasdaq 100 index. Instead of just looking at the index's price, it analyzes whether the majority of its constituent stocks are participating in the trend. The data is displayed as an oscillator (scaled 0-100), similar to the RSI, making it easy to identify broad market Overbought and Oversold conditions.
This tool is ideal for traders and investors who want a deeper perspective on market dynamics, helping to confirm trend strength or spot early warning signs of a potential reversal.
---
### What does it measure?
The indicator plots three lines based on the market breadth data for the Nasdaq 100 index:
* **% > 20D MA (Blue Line):** The percentage of Nasdaq 100 stocks trading above their 20-day moving average (short-term trend).
* **% > 50D MA (Orange Line):** The percentage of Nasdaq 100 stocks trading above their 50-day moving average (medium-term trend).
* **% > 200D MA (Red Line):** The percentage of Nasdaq 100 stocks trading above their 200-day moving average (long-term trend).
---
### How to Use and Interpret
**Overbought / Oversold Conditions:**
* **Approaching the Overbought Zone (Value > 80):** This indicates that a very high number of stocks are in an uptrend, suggesting the market may be overheated or in a state of "Greed." This can signal a potential pullback or consolidation ahead.
* **Approaching the Oversold Zone (Value < 20):** This indicates that a large number of stocks have been sold off heavily, suggesting the market may be in a state of "Extreme Fear." This could present an opportunity for a technical rebound.
**Trend Confirmation:**
* When the index (e.g., QQQ) is making new highs, and the `% > 200D MA` line is also rising and making new highs, it confirms that the uptrend is healthy and broadly supported by the majority of stocks.
**Divergence Signals:**
* **Bearish Divergence:** If the index price reaches a new high, but the indicator (especially the 50D and 200D lines) fails to reach a new high and forms a lower high instead, it's a warning sign. This suggests that fewer stocks are participating in the rally, and the trend's foundation is weakening, which could precede a reversal.
* **Bullish Divergence:** Conversely, if the index price makes a new low, but the indicator forms a higher low, it signals that selling pressure is exhausting. Fewer stocks are making new lows, which could be an early sign of a potential bottom and a reversal to the upside.
---
### Settings
* **Timeframe:** Allows you to select the data's timeframe (using the Daily "D" timeframe is recommended).
* **Overbought/Oversold Level:** Lets you customize the threshold for the OB/OS zones.
* **Show Lines:** You can toggle the visibility of each of the three lines.

Marcius Studio® - Trend Detector™Trend Detector™ — is an advanced trend detection indicator that combines statistical Z-Score analysis with a simplified ADF stationarity test .
It is designed to help traders identify strong directional moves while filtering out noise and false signals.
Unlike traditional moving average crossovers or momentum oscillators, this tool evaluates both trend direction and trend strength , giving you a clear visual overview of market conditions.
Important! This indicator is intended for educational and informational purposes . It does not guarantee future performance and should be used together with proper risk management.
Idea
Markets spend 70–80% of the time in consolidation and only 20–30% in trending phases . The key to profitable trading is spotting when a major trend shift begins. Trend Detector™ was built exactly for this purpose — to filter noise and highlight true trend reversals.
How It Works
Calculates the Z-Score of price to detect extreme deviations from the mean.
Applies a simplified ADF t-Statistic test to confirm trend validity.
Uses an ATR-based ribbon for clean visualization of bullish/bearish phases.
Generates Buy/Sell signals when trend switches are confirmed.
Displays an Info Panel with real-time metrics: Z-Score, ADF t-Stat, Trend Strength (0–100), ATR % of price.
Features
Trend Ribbon : visually highlights bullish, bearish, or neutral phases.
Confirmation Filter : avoids false flips by requiring multiple bars of validation.
Strength Score : quantifies how powerful the current trend is.
Signal Markers : “BUY” and “SELL” alerts appear directly on the chart.
Customizable Alerts : get notified when new uptrends or downtrends are detected.
Recommendations
Works well on swing trading timeframes (1H, 4H, Daily).
Use in combination with support/resistance zones or volume profile tools for higher accuracy.
The higher the Trend Strength Score , the more reliable the trend continuation.
Indicator Settings
Analysis Period : number of bars for Z-Score & ADF test.
ATR Length : used for ribbon visualization.
Min Bars to Confirm Trend : filters false trend flips.
Show/Hide options for Ribbon, Signals, and Info Panel.
Example Settings
Timeframe : 1H or 4H
Analysis Period : 20
ATR Length : 14
Min Confirmation Bars : 2–3
Disclaimer
Trading and investing involve risk — always do your own research (DYOR) and seek professional advice. We are not responsible for any financial losses.
