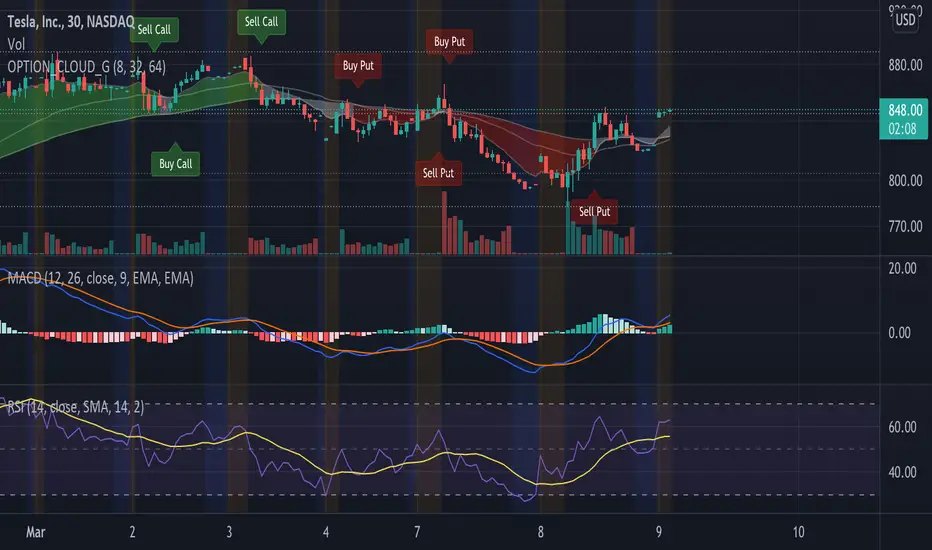
EMA Options Clouds With SignalsEMA Clouds for Options!
This indicator can help you confidently open and close options positions. Note that you should set stop a little below midline EMA . Risk reward for good signals is fairly consistent in profit. Most of the simulations I ran got between 1:2 and 1:4 profits. The losers usually can be avoided by making sure you are not in a choppy trading channel. Wait for EMAs to start separating and don't blindly follow every buy/sell.
3 wave EMA + Clouds:
Defaults:
EMA 8/32/64
Signals (off by default - turn on in settings):
Buy Call/Sell Call (open/exit call positions)
Buy Put/Sell Put (open/exit put positions)
Enter signals bullish:
Close over Middle EMA AND Short EMA > Middle EMA > Long EMA
Exit signals bullish:
Close under Middle EMA OR trend turns bearish (Short EMA < Middle EMA < Long EMA )
Enter signals bearish:
Close under Middle EMA AND Short EMA < Middle EMA < Long EMA
Exit signals bearish:
Close over Middle EMA OR Short EMA > Middle EMA > Long EMA
Cloud Colors (Default)
Green: Bullish
Red: Bearish
White: Chop/Transition
Cerca negli script per "3 ema"
EMA MTF Trend Dashboard (Cross & Bias Modes)EMA MTF Trend Dashboard (Cross & Bias Modes)
A clean, multi-timeframe trend-alignment tool designed to support disciplined entries and higher-probability trades.
________________________________________
🔍 What This Dashboard Does
The EMA MTF Trend Dashboard provides a clear, structured view of trend direction across seven key timeframes:
1m • 5m • 15m • 30m • 1H • 4H • Daily
It highlights your execution timeframe, displays EMA-based trend direction per timeframe, and produces a plain-English directional bias using either Single EMA mode or Dual EMA Cross mode.
This makes it useful for scalpers, intraday traders, swing traders, and anyone who wants clarity before executing a trade.
________________________________________
🧠 How to Read the Dashboard
1. Execution Timeframe (Blue Row)
The blue row is your execution timeframe — the timeframe used to calculate the final bias.
• In Chart mode, it automatically matches your current chart timeframe.
• In Locked mode, it remains fixed, even if you switch to other chart timeframes.
This ensures consistency and removes any ambiguity before entering a trade.
________________________________________
2. EMA Mode (Use Any Length You Like)
You’re free to choose any EMA lengths — the dashboard adapts to your strategy.
• Smaller EMAs (5–20):
React quickly and highlight short-term momentum changes or early trend shifts.
• Larger EMAs (50–200+):
Move more slowly and provide a smoother read of overall trend structure, filtering out low-timeframe noise.
This flexibility lets you tune the dashboard to your preferred approach — whether you want fast tactical signals or slower, more stable directional structure.
________________________________________
3. Cross & Bias Modes
The dashboard supports two core engines:
✔ Single EMA Mode (Price vs EMA + ATR Neutral Buffer)
A trend-following model that avoids false signals when price is close to the EMA.
✔ Dual EMA Cross Mode (Fast vs Slow EMA)
A crossover-based trend engine ideal for traders who prefer structure shifts based on EMA alignment.
You can switch modes instantly from the settings.
________________________________________
4. Bias (Plain-English Trend Assessment)
The bias row at the bottom shows the overall directional bias for the blue timeframe, calculated using weighted multi-timeframe logic:
• Strong Bull
• Bullish
• Neutral
• Bearish
• Strong Bear
This provides instant clarity on whether market conditions support (or conflict with) your trade idea.
________________________________________
5. Trend Table (Heatmap View)
Each timeframe shows:
• ▲ Bullish
• ▼ Bearish
• – Neutral
Colour coded for clarity:
• Green = bullish
• Red = bearish
• Grey = neutral
• Blue = execution timeframe highlight
This creates a clean, at-a-glance trend heatmap.
________________________________________
⚙️ Customisation Options
• Fully adjustable EMA lengths
• Single EMA mode (with ATR neutral zone)
• Dual EMA Cross mode (fast/slow)
• Selectable text colour (dark/light theme friendly)
• Execution timeframe mode: Chart or Locked
• Compact and visually clear table layout
________________________________________
✔ Why This Tool Helps
This dashboard gives traders a structured, rule-aligned view of trend direction by:
• Keeping you aligned with broader multi-timeframe structure
• Reducing counter-trend mistakes
• Clarifying trend shifts and momentum changes
• Making decision-making faster and more consistent
• Supporting any systematic or rule-based trading plan
It is a decision-support tool, not a buy/sell signal — making it useful for all trading styles.
________________________________________
📌 Notes for Users
• Non-repainting (uses confirmed closes)
• Works universally: Forex, crypto, indices, commodities
• Suitable for scalpers, day-traders, swing traders
________________________________________
💬 Feedback & Future Enhancements
If you’d like to see additional timeframes, alternative trend engines, an ultra-compact mode, or alert integrations, feel free to request upgrades.

Ema Cross, 10 /21 / 55Ema Cross tool using Ema 10 / Ema 21 / Ema 55
I have found these settings very useful for catching breakouts on Alt coins.
Alerts Added,
Breakout = Ema 10 crossing above Ema 21
Breakdown = Ema 10 crossing under Ema 21
Ema 55 added as a useful area to catch dips when price is trending

EMA KitEMA Kit delivers multiple 1D EMA's wrapped into a single indicator.
I was annoyed with having a bunch of EMA indicators on the left side of my chart for each individual EMA I rely on, so I created a single indicator with all of them.
This EMA kit allows you to select any combination of the following EMA's: 3D, 5D, 8D, 21D, 34D, 50D, 100D, 200D, and 200W. They are all based on the 1D timeframe regardless of the timeframe you're currently viewing on your chart - for example, if you toggle from a Daily chart to a 15 minute chart, the EMA's won't change to reflect the 15 minute timeframe. EMA Kit smoothes the lines to prevent staggering on lower timeframes. You can change the color scheme and line thickness and even toggle between different line types like area, histogram, etc. You also have the option to turn end-of-line price labels on/off. Current price level for each EMA is highlighted on the price scale.

EMA X BF 🚀EMA Crossover Strategy
A simple EMA cross is a useful indication of a change in direction of a trend and is a very popular tool in trading. It can also be useful to judge price action momentum or severity by looking at the angle of the 2 EMAs, or the distance between them.
There are 2 Exponential Moving Averages, one fast and one slow. When the fast EMA crosses above the slow EMA, this can be considered bullish and may signal an upside move. Conversely, a cross to the downside of the fast EMA under the slow EMA can be considered bearish.
This strategy uses the same principle but uses different sources for the 2 EMAs; instead of using close values, we use ohlc4 values for the fast EMA and hlc3 values for the slow EMA.
The idea is that a trader might enter a long position upon a cross up and reverse position and go short upon the next cross down.
We use a simple 6% stop loss for both long and short positions.
This strategy is tuned to a 6hr chart for Bitcoin USD pairs.
INSTRUCTIONS
Go Long when the background is green
Go short when the background is red
White background means sideways market: a no trade zone

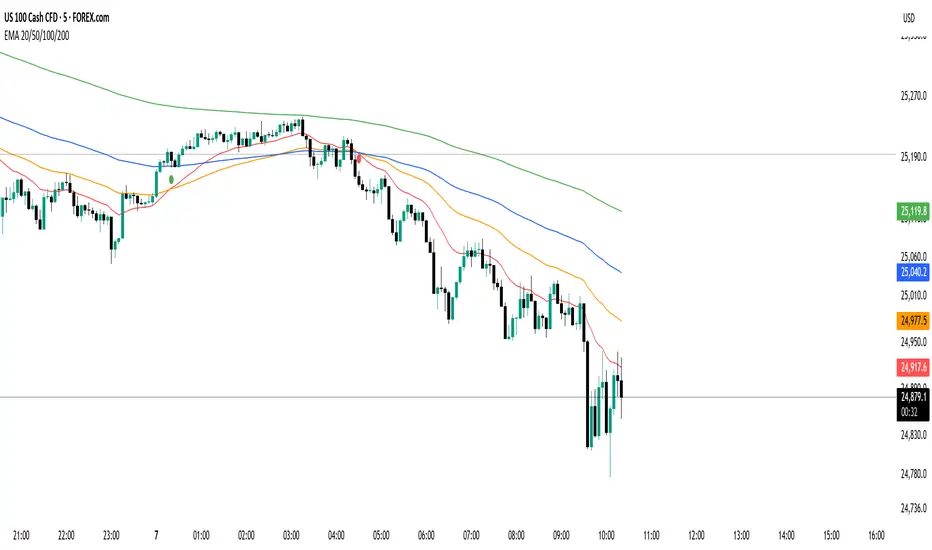
EMA 20/50/100/200 Trader IkkaEMA 20/50/100/200 📊 + Crossover Alerts 🔔 Trader Ikka
This indicator plots four key Exponential Moving Averages (EMA 20, 50, 100, and 200) to help identify trends.
It also detects and marks bullish 🟢 and bearish 🔴 crossovers between the EMA 20 and EMA 50, signaling potential trend reversals or continuations.
✨ Features:
📊 Plots EMA 20, 50, 100, and 200 with color-coded lines
🟢🔴 Highlights bullish and bearish crossovers between EMA 20 & EMA 50
🔔 Built-in alert conditions for automated notifications
⚡ Useful for identifying momentum shifts and entry/exit zones
EMA 1/8 Cross - Fixed Pip TP/SLEMA 1/8 Cross – Fixed Pip TP/SL
This strategy is based on the crossover between EMA 8 and EMA 14 as trading signals:
Long entry → when EMA 1 crosses above EMA 8
Short entry → when EMA 1 crosses below EMA 8
Features:
Fixed pip Take Profit (TP) and Stop Loss (SL), fully adjustable in the settings.
Customizable EMA Fast/Slow lengths for optimization.
Pip size input to match different broker definitions (e.g., XAUUSD often uses 0.10 as one pip).
Suitable for testing scalping or swing trading across multiple timeframes.
⚠️ Disclaimer:
This script is intended for backtesting and educational purposes only. Please optimize parameters and apply proper risk management before using it on live accounts.

EMA Curl Strength+EMA Curl Strength+
Description:
This indicator provides a statistically normalized view of EMA slope momentum using Z-score transformation. By evaluating the rate of change of an EMA and comparing it against its historical behavior, the script highlights momentum shifts in a dynamic, adaptive way.
⸻
How It Works:
• Calculates the slope (percentage change) of a chosen EMA.
• Normalizes the slope using Z-score over a custom lookback period.
• Smooths the resulting signal and computes two signal lines for comparison.
• Assigns dynamic colors based on user-defined Z-score thresholds for mild, moderate, and strong momentum in both directions.
⸻
Visual Features:
• Gradient fill between the Z Curl Line and Signal 1 to highlight slope acceleration.
• Histogram showing the difference between the Z Curl Line and its signal.
• Optional signal crossover shapes between configurable pairs (e.g., Z Curl vs. Signal).
• Background highlights when the Z Curl Line exceeds ±2, indicating strong trending behavior.
⸻
Customization:
• Adjustable EMA length, smoothing lengths, signal lengths, histogram smoothing, and Z-score lookback.
• Separate color controls for:
• Z-score strength bands (mild/moderate/strong up/down)
• Histogram bars
• Signal lines
• Background highlight zones
• Crossover shapes
⸻
Use Cases:
• Momentum Confirmation: Confirm strength when Z Curl exceeds ±2 with matching background highlights.
• Trend Entry Timing: Look for trades when Z Curl crosses above or below the 0-line.
• Scalping: Capture quick directional moves when momentum accelerates.
• Trend Following: Use strong Z Curl values to confirm trade direction and filter sideways action.
• Divergence Detection: Spot divergences between price and Z Curl movement to anticipate reversals.

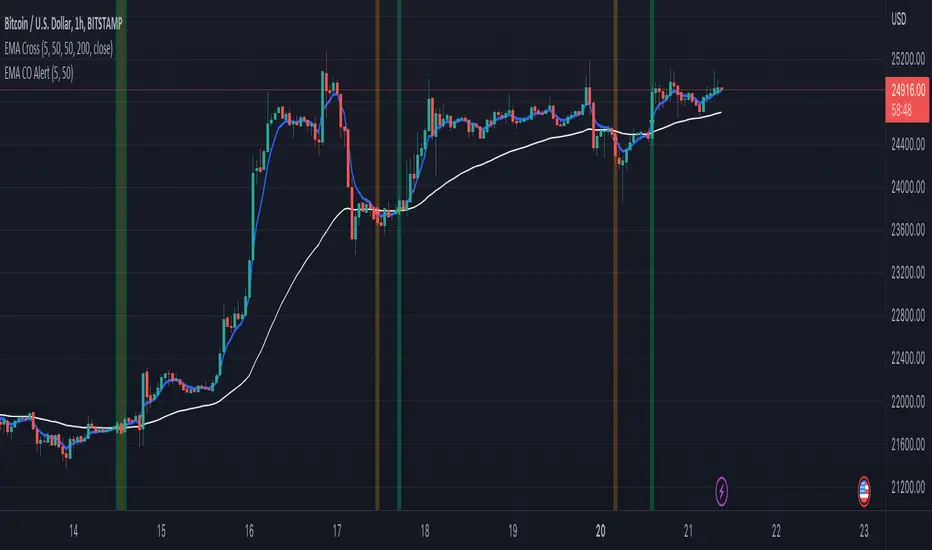
EMA CO AlertEMAs play an important role in identifying the mood of the market.
Frequently used short term EMA is 5 and long term EMA is 50.
This script detects the crossover (+ve and -ve) and generates alerts accordingly.
Steps to apply:
1) Open the script on a desired timeframe.
2) Add this indicator on the chart
3) Choose the values of the 2 EMAs from settings
4) Go to the alert window.
5) Select this indicator from the 'Condition' dropdown
6) Create the alert.
This alert will then run in the background and notify you.
Need to apply a one time alert on the scripts.
In addition to above, you can also add this indicator on the chart and it will show green/red lines on the chart for signals.
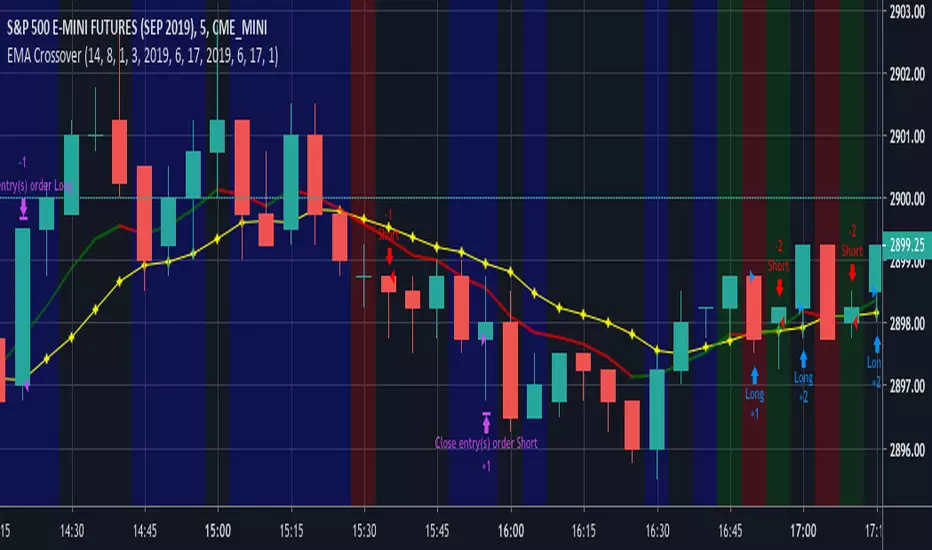
EMA CrossoverEMA Crossover
Input Parameters:
Stop loss (ticks) - define stop loss in unit of ticks (*1 tick = 12.5)
Exit signal - 1: When EMA and price crosses
2: When EMA changes direction
Start year, month, day & Stop year, month, day - define backtest period
You can set Order size, Commission in Settings, Properties tab.

EMA Cross 20/50/100/200EMA Cross 20 50 100 200
Easy identify cross between 20 and 50
Easy identify cross between 20 and 100
Cross between 20 and 50 is good signal for buy and sell.
Cross between 20 and 100 is confirmation signal for buy and sell.


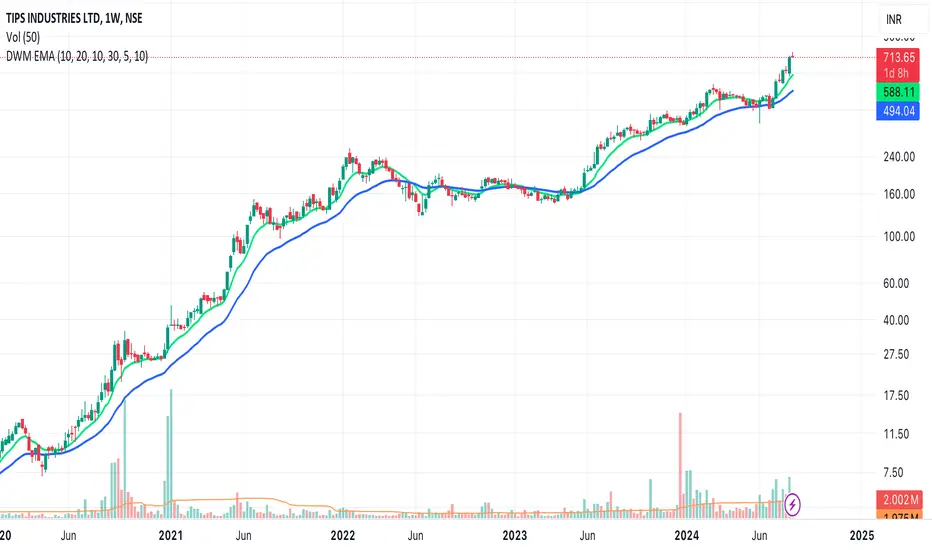
EMAs for D W M TimeframesEMAs for D W M Timeframes
Description:
The “EMAs for D W M Timeframes” indicator allows users to set specific Exponential Moving Averages (EMAs) for Daily, Weekly, and Monthly timeframes. The script utilizes these user-defined EMA settings based on the chart’s current timeframe, ensuring that the appropriate EMAs are always displayed.
Please note that for timeframes other than specified, it defaults to daily EMA values.
EMA : The Exponential Moving Average (EMA) is a type of moving average that places greater weight and significance on the most recent data points. This makes the EMA more responsive to recent price changes compared to a simple moving average (SMA), making it a popular tool for identifying trends in financial markets.
Features:
Daily and Default EMAs: Users can specify two EMAs for the Daily timeframe, which also act as the default EMAs for any unspecified timeframe. The default values are set to 10 and 20.
Weekly EMAs: For Weekly charts, the indicator plots two EMAs with default values of 10 and 30. These EMAs help in tracking medium-term trends.
Monthly EMAs: On Monthly charts, the indicator plots EMAs with default values of 5 and 10, providing insights into long-term trends.
Timeframe-Based Display: The indicator automatically uses the EMA settings corresponding to the current chart’s timeframe, whether it is Daily, Weekly, or Monthly.
If the chart is set to any other timeframe, the Daily EMA settings are used by default.
How to Use:
Inputs:
* Daily and Default EMA 1 & 2: Adjust the values for the short-term and long-term EMAs on the Daily chart, which are also used for any other unspecified timeframe.
* Weekly EMA 1 & 2: Set the values for the EMAs that will be shown on Weekly charts.
* Monthly EMA 1 & 2: Specify the values for the EMAs to be displayed on Monthly charts.
Visualization:
* Depending on the current chart timeframe, the script will automatically display the relevant EMAs.
Default Values:
* Daily and Default EMAs: 10 (EMA 1), 20 (EMA 2)
* Weekly EMAs: 10 (EMA 1), 30 (EMA 2)
* Monthly EMAs: 5 (EMA 1), 10 (EMA 2)
This indicator is designed for users who want to monitor EMAs across different timeframes, using specific settings for Daily, Weekly, and Monthly charts.
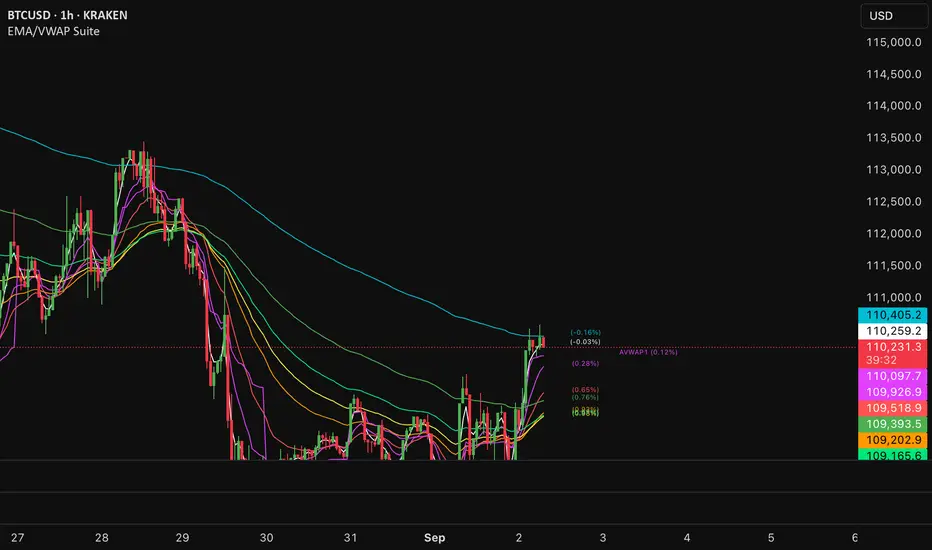
EMA/VWAP SuiteEMA/VWAP Suite
Overview
The EMA/VWAP Suite is a versatile and customizable Pine Script indicator designed for traders who want to combine Exponential Moving Averages (EMAs) and Volume Weighted Average Prices (VWAPs) in a single, powerful tool. It overlays up to eight EMAs and six VWAPs (three anchored, three rolling) on the chart, each with percentage difference labels to show how far the current price is from these key levels. This indicator is perfect for technical analysis, supporting strategies like trend following, mean reversion, and VWAP-based trading.
By default, the indicator displays eight EMAs and a session-anchored VWAP (AVWAP 1, in fuchsia) with their respective percentage difference labels, keeping the chart clean yet informative. Other VWAPs and their bands are disabled by default but can be enabled and customized as needed. The suite is designed to minimize clutter while providing maximum flexibility for traders.
Features
- Eight Customizable EMAs: Plot up to eight EMAs with user-defined lengths (default: 3, 9, 19, 38, 50, 65, 100, 200), each with a unique color for easy identification.
- EMA Percentage Difference Labels: Show the percentage difference between the current price and each EMA, displayed only for visible EMAs when enabled.
- Three Anchored VWAPs: Plot VWAPs anchored to the start of a session, week, or month, with customizable source, offset, and band multipliers. AVWAP 1 (session-anchored, fuchsia) is enabled by default.
- Three Rolling VWAPs: Plot VWAPs calculated over fixed periods (default: 20, 50, 100), with customizable source, offset, and band multipliers.
- VWAP Bands: Optional upper and lower bands for each VWAP, based on standard deviation with user-defined multipliers.
- VWAP Percentage Difference Labels: Display the percentage difference between the current price and each VWAP, shown only for visible VWAPs. Enabled by default to show the AVWAP 1 label.
- Customizable Colors: Each VWAP has a user-defined color via input settings, with labels matching the VWAP line colors (e.g., AVWAP 1 defaults to fuchsia).
Flexible Display Options: Toggle individual EMAs, VWAPs, bands, and labels on or off to reduce chart clutter.
Settings
The indicator is organized into intuitive setting groups:
EMA Settings
Show EMA 1–8 : Toggle each EMA on or off (default: all enabled).
EMA 1–8 Length : Set the period for each EMA (default: 3, 9, 19, 38, 50, 65, 100, 200).
Show EMA % Difference Labels : Enable/disable percentage difference labels for all EMAs (default: enabled).
EMA Label Font Size (8–20) : Adjust the font size for EMA labels (default: 10, mapped to “tiny”).
Anchored VWAP 1–3 Settings
Show AVWAP 1–3 : Toggle each anchored VWAP on or off (default: AVWAP 1 enabled, others disabled).
AVWAP 1–3 Color : Set the color for each VWAP line and its label (default: fuchsia for AVWAP 1, purple for AVWAP 2, teal for AVWAP 3).
AVWAP 1–3 Anchor : Choose the anchor period (“Session,” “Week,” “Month”; default: Session for AVWAP 1, Week for AVWAP 2, Month for AVWAP 3).
AVWAP 1–3 Source : Select the price source (default: hlc3).
AVWAP 1–3 Offset : Set the horizontal offset for the VWAP line (default: 0).
Show AVWAP 1–3 Bands : Toggle upper/lower bands (default: disabled).
AVWAP 1–3 Band Multiplier : Adjust the standard deviation multiplier for bands (default: 1.0).
Rolling VWAP 1–3 Settings
Show RVWAP 1–3 : Toggle each rolling VWAP on or off (default: disabled).
RVWAP 1–3 Color : Set the color for each VWAP line and its label (default: navy for RVWAP 1, maroon for RVWAP 2, fuchsia for RVWAP 3).
RVWAP 1–3 Period Length : Set the period for the rolling VWAP (default: 20, 50, 100).
RVWAP 1–3 Source : Select the price source (default: hlc3).
RVWAP 1–3 Offset : Set the horizontal offset (default: 0).
Show RVWAP 1–3 Bands : Toggle upper/lower bands (default: disabled).
RVWAP 1–3 Band Multiplier : Adjust the standard deviation multiplier for bands (default: 1.0).
VWAP Label Settings
Show VWAP % Difference Labels : Enable/disable percentage difference labels for all VWAPs (default: enabled, showing AVWAP 1 label).
VWAP Label Font Size (8–20) : Adjust the font size for VWAP labels (default: 10, mapped to “tiny”).
How It Works
EMAs : Calculated using ta.ema(close, length) for each user-defined period. Percentage differences are computed as ((close - ema) / close) * 100 and displayed as labels for visible EMAs when show_ema_labels is enabled.
Anchored VWAPs : Calculated using ta.vwap(source, anchor, 1), where the anchor is determined by the selected timeframe (Session, Week, or Month). Bands are computed using the standard deviation from ta.vwap.
Rolling VWAPs : Calculated using ta.vwap(source, length), with bands based on ta.stdev(source, length).
Labels : Updated on each new bar (ta.barssince(ta.change(time) != 0) == 0) to show percentage differences. Labels are only displayed for visible EMAs/VWAPs to avoid clutter.
Color Matching: VWAP labels use the same color as their corresponding VWAP lines, set via input settings (e.g., avwap1_color for AVWAP 1).
Example Use Cases
- Trend Following: Use longer EMAs (e.g., 100, 200) to identify trends and shorter EMAs (e.g., 3, 9) for entry/exit signals.
- Mean Reversion: Monitor percentage difference labels to spot overbought/oversold conditions relative to EMAs or VWAPs.
- VWAP Trading: Use the default session-anchored AVWAP 1 for intraday trading, adding weekly/monthly VWAPs or rolling VWAPs for broader context.
- Intraday Analysis: Leverage the session-anchored AVWAP 1 (enabled by default) for day trading, with bands as support/resistance zones.
EMA-Based Squeeze Dynamics (Gap Momentum & EWMA Projection)EMA-Based Squeeze Dynamics (Gap Momentum & EWMA Projection)
🚨 Main Utility: Early Squeeze Warning
The primary function of this indicator is to warn traders early when the market is approaching a "squeeze"—a tightening condition that often precedes significant moves or regime shifts. By visually highlighting areas of increasing tension, it helps traders anticipate potential volatility and prepare accordingly. This is intended to be a statistically and psychologically grounded replacement of so-called "fib-time-zones," which are overly-deterministic and subjective.
📌 Overview
The EMA-Based Squeeze Dynamics indicator projects future regime shifts (such as golden and death crosses) using exponential moving averages (EMAs). It employs historical interval data and current market conditions to dynamically forecast when the critical EMAs (50-period and 200-period) will reconverge, marking likely trend-change points.
This indicator leverages two core ideas:
Behavioral finance theory: Traders often collectively anticipate popular EMA crossovers, creating a self-fulfilling prophecy (normative social influence), similar to findings from Solomon Asch’s conformity experiments.
Bayesian-like updates: It utilizes historical crossover intervals as a prior, dynamically updating expectations based on evolving market data, ensuring its signals remain objectively grounded in actual market behavior.
⚙️ Technical & Mathematical Explanation
1. EMA Calculations and Regime Definitions
The indicator uses three EMAs:
Fast (9-period): Represents short-term price movement.
Medial (50-period): Indicates medium-term trend direction.
Slow (200-period): Defines long-term market sentiment.
Regime States:
Bullish: 50 EMA is above the 200 EMA.
Bearish: 50 EMA is below the 200 EMA.
A shift between these states triggers visual markers (arrows and labels) directly on the chart.
2. Gap Dynamics and Historical Intervals
At each crossover:
The indicator records the gap (distance) between the 50 and 200 EMAs.
It tracks the historical intervals between past crossovers.
An Exponentially Weighted Moving Average (EWMA) of these intervals is calculated, weighting recent intervals more heavily, dynamically updating expectations.
Important note:
After every regime shift, the projected crossover line resets its calculation. This reset is visually evident as the projection line appears to move further away after each regime change, temporarily "repelled" until the EMAs begin converging again. This ensures projections remain realistic, grounded in actual EMA convergence, and prevents overly optimistic forecasts immediately after a regime shift.
3. Gap Momentum & Adaptive Scaling
The indicator measures how quickly or slowly the gap between EMAs is changing ("gap momentum") and adjusts its forecast accordingly:
If the gap narrows rapidly, a crossover becomes more imminent.
If the gap widens, the next crossover is pushed further into the future.
The "gap factor" dynamically scales the projection based on recent gap momentum, bounded between reasonable limits (0.7–1.3).
4. Squeeze Ratio & Background Color (Visual Cues)
A "squeeze ratio" is computed when market conditions indicate tightening:
In a bullish regime, if the fast EMA is below the medial EMA (price pulling back towards long-term support), the squeeze ratio increases.
In a bearish regime, if the fast EMA rises above the medial EMA (price rallying into long-term resistance), the squeeze ratio increases.
What the Background Colors Mean:
Red Background: Indicates a bullish squeeze—price is compressing downward, hinting a bullish reversal or continuation breakout may occur soon.
Green Background: Indicates a bearish squeeze—price is compressing upward, suggesting a bearish reversal or continuation breakout could soon follow.
Opacity Explanation:
The transparency (opacity) of the background indicates the intensity of the squeeze:
High Opacity (solid color): Strong squeeze, high likelihood of imminent volatility or regime shift.
Low Opacity (faint color): Mild squeeze, signaling early stages of tightening.
Thus, more vivid colors serve as urgent visual warnings that a squeeze is rapidly intensifying.
5. Projected Next Crossover and Pseudo Crossover Mechanism
The indicator calculates an estimated future bar when a crossover (and thus, regime shift) is expected to occur. This calculation incorporates:
Historical EWMA interval.
Current squeeze intensity.
Gap momentum.
A dynamic penalty based on divergence from baseline conditions.
The "Pseudo Crossover" Explained:
A key adaptive feature is the pseudo crossover mechanism. If price action significantly deviates from the projected crossover (for example, if price stays beyond the projected line longer than expected), the indicator acknowledges the projection was incorrect and triggers a "pseudo crossover" event. Essentially, this acts as a reset, updating historical intervals with a weighted adjustment to recalibrate future predictions. In other words, if the indicator’s initial forecast proves inaccurate, it recognizes this quickly, resets itself, and tries again—ensuring it remains responsive and adaptive to actual market conditions.
🧠 Behavioral Theory: Normative Social Influence
This indicator is rooted in behavioral finance theory, specifically leveraging normative social influence (conformity). Traders commonly watch EMA signals (especially the 50 and 200 EMA crossovers). When traders collectively anticipate these signals, they begin trading ahead of actual crossovers, effectively creating self-fulfilling prophecies—similar to Solomon Asch’s famous conformity experiments, where individuals adopted group behaviors even against direct evidence.
This behavior means genuine regime shifts (actual EMA crossovers) rarely occur until EMAs visibly reconverge due to widespread anticipatory trading activity. The indicator quantifies these dynamics by objectively measuring EMA convergence and updating projections accordingly.
📊 How to Use This Indicator
Monitor the background color and opacity as primary visual cues.
A strongly colored background (solid red/green) is an early alert that a squeeze is intensifying—prepare for potential volatility or a regime shift.
Projected crossover lines give a dynamic target bar to watch for trend reversals or confirmations.
After each regime shift, expect a reset of the projection line. The line may seem initially repelled from price action, but it will recalibrate as EMAs converge again.
Trust the pseudo crossover mechanism to automatically recalibrate the indicator if its original projection misses.
🎯 Why Choose This Indicator?
Early Warning: Visual squeeze intensity helps anticipate market breakouts.
Behaviorally Grounded: Leverages real trader psychology (conformity and anticipation).
Objective & Adaptive: Uses real-time, data-driven updates rather than static levels or subjective analysis.
Easy to Interpret: Clear visual signals (arrows, labels, colors) simplify trading decisions.
Self-correcting (Pseudo Crossovers): Quickly adjusts when initial predictions miss, maintaining accuracy over time.
Summary:
The EMA-Based Squeeze Dynamics Indicator combines behavioral insights, dynamic Bayesian-like updates, intuitive visual cues, and a self-correcting pseudo crossover feature to offer traders a reliable early warning system for market squeezes and impending regime shifts. It transparently recalibrates after each regime shift and automatically resets whenever projections prove inaccurate—ensuring you always have an adaptive, realistic forecast.
Whether you're a discretionary trader or algorithmic strategist, this indicator provides a powerful tool to navigate market volatility effectively.
Happy Trading! 📈✨

EMA CheatsheetEMA Clouds Indicator: A Comprehensive Guide for Traders
The Exponential Moving Average (EMA) Clouds indicator is a dynamic tool designed to provide traders with visual cues about the current trend and potential shifts in market momentum. The EMA is a type of moving average that gives more weight to recent price data, making it highly responsive to price changes compared to a Simple Moving Average (SMA). When used in the form of clouds, EMAs are layered on top of each other to form a visual representation of bullish and bearish trends.
Understanding EMA Clouds
EMA Clouds consist of two or more EMAs, typically a short-term EMA (e.g., 9-period) and a longer-term EMA (e.g., 21-period). When these two EMAs are plotted together, they create a "cloud" between them. The interaction between these EMAs gives traders critical insights into the market's trend:
Bullish Clouds: When the shorter-term EMA crosses above the longer-term EMA, the market is considered to be in a bullish trend. This creates a green (or lighter colored) cloud between the EMAs, signaling upward momentum. Bullish clouds suggest that buyers are in control, and the price is likely to continue higher.
Bearish Clouds: Conversely, when the shorter-term EMA crosses below the longer-term EMA, the market is considered to be in a bearish trend. This forms a red (or darker colored) cloud between the EMAs, indicating downward momentum. Bearish clouds imply that sellers are dominating the market, and the price is likely to decline.
Key Components of the EMA Clouds Indicator:
Short-Term EMA: This is the fast-moving average (e.g., 9-period EMA) and reacts quickly to recent price changes. It’s used to detect short-term shifts in momentum.
Long-Term EMA: This is the slower-moving average (e.g., 21-period EMA), which smooths out price data over a longer period and identifies the general trend direction.
Cloud: The area between the short-term and long-term EMAs. When this cloud is green (bullish), it indicates that the short-term trend is stronger than the long-term trend. When the cloud turns red (bearish), it suggests that the short-term trend is weaker than the long-term trend.
Cloud Thickness: The thickness of the cloud provides additional information about the strength of the trend. A thicker cloud suggests strong price divergence between short and long-term trends, which could indicate a robust trend. A thinner cloud, on the other hand, may signal trend weakness or consolidation.
