MACD/EMA Long StrategyThis incredibly simple strategy uses a combination of the 20 EMA and bullish/bearish MACD crosses as a low risk method of getting in and out of markets.
Depending on whether the market is above or below the 200 SMA, the script determines if the market is in bullish or bearish territory. Above the 200 SMA, the script will ignore the 20 EMA as a buy condition and buy solely on the confirmation of a bullish MACD cross upon the close of a candle. In this bullish market, the script will only enable the sell condition if both the MACD is bearish AND a close below the 20 EMA occurs. This is to reduce the chances of the script selling prematurely in the event of a bearish MACD cross, if the market is still in overall bullish territory.
When the market is below the 200 SMA, the confirmation occurs in the opposite direction. The buy condition will only be met if both the MACD is bullish AND a close above the 20 EMA occurs. However, the sell condition ignores the 20 EMA and will sell solely on the confirmation of a bearish MACD cross upon the close of the candle.
This strategy can be used in both bullish and bearish markets. This conservative strategy will slightly underperform in a bull market, with the sell condition occasionally being met and then potentially buying back higher. However, it will successfully get you out of a turning market and automatically switch into a more 'risk-off' mentality during a bear market. This strategy is not recommended for sideways markets, as trading around the 20 EMA coupled with a relatively flat MACD profile can cause the strategy to buy the peaks and sell troughs easily.
Cerca negli script per "3 ema"

Multi SMA EMA WMA HMA BB (4x3 MAs Bollinger Bands) Pro MTF - RRBMulti SMA EMA WMA HMA 4x3 Moving Averages with Bollinger Bands Pro MTF by RagingRocketBull 2018
Version 1.0
This indicator shows multiple MAs of any type SMA EMA WMA HMA etc with BB and MTF support, can show MAs as dynamically moving levels.
There are 4 MA groups + 1 BB group. You can assign any type/timeframe combo to a group, for example:
- EMAs 50,100,200 x H1, H4, D1, W1 (4 TFs x 3 MAs x 1 type)
- EMAs 8,13,21,55,100,200 x M15, H1 (2 TFs x 6 MAs x 1 type)
- D1 EMAs and SMAs 12,26,50,100,200,400 (1 TF x 6 MAs x 2 types)
- H1 WMAs 7,77,231; H4 HMAs 50,100,200; D1 EMAs 144,169,233; W1 SMAs 50,100,200 (4 TFs x 3 MAs x 4 types)
- +1 extra MA type/timeframe for BB
compile time: 25-30 sec
full redraw time after parameter change in UI: 3 sec
There are several versions: Simple, MTF, Pro MTF, Advanced MTF and Ultimate MTF. This is the Pro MTF version. The Differences are listed below. All versions have BB
- Simple: you have 2 groups of MAs that can be assigned any type (5+5)
- MTF: +2 custom Timeframes for each group (2x5 MTF)
- Pro MTF: +4 custom Timeframes for each group (4x3 MTF), MA levels and show max bars back options
- Advanced MTF: +2 extra MAs/group (4x5 MTF), custom Ticker/Symbol, backreferences for type, TF and MA lengths in UI
- Ultimate MTF: +individual settings for each MA, custom Ticker/Symbols
Features:
- 4x3 = 12 MAs of any type including Hull Moving Average (HMA)
- 4x MTF groups with step line smoothing
- BB +1 extra TF/type for BB MAs
- 12 MA levels with adjustable group offsets, indents and shift
- show max bars back
- you can show/hide both groups of MAs/levels and individual MAs
Notes:
1. based on 3EmaBB, uses plot*, barssince and security functions
2. you can't set certain constants from input due to Pinescript limitations - change the code as needed, recompile and use as a private version
3. Levels = trackprice implementation
4. Show Max Bars Back = show_last implementation
5. uses timeframe textbox instead of input resolution to allow for 120 240 and other custom TFs. Also supports TFs in hours: 2H or H2
6. swma has a fixed length = 4, alma and linreg have additional offset and smoothing params
7. Smoothing is applied by default for visual aesthetics on MTF. To use exact ma mtf values (lines with stair stepping) - disable it
MTF Notes:
- uses simple timeframe textbox instead of input resolution dropdown to allow for 120, 240 and other custom TFs, also supports timeframes in H: 2H, H2
- Groups that are not assigned a Custom TF will use Current Timeframe (0).
- MTF will work for any MA type assigned to the group
- MTF works both ways: you can display a higher TF MA/BB on a lower TF or a lower TF MA/BB on a higher TF.
- MTF MA values are normally aligned at the boundary of their native timeframe. This produces stair stepping when a higher TF MA is viewed on a lower TF.
Therefore X Y Point Density/Smoothing is applied by default on MA MTF for visual aesthetics. Set both to 0 to disable and see exact ma mtf values (lines with stair stepping and original mtf alignment).
- Smoothing is disabled for BB MTF bands because fill doesn't work with smoothed MAs after duplicate values are replaced with na.
- MTF MA Value fluctuation is possible on the current bar due to default security lookahead
Smoothing:
- X,Y == 0 - X,Y smoothing disabled (stair stepping on high TFs)
- X == 0, Y > 0 - X,Y smoothing applied to all TFs
- Y == 0, X > 0 - X smoothing applied to all TFs < deltaX_max_tf, Y smoothing disabled
- X > 0, Y > 0 - Y smoothing applied to all TFs, then X smoothing applied to all TFs < deltaX_max_tf
X Smoothing with Y == 0 - shows only every deltaX-th point starting from the first bar.
X Smoothing with Y > 0 - shows only every deltaX-th point starting from the last shown Y point, essentially filling huge gaps remaining after Y Smoothing with points and preserving the curve's general shape
X Smoothing on high TFs with already scarce points produces weird curve shapes, it works best only on high density lower TFs
Y Smoothing reduces points on all TFs, removes adjacent points with prices within deltaY, while preserving the smaller curve details.
A combination of X,Y produces the most accurate smoothing. Higher delta value - larger range, more points removed.
Show Max Bars Back:
- can't set plot show_last from input -> implemented using a timenow based range check
- you can't delete/modify history once plotted, so essentially it just sets a start point for plotting (from num_bars bars back) that works only in realtime mode (not in replay)
Levels:
You can plot current MA value using plot trackprice=true or by checking Show Price Line in Style. Problem is:
- you can only change color (not the dashed line style, width), have both ma + price line (not just the line), and it's full screen wide
- you can't set plot trackprice from input => implemented using plotshape/plotchar with fixed text labels serving as levels
- there's no other way of creating a dynamic level: hline, plot, offset - nothing else works.
- you can't plot a text var - all text strings must be constants, so you can't change the style, width and text labels without recompiling.
- from input you can only adjust offset, indent and shift for each level group, and change color
- the dot below each level line is the exact MA value. If you want just the line swap plotshape with plotchar, recompile and save as your private version, adjust Y shift.
To speed up redraw times: reduce last_bars to ~2000, recompile and use as your own private version
Pinescript is a rudimentary language (should be called Painscript instead) that can basically only plot data. You can't do much else. Please see the code for tips and hints.
Certain things just can't be done or require shady workarounds and weeks of testing trying to resolve weird node.js compiler errors.
Feel free to learn from/reuse/change the code as needed and use as your own private version. See comments in code. Good Luck!

Multi SMA EMA WMA HMA BB (5+5 MAs + Bollinger Bands) MTF by RRBMulti SMA EMA WMA HMA BB (5+5 Moving Averages of Any Type with Bollinger Bands) MTF by RagingRocketBull 2018
Version 1.0
This indicator shows multiple MAs of any type (SMA EMA WMA HMA etc) with BB and MTF support
There are several versions: Simple, MTF, Pro MTF and Ultimate MTF. This is the MTF version. The Differences are listed below. All versions have BB
- Simple: you have 2 groups of MAs that can be assigned any type (5+5)
- MTF: +assign 1 custom Timeframe to any group combo (5+5 Custom TF)
- Pro MTF: +multiple Timeframes for multiple MA groups (4*3 MTF), horizontal levels and show max bars back options
- Ultimate MTF: +individual settings for each MA, multiple Timeframes
There are 2 groups of MAs, 3rd group is BB. You can:
- show/hide all MAs in a group. Use length 0 to hide a particular MA independently or uncheck in Style.
- apply any MA type to all MAs in a particular MA group. For example, you can assign all EMAs the HMA type. Groups are called EMAs and SMAs just for reference.
- assign Custom Timeframe to a particular MA/BB group combination or all groups. For example, show daily (D) EMAs+SMAs on H1 Timeframe, or only H4 (240) BB on H1.
You can use different types of MAs as dynamic S/R levels to trade of off and MA crosses as signals for possible trend change (golden/death bull/bear crosses).
Current Timeframe MAs can be used together with Custom Timeframe MAs on a single chart. Higher TF MAs are more important than lower TF MAs.
Most common MA types are: SMA, EMA, WMA, HMA.
Most common MA lengths are: 12, 20, 26, 30, 50, 100, 200, 400 etc.
MTF Notes:
- Script UI uses simple timeframe textbox instead of input resolution dropdown to allow for 240 120 and other custom TFs
- Groups that are not assigned a Custom TF will use Current Timeframe (0).
- MTF will work for any MA type assigned to the group. BB group always uses SMA type.
- MTF works both ways: you can display a higher TF MA/BB on a lower TF or a lower TF MA/BB on a higher TF.
- MTF MA values are normally aligned at the boundary of their native timeframe. This produces stair stepping when a higher TF MA is viewed on a lower TF.
Therefore Point Density/Smoothing is applied by default on MA MTF for visual aesthetics. Set to 0 to disable and see exact ma mtf values (lines with stair stepping and original mtf alignment).
- Smoothing is disabled for BB MTF because fill doesn't work with smoothed MAs after duplicate values are replaced with na.
- MTF MA Value fluctuation is possible on the current bar due to default security lookahead
Features:
- 2 groups of custom 5+5 MAs of any type including Hull Moving Average (HMA)
- BB
- 1x Custom Timeframe with step line smoothing for 3 groups (MAs + BB)
1. based on 3EmaBB, uses plot, fill, security, change, barstate, stdev and custom hma functions
2. you can't set certain constants from input due to Pinescript limitations - change the code as needed, recompile and use as a private script version
3. you can't have plot* inside ?/if/for/function, and implementing condition forks using 2 sets of plots (na vs non-na) doubles indicator params and styles - confusing
4. swma has a fixed length = 4, alma and linreg have additional offset and smoothing params
Feel free to use. Good Luck!

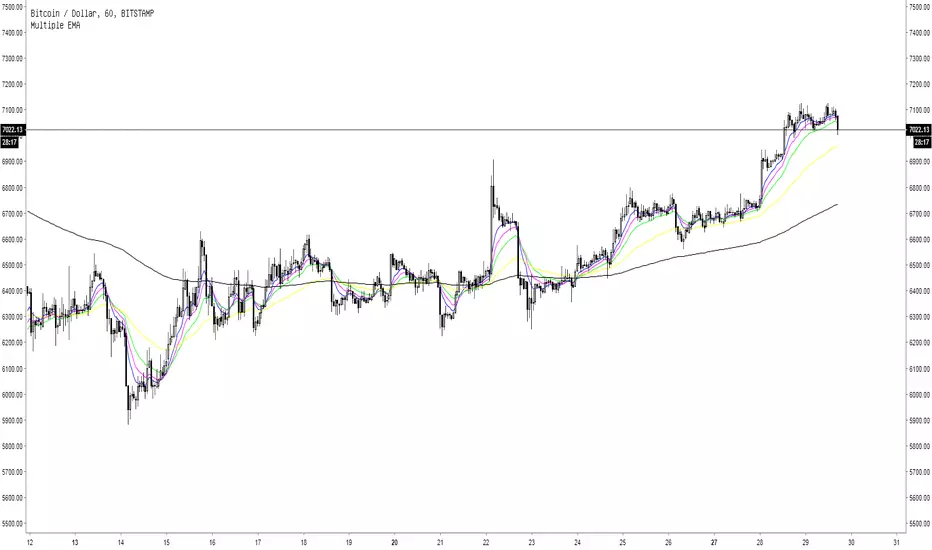
Multiple EMA5 Exponential Moving Averages
EMA 1: length 8, blue line
EMA 2: length 13, pink line
EMA 3: length 21, green line
EMA 4: length 55, yellow line
EMA 5: length 200, black line
Pivot Point+ Supertrend + EMA + Support/Resistance- LAXMANTAK98
Pivot Point Supertrend with EMA and Support/Resistance Indicator
This custom trading indicator combines the following key components to assist in market analysis and trade decision-making:
Pivot Points:
Pivot points are calculated based on a chosen price source (High, Low, Open, or Close). These levels are used to determine potential support and resistance zones.
Pivot Highs (Resistance) and Pivot Lows (Support) are plotted as labels on the chart for easy identification.
Supertrend Indicator:
The Supertrend is a trend-following indicator that helps to identify bullish or bearish trends.
It uses the Average True Range (ATR) to calculate dynamic support/resistance levels, with adjustable settings for ATR length and multiplier factor.
The trend direction is visually represented by green (bullish) and red (bearish) lines on the chart.
Exponential Moving Averages (EMA):
The indicator plots up to four EMAs with user-defined periods (e.g., 9, 21, 50, 200).
EMAs are commonly used to smooth out price data and identify trends over various timeframes.
Support and Resistance Levels:
Based on Pivot Points, support and resistance levels are plotted using crosses on the chart.
These levels indicate possible price reversal points, helping traders spot key zones for entry and exit.
Visual Alerts:
The indicator includes built-in alerts for trend changes and potential buy/sell signals based on the transition between uptrend and downtrend states.
This combined indicator allows traders to analyze trends, identify key levels for trading, and make more informed decisions by integrating Pivot Points, Supertrend, EMAs, and Support/Resistance in one cohesive system.

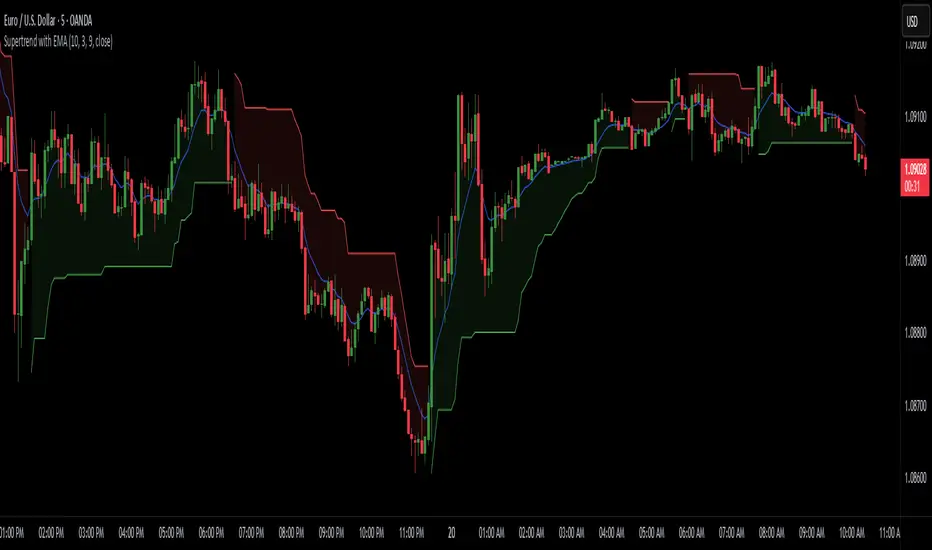
Supertrend with EMASupertrend + EMA Indicator
This custom indicator combines the popular Supertrend and Exponential Moving Average (EMA) indicators to enhance trend analysis and signal accuracy. The Supertrend tracks price volatility to identify potential trend directions, while the EMA provides a smooth moving average to help refine entries and exits based on trend momentum.
Features:
Supertrend: Detects trend reversals by using price action and volatility, making it effective in trending markets.
Exponential Moving Average (EMA): Smoothens price fluctuations, helping you gauge the trend’s strength and filter out false signals.
Versatile for multiple timeframes and asset classes.
Ideal for traders looking to catch sustained trends and avoid false breakouts, this indicator offers an improved way to follow market momentum and confirm trend strength. Customize the Supertrend ATR multiplier and EMA length to suit your trading style and timeframe.
Keltner Channel+EMA with Buy/Sell SignalsIndicator Name: Double Keltner Channel with EMA (Buy/Sell Signals)
Description:
This indicator is designed to help traders identify potential trend reversals and generate buy/sell signals in volatile markets. It combines two Keltner Channels with different sensitivities (multipliers of 2.6 and 3.8) to visualize dynamic support and resistance levels. The addition of a 20-period EMA helps confirm trend direction and filter out potential false signals.
How the Indicator Works:
• Keltner Channels: These bands dynamically adjust to changing market volatility, offering a visual representation of potential price ranges. The 2.6 multiplier Keltner Channel (KC) is more sensitive to price changes, potentially highlighting short-term reversals, while the 3.8 multiplier KC focuses on broader trend shifts.
• 20-period EMA: This widely used trend indicator helps smooth out price fluctuations and identify the underlying direction of the market.
• Buy Signals: Generated when a candle's low touches or crosses below either Keltner Channel's lower band, and within the next 6 candles, that same candle closes above the 20 EMA. This combination suggests a potential rejection of lower prices (support) and a possible resumption of the uptrend.
• Sell Signals: Mirror the buy signal logic but are triggered when the candle's high touches or crosses above either Keltner Channel's upper band and then closes below the 20 EMA within the next 6 candles. This indicates a potential rejection of higher prices (resistance) and a possible shift to a downtrend.
How to Use the Indicator:
1. Identify the Trend: Use the 20 EMA to determine the overall trend direction. Look for buy signals primarily in uptrends and sell signals in downtrends.
2. Confirm with RSI : While not included in this indicator, consider using a separate Relative Strength Index (RSI) with a length of 10, SMA type, MA length of 14, and standard deviation of 2. Look for oversold conditions (RSI below 20) to confirm buy signals and overbought conditions (RSI above 80) to confirm sell signals.
3.Apply Risk Management: Always use appropriate risk management techniques, such as stop-loss orders, to protect your capital.
Key Points:
• This indicator is most effective in trending markets.
• It is not a standalone trading system and should be used in conjunction with other analysis tools and confirmation.
• The Keltner Channel multiplier values can be adjusted to suit your trading style and risk tolerance.
Important Disclaimer:
This indicator is a modification of the original Keltner Channel code and is intended for educational and informational purposes only.
It does not constitute financial advice. Always conduct your own research and consult with a qualified financial advisor before making any investment decisions.

Blocky's EMA RibbonA classic EMA ribbon setup.
The script uses eight EMAs, with default lengths ranging from 21 to 55 periods, with an additional EMA with a default length of 200 periods.
The lengths of the EMAs can be customized, when customizing, the shortest time frame should be first and the longest time frame last.
The ribbons gradient strength is calculated based on the EMA's sequence, and their separation.
The color and transparency are set based on the calculated strength. The bolder the color, the stronger the strength.
Use the opacity multiplier to increase/decrease the strength of the gradient. BITSTAMP:BTCUSD
Fast EMA above Slow EMA with MACD (by Coinrule)An exponential moving average ( EMA ) is a type of moving average (MA) that places a greater weight and significance on the most recent data points. The exponential moving average is also referred to as the exponentially weighted moving average . An exponentially weighted moving average reacts more significantly to recent price changes than a simple moving average simple moving average ( SMA ), which applies an equal weight to all observations in the period.
Moving average convergence divergence ( MACD ) is a trend-following momentum indicator that shows the relationship between two moving averages of a security’s price. The MACD is calculated by subtracting the 26-period exponential moving average ( EMA ) from the 12-period EMA .
The result of that calculation is the MACD line. A nine-day EMA of the MACD called the "signal line," is then plotted on top of the MACD line, which can function as a trigger for buy and sell signals. Traders may buy the coin when the MACD crosses above its signal line and sell—or short—the security when the MACD crosses below the signal line. Moving average convergence divergence ( MACD ) indicators can be interpreted in several ways, but the more common methods are crossovers, divergences, and rapid rises/falls.
The Strategy enters and closes the trade when the following conditions are met:
LONG
The MACD histogram turns bullish
EMA8 is greater than EMA26
EXIT
Price increases 3% trailing
Price decreases 1% trailing
This strategy is back-tested from 1 January 2022 to simulate how the strategy would work in a bear market and provides good returns.
Pairs that produce very strong results include AXSUSDT on the 5-minute timeframe. This short timeframe means that this strategy opens and closes trades regularly.
Additionally, the trailing stop loss and take profit conditions can also be changed to match your needs.
The strategy assumes each order is using 30% of the available coins to make the results more realistic and to simulate you only ran this strategy on 30% of your holdings. A trading fee of 0.1% is also taken into account and is aligned to the base fee applied on Binance.

ALMA/EMA/SRSI Strategy + IndicatorBack with another great high hit rate strategy!!
Disclaimer* This strategy was sampled using source code written by @ClassicScott , as referred to in the script, there is a clear line where the source code was scripted by myself.
This Strategy consists of three key factors, the ALMA, EMA crossover, and a Stochastic Rsi
ALMA: The Alma is the step line shown, turning green and red at select times. This average value gives general oversight of the macro movement of price action. and this particular one was coded by Mr.ClassicScott.
EMA crossover: At the input screen you are given an option of the fast and slow ema's. The default is solely for the hit rate and correlation to the Alma of this strategy. The arrows you see depicted on the chart are the crossover events happening.
Stochastic Rsi: The Stochastic Rsi is a stochastic value, using data sampled from the rsi. The use of this indicator in my strategy is to prevent entries when too overbought and oversold, as well as closures and vice versa, to prevent holding bags either way.
Fixed % TP: In the input screen you are given a take profit and stop loss percentage, for good R/R the hit rate will take a notch down, but with no R/R it will be near perfect.
How to use this:
Add it to your chart to get the strategy inputs. (The strategy is really only useful on a 15min TF. However the indicator within it can be used on anything at anytime!)
Watch the yellow and aqua moving averages, these are your ema's and crossover's will trigger signals based on your integer inputs.
Find Correlation between other leading indicators, as well as crossover's down/up and a red/green alma.
DO NOT use the arrows as buy/sell signals. These are simply to show ema's are crossing under or over. Momentum indicator's paired with this can be useful to determine if it could be a buy signal or sell signal.
Cheat Code's Notes:
Almost at 1000 boosts!!! I appreciate the support from everyone and I will keep trying my best to deliver quality strategies for the people.
-Cheat Code
BYBIT:BTCUSDT

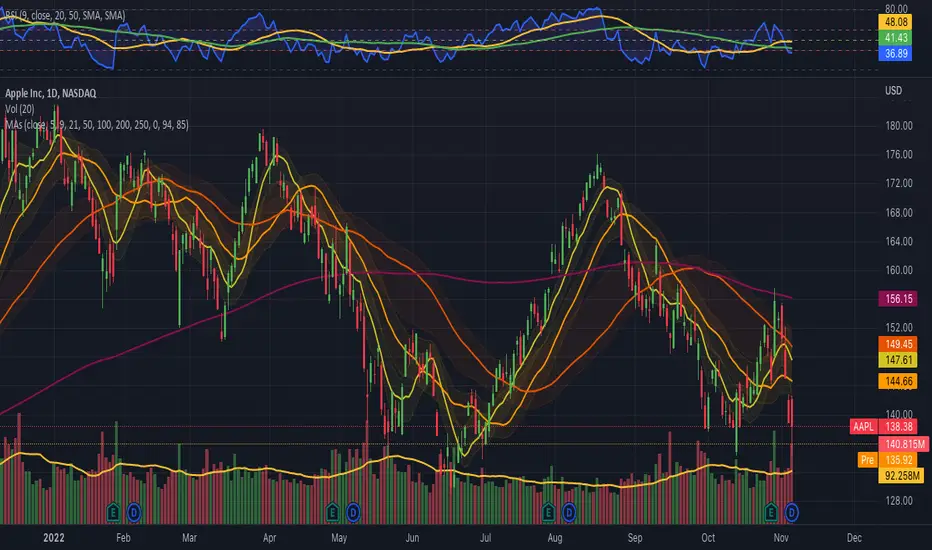
Moving Averages Ribbon (7 EMAs/SMAs)This Indicator provides a combination which is suitable for visualizing many Simple Moving Averages (SMAs) and Exponential Moving Averages (EMAs). There are 7 possible periods 5,9,20,50,100,200,250. There is a possibility to show only EMAs or only SMAs or both. EMAs have thinner curves by default, to be able to distinguish them from SMAs. Additionally, there are highlighted channels between the MAs of the highs and the MAs of the lows, showing a channel of specific moving averages. It comes with a presetting showing EMAs 5,9,20,50,200 and SMAs 9,20,50,200, while the MA channels are only visible for 9 and 50.
EMAs:
SMAs:
Both
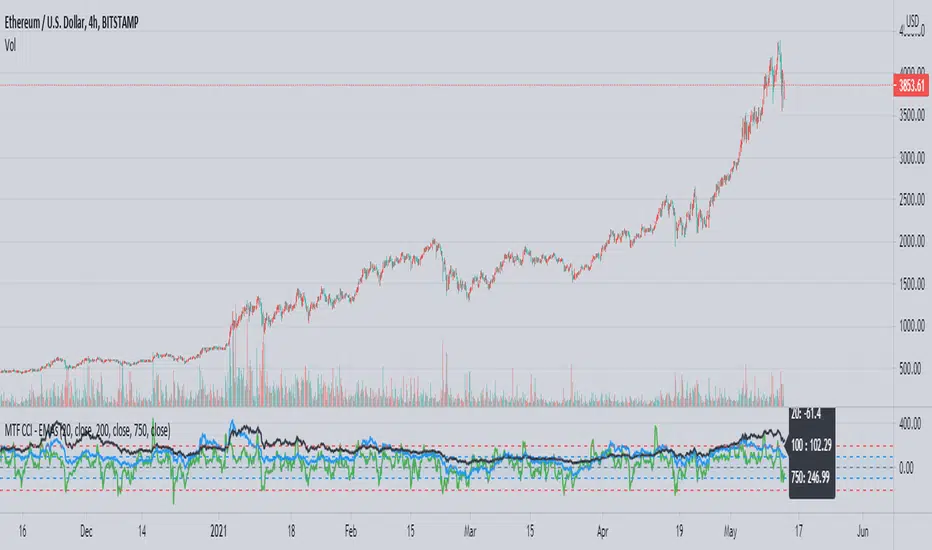
MTF CCI using EMAsThis is a CCI script adapted from 'CCI w EMA by Rick3712' which removes the EMA of the CCI and adds different sized CCI results to the same plot. An info box is also added for easy reference of current values.
CCI is a useful way to see the price's relation to moving averages in a different way, and being able to see the trend strength over time using the larger CCI allows a trader to make better informed decisions when reaching oversold or overbought conditions in relation to the shorter EMAs, such as the 20. You can also see patterns in a trend's strength easier by comparing the movements and levels to find likely areas of a pullback or buying opportunity.
In the example you can see a common level in ETH's parabolic movement on the 4h 750 EMA and 200 EMA that indicates a likely correction area.
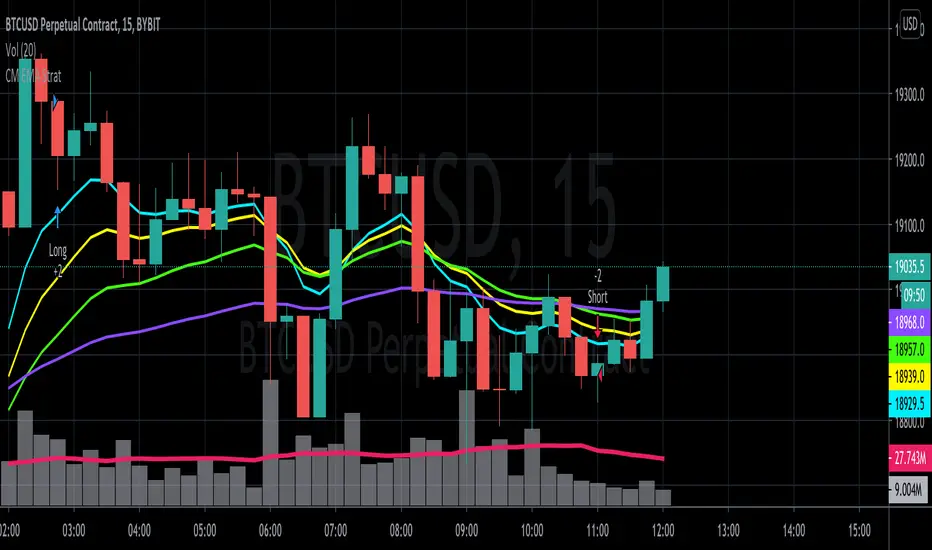
[CM]EMA Trend Cross STRATVISUALLY REPRESENTS THE CROSSING OF 8,13,21,55 EMA'S FROM KROWNS TA PROGRAM
Hello everybody! I was curious and wanted to see how the Strat described in one of the modules would look coded. So here we are, a clear cut visual representation of the methods talked about in the course from the EMA Module. Enjoy!
(Instructions)
Whenever the 8,13,21 all cross above the 55ema that constitutes a long signal.
On the flip side, whenever the 8,13,21 all cross below the 55ema that constitutes a short signal.
(Description)
This indicator shows the cross described in the TA program using the EMAS 8,13,21,55.
The Ema's are editable.(Color)
It plots the entry and exit parameters.
This allows for a more visual representation of the ideology described in the course.
This indicator also doesn't leave room for ambiguity in terms of where a cross happens.
The EMA's can be toggled to show certain ones at certain times.
The indicator can be used as a trend analysis tool.
***In terms of an exit, I find it to be better to use your own judgement, taking account the greater trend.
For example, in a bull market I would advise looking for long signals, rather than try to hop on a counter trend play. Vice Versa in a bear market. It's better for jumping in to the greater momentum.
Crypto EMA+MA+MACS by hobbeLeThis is an indicator that includes several EMAs and MAs (Used in Cryptotrading).
In addition, the Golden and Death Cross are also displayed.
Used MAs
MA 7 - Orange Line
MA 21 - Yellow Line
MA 25 - Grey Line
MA 99 - Blue Line
MA 200 - Green Line
Used EMAs
EMA 200 - Grey Dotted Line
EMA 222 - Pink Dotted Line
Golden Cross
Crossover MA25 + MA200
Death Cross
Crossunder MA25 + MA200
What is a Moving Average (MA) ?
A moving average (MA) is a widely used indicator in technical analysis that helps smooth out price action by filtering out the “noise” from random short-term price fluctuations.
Moving average is a trend-following, or lagging, indicator because it is based on past prices. The most common applications of moving averages are:
to identify the trend direction
to determine support and resistance levels
The two basic and commonly used moving averages are the simple moving average ( SMA ), which is the arithmetic average of a security over a defined number of time periods, and the exponential moving average ( EMA ), which gives greater weight to more recent prices.
What is a Golden Cross?
The golden cross is a candlestick pattern that is a bullish signal in which a relatively short-term moving average crosses above a long-term moving average. The golden cross is a bullish breakout pattern formed from a crossover involving a security's short-term moving average (such as the 15-day moving average) breaking above its long-term moving average (such as the 50-day moving average) or resistance level. As long-term indicators carry more weight, the golden cross indicates a bull market on the horizon and is reinforced by high trading volumes.
What Is a Death Cross?
The death cross is a technical chart pattern indicating the potential for a major selloff. The death cross appears on a chart when a stock’s short-term moving average crosses below its long-term moving average.
Source; Investopedia

ASFX EMAs, ADR, Asian Range, and Pivot PointsThis indicator combines the essential indicators that ASFX traders use, including the EMAs (8, 21, 50, 200, 800), the Average Daily Range, the Asian Range, and the Pivot Points.
The EMAs should be used as dynamic supports and resistances. We could use it to find entries like when there is a bullish engulfing coming off the 21 EMA.
The Average Daily Range tells us the how many pips the pair moves on average. We could use it to measure risk/reward ratios or see it as another resistance.
The Asian Range is displayed as two lines indicating the Asian Session's High and Low. This could help us to determine whether the pair is ready for a breakout. We might avoid setups that are still in the Asian Range as the pair might still be indecisive.
The Pivot Points are also another form of support and resistance which are calculated using the previous day's data. The Pivot Points displayed in this indicator only include the Pivot, R1, R2, R3, S1, S2, S3. (R4, R5, S4, S5 are not included)
All of these indicators should give us a read of the trend. If the EMAs are beautifully fanned out with the 8 EMA on the top and the 800 EMA on the bottom and the price is above the Asian Range and the Pivot, we might keep an eye for a long entry.

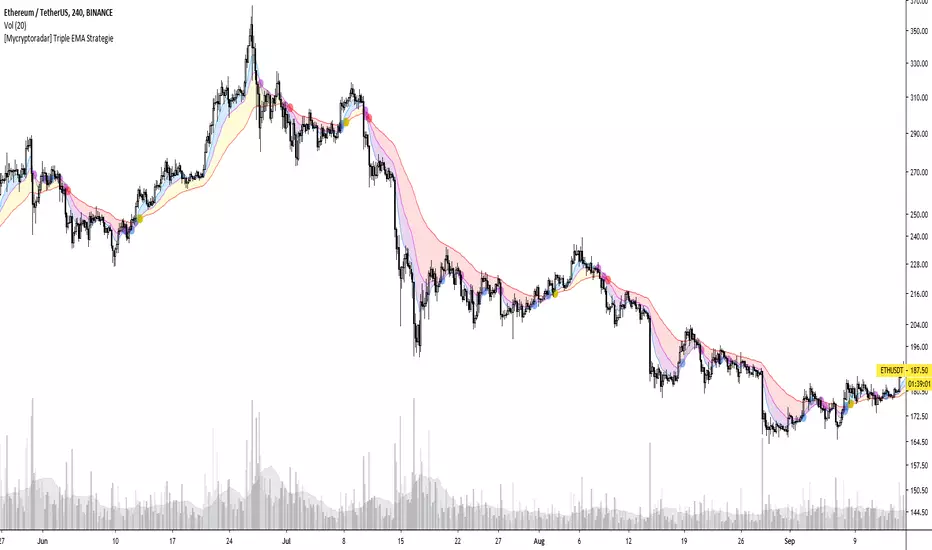
[Mycryptoradar] Triple EMA StrategieTriple EMA strategy consists of EMA 9, 21 & 55. A widely discussed trading strategy. If you want to know more about this strategy, enter the following search term at Google, "triple EMA 9, 21, 55 strategy".
How does this indicator work!
Background blue / yellow = bullish
Background red / purple = bearish
Every EMA crossover can be displayed on the chart (see circles)
Blue / blue / yellow circles = bullish
Purple / purple / red circles = bearish
Play with the settings and adjust them to your hand and don't forget to read about the EMA 9, 21, 55 strategy. Each background and crossover marking can be switched on and off separately.
This indicator visualizes the strategy and is not financial advice, you trade on your own findings. Has the indicator helped you with trading? Then leave a comment and like the indicator.
WANNA TIP ME? BUY ME SOME BEERS!
BTC: 3BMEXX5JrX94ziUSoQMLEmi51WcYwphAg3
ETH: 0x541e504bb461aa141de6ddce09dc89eb16f58f9c
LTC: LPBJXzUZJksCuCK27AY2qAVYGGGiUfejok
DON'T FORGET TO LOOK AT OUR SITE MYCRYPTORADAR
Colored Columns for Elder's Force Index EMAThe Elder's Force Index is an oscillator that takes into account the change of the price combined with the volume:
EFI = (close of the current day - close of the previous day) * volume of the current day
If measure the force of the price change.
If you calculate the exponential moving average of the last two days to smooth the signal EMA(EFI,2), you have a nice buy/sell indicator in the context of the "Elder Triple Screen Method":
- If you are in a long term uptrend (for example ema(13) going up), you have a buy signal if EFI(2)<0, because then you have a short term downtrend in a long term uptrend. Put a "stop buy" a bit higher in case the long term uptrend continues.
- If you are in a long term downtrend (for example ema(13) going down), you have a sell signal if EFI(2)>0, because then you have a short term uptrend in a long term downtrend. Put a "stop sell" a bit lower in case the long term downtrend continues.
This graph shows you colored columns for the EMA(EFI,2), which is more visible than the one-color indicator provided by default by TV.
You can also display the EFI itself on top of the columns. (optional, I personaly do not use it)
PS: ema(13) is to make the explanation simple. Personaly, I use MACD histogram on a weekly view to define if I am on a long term uptrend or downtrend.

SuperMega Static/Dynamic EMA & SMA MultiComboAll the moving averages you'll ever need!!!
5 EMAs
5 SMAs
3 static EMAs
3 static SMAs
Static EMAs and SMAs are shown on every timeframe. For example, you can set static EMAs or SMAs to show 21 day, 50 week and 200 week on every timeframe of the chart. Plus standard 5 EMAs and 5 SMAs (user-defined) is showing for that specific timeframe.

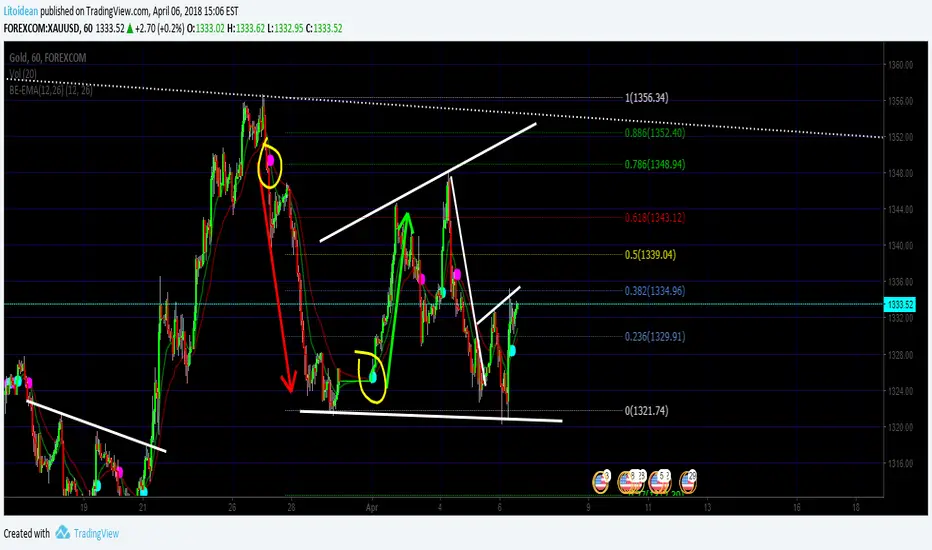
BE-EMA(12,26) (Blue Empire Exponential Moving Average)
Simple EMA where you get a CROSS mark between EMA 12 and EMA 26.
Each time a cross happens, a spot gets created.
If it's cyan, it goes up.
If it's magenta, it goes down.
I'm studying Trading at Blue Empire Academy, if you want to know more send me a PM.
Wave Analysis study the wave's behavior and tries to predict by using trendlines, elliot waves, fibonacci retracements, and EMAs basically.
In this Indicator, It's a confirmation when EMA 12 goes over to confirm the price may go up. and Vice versa.
Hope you like, please share if you think it's useful and comment if you think this can be better.
Thank you again for reading
>> This is just an indicator, it doesn't predict the future. Use it at your own risk. <<
##########
All the credits to @tracks, a genius who helped me polish the code. :] thank you.
LFH/ Long positions using MACD histogram, long EMA and short EMADisclaimer: I'm a noob.
Hey there!
I'm trying to implement a script which enter market long position when long EMA crossover short EMA and MACD histogram is positive and histogram at T time is lesser than histogram at T-1.
And when short EMA crossover long EMA, plus MACD histogram is negative and histogram at T is greater than histogram at T-1, I want the script to exit market long position.
Now, I have something pretty close to what I am looking for. What I am missing and can't figure out yet is:
How to moderate entries, ie. I would like it to enter positions when trends are really interesting not just every time the conditions are fulfilled (same for exits) as there is way too much positions
I need to find a way to exit appropriated positions.

ZeroLag ema + adx = trueCombined LazyBears ZeroLag EMA and CapnOscars moving average ADX. Here's the result.
I figured it could be used as a trend trendtrading system,
ADX red + ema cross downards = short.
ADX green + ema cross up = long.
ADX black + ema cross = no trade
Or something along those line. A way filter out whipsaws.
This is just something I threw together in 5 min, so din't go all in tho. Haven't had time to test.
2 ADX
3 Z-EMAs
Colors/settings can be customized.

RSI-EMA IndicatorThis indicator calculates and plots 2 separate EMAs of the RSI. The default settings below work great on SPX/SPY daily chart. General rule is if an EMA is above 50, the stock's near term outlook is bullish. If an EMA is below 50, the near term outlook is bearish. Personally, I like to use a fast EMA as a buy signal and a slow EMA as a sell signal.
Default settings:
RSI = 50
EMA1 = 100
EMA2 = 200

2-Stage Dashboard (SQZPRO Wide + EMA)Dashboard for Darvas Box EMA momentum traders, located in the bottom right, mostly for quickly screening if a setup is viable.
- EMAs are 9 & 21
- SQZPRO set to wide squeezes
Long setup:
- Green SQZPRO row
- Green EMA row
Short setup:
- Green SQZPRO row
- Red EMA row
