2 Bandas de Bollinguer (10-20) + 4 EMA + 2 SMA 2 BB (10-20) + 4 EMA (35-50-100-200) + 2 SMA (75-100) configurable
Cerca negli script per "4月10日A股市场分析"


(SPY to ES) ETF→Futures Multi-Level (10 Levels + Select All)Converts selected ETF levels (SPY or QQQ) into equivalent futures levels (ES or NQ).
Uses live price ratio between ETF and futures for real-time level translation.
Supports 10 independent levels (A–J) with user-defined ETF price inputs.
Provides checkboxes to toggle each level’s visibility or show all at once.
Applies smoothing (ta.sma) to reduce noise from short-term price movement.
Lets user customize each line’s color, width, and style (solid, dashed, dotted).
Automatically updates lines as new bars form without user interaction.
Uses persistent line objects to keep levels stable when scrolling or zooming.
Adapts to either SPY→ES or QQQ→NQ depending on the “Convert SPY?” toggle.
Draws clean horizontal lines without legend clutter for visual precision.
SOME ONE PUBLISHED THIS FUNCTIONALITY FOR A CHARGE SO I MADE IT FREE.
-rA

SJA WINFUT B3-10
INDICATOR FOR WINFUT B3 – 5-minute chart.
This indicator was designed to trade the Bovespa index futures contract (WINFUT) on the 5-minute chart.
It integrates technical analysis and macroeconomic context elements.
It combines several indicators in which the system calculates a score weighted by color and intensity for each indicator, generating a metric called “STRENGTH %,” which reflects the dominance of buyers (green), sellers (red), or sideways movement (orange) at the moment.
The calculation is adapted to market hours:
Between 9:00 a.m. and 9:59 a.m., it considers only the available indicators; after 10:00 a.m., it uses all data.
The panel displays real-time information, including divergences between strength and price, providing robust decision support for short-term operations on the mini index.
Buying trend.
The more green indicators (at the top of the panel) and dark blue indicators (at the bottom of the panel) and the higher the strength percentage, the greater the probability of buying.
Selling trend.
The more red indicators (at the top of the panel) and dark blue indicators (at the bottom of the panel) and the higher the strength percentage, the greater the probability of selling.
Translated with DeepL.com (free version)

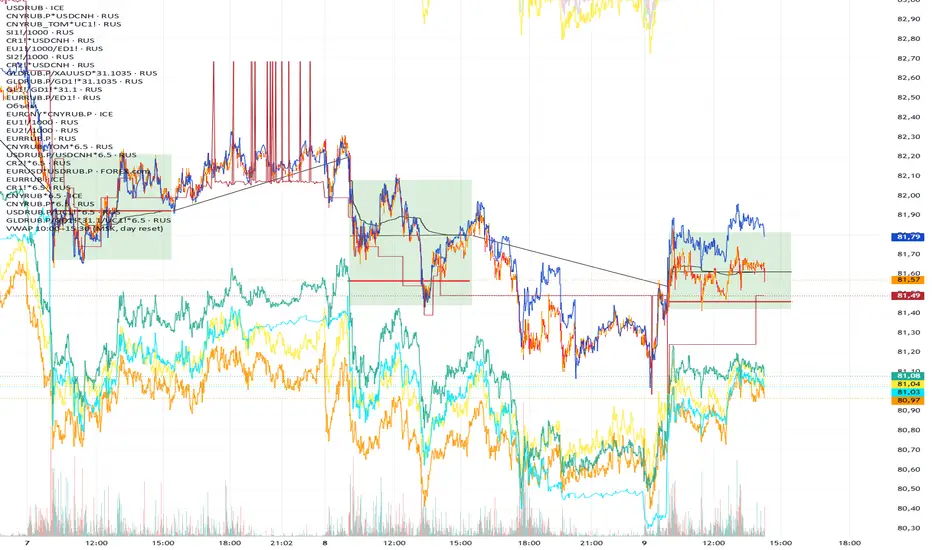
VWAP 10:00–15:00 (MSK, daily reset)Calculates the volume-weighted average price (VWAP) from 10:00 to 15:00 MSK.
The data is used to determine the funding rate of MOEX perpetual futures by comparing the average price of the perpetual contract with the official Central Bank exchange rate on the following day.
30-10-3 MAX,min dynamicsSupported timeframes: The script works only on timeframes of 1 minute or lower (including second-based timeframes).
Displayed levels: The highs and lows of the last closed candle are plotted for the 30-minute, 10-minute, and 3-minute timeframes.
Updates: The levels update only when a candle closes in the respective timeframe (e.g., every 30 minutes for the 30m levels).
Visualization: Dashed lines for highs and lows (blue for 30m, green for 10m, red for 3m).
Labels indicating "Max 30m", "Min 30m", etc., positioned above the highs and below the lows.

30-10-3 MAX,min dinamici Supported timeframes: The script works only on timeframes of 1 minute or lower (including second-based timeframes).
Displayed levels: The highs and lows of the last closed candle are plotted for the 30-minute, 10-minute, and 3-minute timeframes.
Updates: The levels update only when a candle closes in the respective timeframe (e.g., every 30 minutes for the 30m levels).
Visualization: Dashed lines for highs and lows (blue for 30m, green for 10m, red for 3m).
Labels indicating "Max 30m", "Min 30m", etc., positioned above the highs and below the lows.

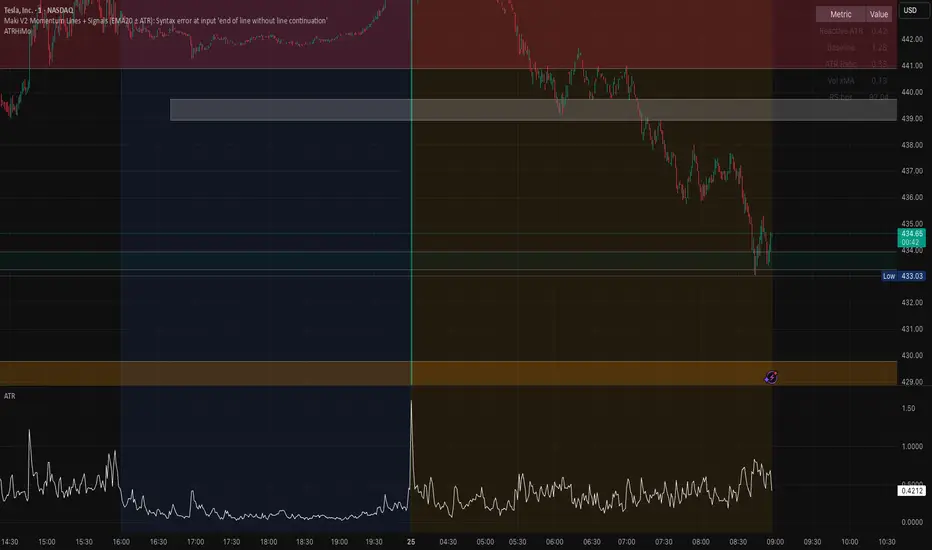
Opening ATR + High Momentum (10/30/60)this is a custom momentum indicator using atr
A fixed, compiling Pine v5 script is below with the three issues corrected: no plots in local scope, a ≤10-character shorttitle, and cleaned ternaries/formatting that remove the “end of line without line continuation” error.
QQQ Ladder → Adjusted to Active Ticker (5s & 10s)This indicator allows you to a grid of QQQ levels directly on futures chart like NQ, MNQ, ES and MES, automatically adjusting for the spread between the displayed symbol and QQQ. This is particularly useful for traders who perform technical analysis on QQQ but execute trades on Futures.
Features:
Renders every 5 and 10 points steps of QQQ in your current chart.
The script adjusts these levels in real-time based on the current spread between QQQ and the displayed symbol!
Plots updated horizontal lines that move with the spread
Supports Multiple Tickers, ES1!, MES1!, NQ1!, MNQ1! SPY and SPX500USD.

NDX Ladder → Adjusted to Active Ticker (5s & 10s)This indicator allows you to a grid of NDX levels directly on the NQ! (E-mini NASDAQ 100 Futures) chart, automatically adjusting for the spread between NDX and NQ1!. This is particularly useful for traders who perform technical analysis on SPX but execute trades on NQ1!.
Features:
Renders every 5 and 10 points steps of the NDX in your current chart.
The script adjusts these levels in real-time based on the current spread between NDX and NQ / MNQ
Plots updated horizontal lines that move with the spread

SPX Ladder → Adjusted to Active Ticker (5s & 10s)This indicator allows you to a grid of SPX levels directly on the ES1! (E-mini S&P 500 Futures) chart, automatically adjusting for the spread between SPX and ES1!. This is particularly useful for traders who perform technical analysis on SPX but execute trades on ES1!.
Features:
Renders every 5 and 10 points steps of the SPX in your current chart.
The script adjusts these levels in real-time based on the current spread between SPX and ES1!
Plots updated horizontal lines that move with the spread
Supports Multiple Tickers, ES1!, SPY and SPX500USD.
Ideal for futures traders who want SPX context while trading ES1!.

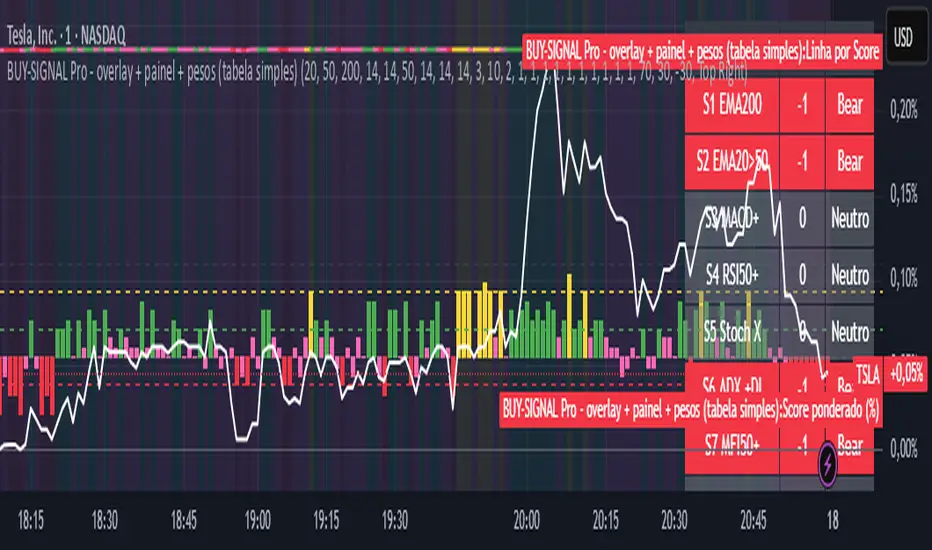
BUY-SIGNAL Pro - 10 Indicators - Strategy Godinho 2Best 10 indicators
Strong buy YELLOW
Buy GREEN
Hold PINK
Sell RED
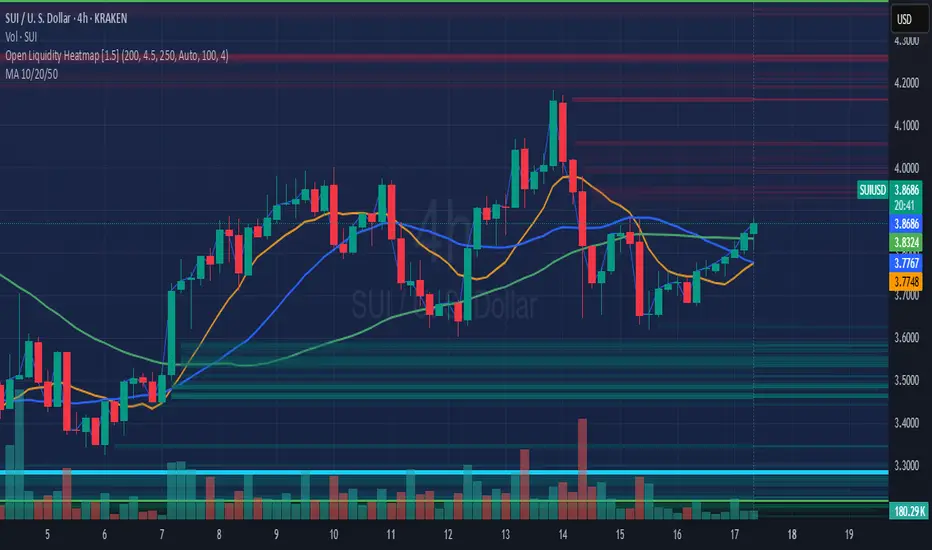
MA 10/20/50A Simple MA array including 10, 20, and 50 day.
Used primarily for determining crypto bullish or bearish technical trending primarily on the 1-day chart.
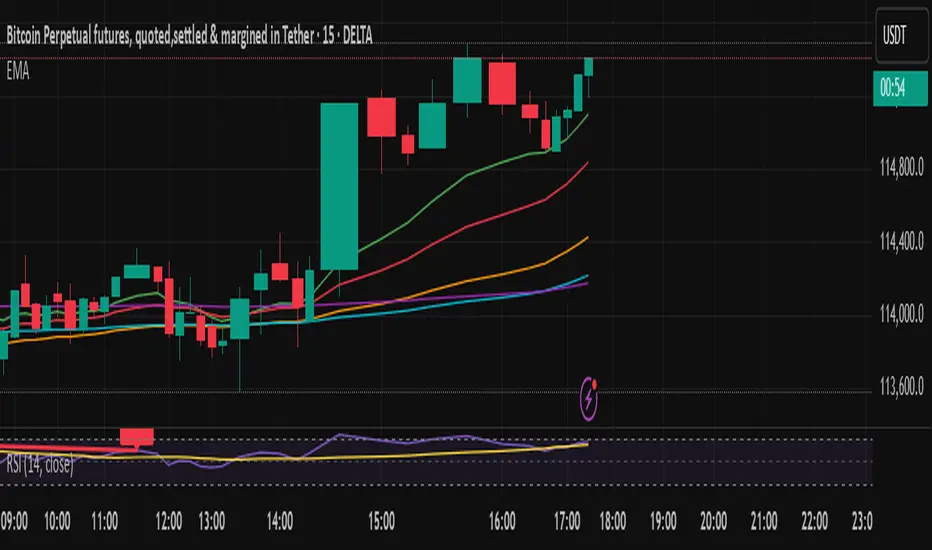
EMA 10/20/50/100/200plot 10, 20, 50,100,200 EMA on the chart. can be used to determine on any timeframe EMA
EMA 10/20 Crossover BackgroundThis script works best on a weekly chart and it taints the background green if the EMA-10 is larger than EMA-20 (EMA lengths can be configured) and red otherwise. I use this script to immediately determine if a market is trending upwards or downwards.

EMA 10,20 SMA 50, 200This indicator is very helpful for swing traders who plan their trades using EMAs and SMAs. It is used on the daily chart and displays the 10- and 20-EMA, as well as the 50- and 200-SMA.

🔫 10:00 AM Candle Range – Bhavishya Sniper ScriptMarks the 10:00 AM candle high and low for intraday breakout trading. Designed for Bhavishya’s sniper entry system during Trading Reset 3.0."

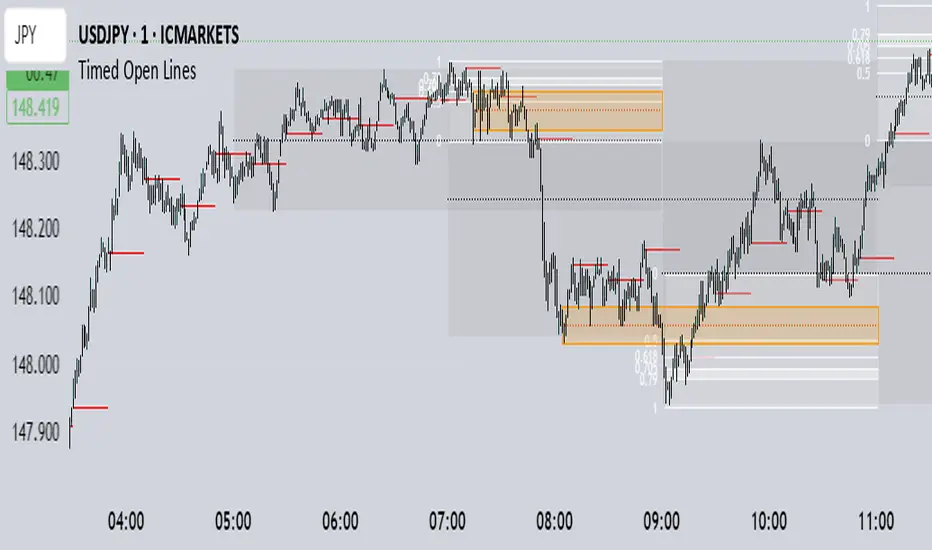
Bill Mensah - 10 / 30 / 50 Minute Open Lines Scientia maledictus sum.
Opening Macro lines extended, 10 / 30 / 50 Minute Open Lines
EMA 10/20/50 Alignment Strategy### 📘 **Strategy Name**
**EMA 10/20/50 Trend Alignment Strategy**
---
### 📝 **Description (for Publishing)**
This strategy uses the alignment of Exponential Moving Averages (EMAs) to identify strong bullish trends. It enters a long position when the short-term EMA is above the mid-term EMA, which is above the long-term EMA — a classic sign of trend strength.
#### 🔹 Entry Criteria:
* **EMA10 > EMA20 > EMA50**: A bullish alignment that signals momentum in an upward direction.
* The strategy enters a **long position** when this alignment occurs.
#### 🔹 Exit Criteria:
* The long position is closed when the EMA alignment breaks (i.e., the trend weakens or reverses).
#### 🔹 Additional Features:
* Includes a **date range filter**, allowing you to backtest the strategy over a specific period.
* Uses **100% of available capital** for each trade (position size auto-scales with account balance).
* No short positions, stop loss, or take profit are applied — this is a trend-following strategy meant to ride bullish moves.
---
### ✅ Best For:
* Traders looking for a **simple, trend-based entry system**
* Testing price momentum strategies during specific market regimes
* Visualizing EMA stacking patterns in historical data

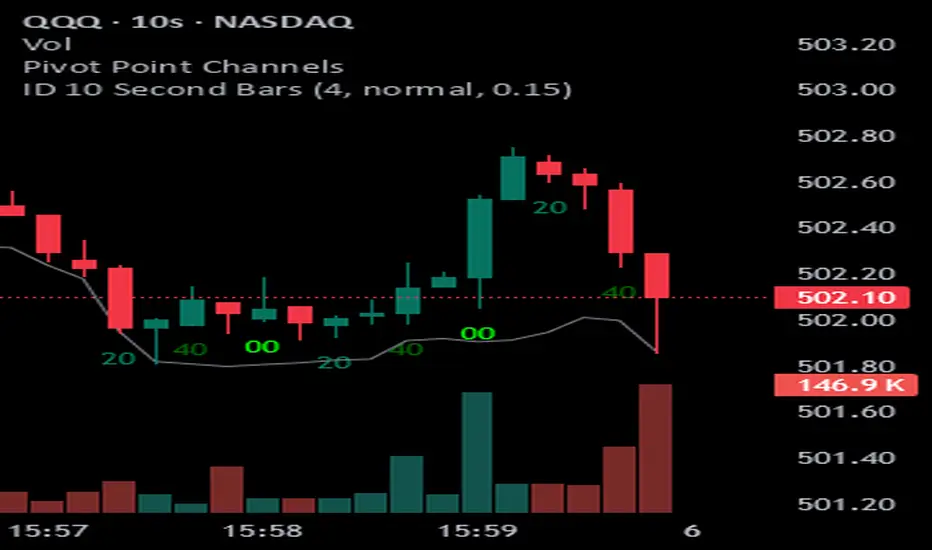
ID 10 Second BarsEnters numbers 1, 3 and 5 under the appropriate bars on the 10 second chart and permits you to adjust the colors of each number.
SMA 10/20 Trend Info Table - QullamaggieThe Qullamaggie Index Trend Filter is a momentum-based technical indicator designed to identify strong bullish or bearish trends in the market by analyzing the relationship and movement of two simple moving averages (SMAs): the 10-period SMA and the 20-period SMA. It simplifies trend analysis and provides clear visual cues for traders to align their trades with the prevailing market direction.

ORB Daily 10 min (9:30am-3pm)This script implements the Opening Range Breakout (ORB) strategy for the New York trading session, specifically from 9:30 AM to 3:00 PM (Eastern Time). It identifies the high and low of the first 10 minutes (the first two 5-minute candles) after the market opens and draws a box representing this range. The box remains on the chart throughout the day until 3:00 PM. This strategy is useful for traders looking to trade breakouts of the opening range, often indicating potential trends or reversals.
