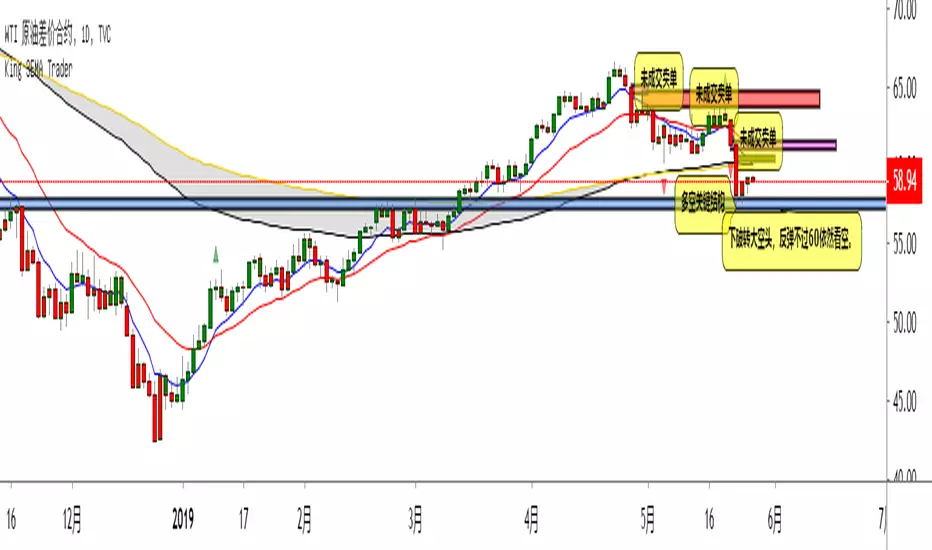
Edward EMA 8-21-89-144Explain the application of moving averages through the disk surface:
When the price runs above 89, it only looks for the buy signal.
When the price runs below 89, it only looks for sell signals.
The first step up through the 89 moving average after the first confirmation can buy homeoply,
The first pull down after crossing the 89 moving average for the first time confirms that it can be sold in line with the trend.
Price horizontal finishing, moving average frequently across the field observation.
The yellow area in the interval from 8 to 21 is the homeopathic warehouse addition signal.
When the price is above the 89 moving average, the k-line closes below the 21-day moving average as a callback signal
Prices below the 89 ema close above the 21 - day ema as a rebound signal
After the correction and rebound signals come out, we should make half of the profit and the other half of the stop loss in the break-even place.
Moving average is very suitable for the trend of strong varieties, is not suitable for volatile market.
Only at the end of the shock market moving average upward or downward divergent when it is possible to be used.
1. Repeatedly entangle the mean line of horizontal disk stage and observe it from the field
2. Sell the three EMA moving averages when they can't exceed 89EMA with downward crossing
3, many times can not break the new low when prices go sideways profit
4. Buy when the price reaches 89EMA after the convergence of triangle 3 is broken
5, the Angle of price rise slowed and closed below the 21 moving average when profit
6. Left field observation during transverse oscillation.
Sit tight while news or data cause prices to fall quickly
8. Buy when the price triangle breaks through the 89 moving average upward
9, the price does not rise to slow down when the horizontal closed below the 21 moving average when profit
10, price horizontal shock finishing at the same time the average line also transverse finishing field observation
11, the price of the triangle after finishing through the 89 moving average to buy.At this point all the averages have turned up
12, the second time can not break through the new high when the negative line can profit
13, the price of the first time in the same period of time through 89 after the first step back can be re-bought.
通过盘面讲解均线运用:
价格在89上面运行时时只找买入信号、
价格在89下面运行时只寻找卖出信号、
第一次向上穿过89均线后的第一次回踩确认可以顺势买入、
第一次向下穿过89均线后的第一次回抽确认可以顺势卖出、
价格横盘整理,均线频繁穿越时离场观察。
8-21区间里面黄色区域为顺势加仓信号,
价格在89均线上面时K线收盘在21天均线下面时为回调信号
价格在89均线下面时K线收盘在21天均线上面时为反弹信号
在回调和反弹信号出来之后我们应该获利一半的头寸,另外一半止损放到盈亏平衡的地方。
均线非常适合趋势性很强的品种,并不适合震荡行情。
只有在震荡行情结束时均线向上或向下发散时才有被运用的可能。
1、横盘阶段均线反复纠缠,离场观察
2、三条EMA均线向下交叉回抽无法超越89EMA时卖出
3、多次不能破新低时价格走横时获利
4、价格在3处三角形收敛被突破后站上了89EMA时买入
5、价格上涨角度变缓并收盘在21均线下面时获利
6、横盘震荡时离场观察。
7、见死不救新闻或数据导致价格快速下跌时观望
8、价格三角形向上突破时穿过89均线时买入
9、价格不升减速走横时收盘于21均线下面时获利
10、价格横盘震荡整理同时均线也横向整理时离场观察
11、价格突破三角形整理后重新穿过89均线时买入。此时所有均线已经向上翘头
12、第二次不能突破新高时收阴线可以获利
13、价格在同一个时间周期内第一次穿过89以后的第一次回踩可以重新买入
14、89-144作为牛熊的分水岭。在89-144区域之下只考虑做空,89-144只考虑做多。如果89-144走横则以位置决定高位倾向空低位倾向多。
15、K线会因为指标的设置自动变成两个颜色块,绿色看涨,红色看跌。做趋势看K线颜色。牛市的红色可以当成入场K熊市绿色当成入场K
Cerca negli script per "89年属蛇运势"
KingEMA21-55-89-144I used the moving average with the habit of 21-55, so added two moving average, one is the short line 8EMA, the other is the medium and long line 89ema
Explain the application of moving averages through the disk surface:
When the price runs above 89, it only looks for the buy signal.
When the price runs below 89, it only looks for sell signals.
The first step up through the 89 moving average after the first confirmation can buy homeoply,
The first pull down after crossing the 89 moving average for the first time confirms that it can be sold in line with the trend.
Price horizontal finishing, moving average frequently across the field observation.
The yellow area in the interval from 8 to 21 is the homeopathic warehouse addition signal.
When the price is above the 89 moving average, the k-line closes below the 21-day moving average as a callback signal
Prices below the 89 ema close above the 21 - day ema as a rebound signal
After the correction and rebound signals come out, we should make half of the profit and the other half of the stop loss in the break-even place.
Moving average is very suitable for the trend of strong varieties, is not suitable for volatile market.
Only at the end of the shock market moving average upward or downward divergent when it is possible to be used.
1. Repeatedly entangle the mean line of horizontal disk stage and observe it from the field
2. Sell the three EMA moving averages when they can't exceed 89EMA with downward crossing
3, many times can not break the new low when prices go sideways profit
4. Buy when the price reaches 89EMA after the convergence of triangle 3 is broken
5, the Angle of price rise slowed and closed below the 21 moving average when profit
6. Left field observation during transverse oscillation.
Sit tight while news or data cause prices to fall quickly
8. Buy when the price triangle breaks through the 89 moving average upward
9, the price does not rise to slow down when the horizontal closed below the 21 moving average when profit
10, price horizontal shock finishing at the same time the average line also transverse finishing field observation
11, the price of the triangle after finishing through the 89 moving average to buy.At this point all the averages have turned up
12, the second time can not break through the new high when the negative line can profit
13, the price of the first time in the same period of time through 89 after the first step back can be re-bought.
中文翻译
价格在89上面运行时时只找买入信号、
价格在89下面运行时只寻找卖出信号、
第一次向上穿过89均线后的第一次回踩确认可以顺势买入、
第一次向下穿过89均线后的第一次回抽确认可以顺势卖出、
价格横盘整理,均线频繁穿越时离场观察。
8-21区间里面黄色区域为顺势加仓信号,
价格在89均线上面时K线收盘在21天均线下面时为回调信号
价格在89均线下面时K线收盘在21天均线上面时为反弹信号
在回调和反弹信号出来之后我们应该获利一半的头寸,另外一半止损放到盈亏平衡的地方。
均线非常适合趋势性很强的品种,并不适合震荡行情。
只有在震荡行情结束时均线向上或向下发散时才有被运用的可能。
1、横盘阶段均线反复纠缠,离场观察
2、三条EMA均线向下交叉回抽无法超越89EMA时卖出
3、多次不能破新低时价格走横时获利
4、价格在3处三角形收敛被突破后站上了89EMA时买入
5、价格上涨角度变缓并收盘在21均线下面时获利
6、横盘震荡时离场观察。
7、见死不救新闻或数据导致价格快速下跌时观望
8、价格三角形向上突破时穿过89均线时买入
9、价格不升减速走横时收盘于21均线下面时获利
10、价格横盘震荡整理同时均线也横向整理时离场观察
11、价格突破三角形整理后重新穿过89均线时买入。此时所有均线已经向上翘头
12、第二次不能突破新高时收阴线可以获利
13、价格在同一个时间周期内第一次穿过89以后的第一次回踩可以重新买入
14、21-55作为牛熊的分水岭。在21-55区域之下只考虑做空,21-55之上只考虑做多。如果21-55走横则以位置决定高位倾向空低位倾向多。
15、K线会因为指标的设置自动变成两个颜色块,绿色看涨,红色看跌。做趋势看K线颜色。牛市的红色可以当成入场K熊市绿色当成入场K

KingEMA8-21-55-89I used the moving average with the habit of 21-55, so added two moving average, one is the short line 8EMA, the other is the medium and long line 89ema
Explain the application of moving averages through the disk surface:
When the price runs above 89, it only looks for the buy signal.
When the price runs below 89, it only looks for sell signals.
The first step up through the 89 moving average after the first confirmation can buy homeoply,
The first pull down after crossing the 89 moving average for the first time confirms that it can be sold in line with the trend.
Price horizontal finishing, moving average frequently across the field observation.
The yellow area in the interval from 8 to 21 is the homeopathic warehouse addition signal.
When the price is above the 89 moving average, the k-line closes below the 21-day moving average as a callback signal
Prices below the 89 ema close above the 21 - day ema as a rebound signal
After the correction and rebound signals come out, we should make half of the profit and the other half of the stop loss in the break-even place.
Moving average is very suitable for the trend of strong varieties, is not suitable for volatile market.
Only at the end of the shock market moving average upward or downward divergent when it is possible to be used.
1. Repeatedly entangle the mean line of horizontal disk stage and observe it from the field
2. Sell the three EMA moving averages when they can't exceed 89EMA with downward crossing
3, many times can not break the new low when prices go sideways profit
4. Buy when the price reaches 89EMA after the convergence of triangle 3 is broken
5, the Angle of price rise slowed and closed below the 21 moving average when profit
6. Left field observation during transverse oscillation.
Sit tight while news or data cause prices to fall quickly
8. Buy when the price triangle breaks through the 89 moving average upward
9, the price does not rise to slow down when the horizontal closed below the 21 moving average when profit
10, price horizontal shock finishing at the same time the average line also transverse finishing field observation
11, the price of the triangle after finishing through the 89 moving average to buy.At this point all the averages have turned up
12, the second time can not break through the new high when the negative line can profit
13, the price of the first time in the same period of time through 89 after the first step back can be re-bought.
中文翻译
价格在89上面运行时时只找买入信号、
价格在89下面运行时只寻找卖出信号、
第一次向上穿过89均线后的第一次回踩确认可以顺势买入、
第一次向下穿过89均线后的第一次回抽确认可以顺势卖出、
价格横盘整理,均线频繁穿越时离场观察。
8-21区间里面黄色区域为顺势加仓信号,
价格在89均线上面时K线收盘在21天均线下面时为回调信号
价格在89均线下面时K线收盘在21天均线上面时为反弹信号
在回调和反弹信号出来之后我们应该获利一半的头寸,另外一半止损放到盈亏平衡的地方。
均线非常适合趋势性很强的品种,并不适合震荡行情。
只有在震荡行情结束时均线向上或向下发散时才有被运用的可能。
1、横盘阶段均线反复纠缠,离场观察
2、三条EMA均线向下交叉回抽无法超越89EMA时卖出
3、多次不能破新低时价格走横时获利
4、价格在3处三角形收敛被突破后站上了89EMA时买入
5、价格上涨角度变缓并收盘在21均线下面时获利
6、横盘震荡时离场观察。
7、见死不救新闻或数据导致价格快速下跌时观望
8、价格三角形向上突破时穿过89均线时买入
9、价格不升减速走横时收盘于21均线下面时获利
10、价格横盘震荡整理同时均线也横向整理时离场观察
11、价格突破三角形整理后重新穿过89均线时买入。此时所有均线已经向上翘头
12、第二次不能突破新高时收阴线可以获利
13、价格在同一个时间周期内第一次穿过89以后的第一次回踩可以重新买入
14、21-55作为牛熊的分水岭。在21-55区域之下只考虑做空,21-55之上只考虑做多。如果21-55走横则以位置决定高位倾向空低位倾向多。
15、K线会因为指标的设置自动变成两个颜色块,绿色看涨,红色看跌。做趋势看K线颜色。牛市的红色可以当成入场K熊市绿色当成入场K

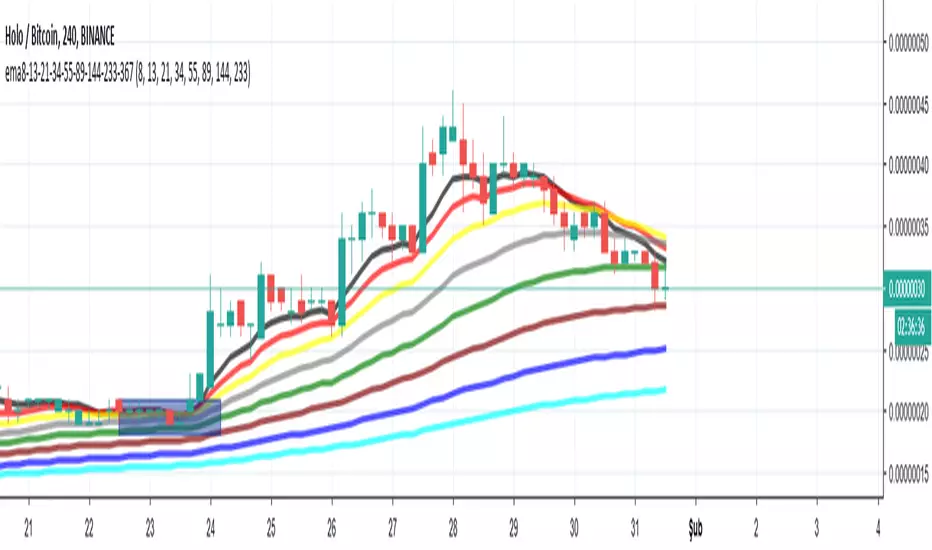
7 Fibo EMAs 21 55 89 144 169 288 338List out 21 55 89 144 169 288 338 ema AND Highlight the 21/55/89/144 days ma spot.
All numbers are FIBO Numbers.
21 IS SHORT TERM EMA
55 IS MIDDLE TERM EMA
144 IS LONG TERM EMA,
YOU MIGHT COMPARE 55/89 EMA IF 55 IS ABOVE, THEN IS UPTREND, BUT IT IS VERY VERY SENSITIVE.
Or YOU MIGHT COMPARE 89/144 EMA, IF 89 IS ABOVE, THEN IS UPTREND, SENSITIVE.
HIGHLY RECOMMEND 144 169/ 288 338, IT IS MORE STABLE TREND SUGGESTION.
ALSO, I HIGHLIGHT THE PRICE SPOT 21 DAYS AGO,55DAYS AGO, AND 89 DAYS AGO AND 144 DAYS AGO, IF THE CURRENT PRICE IS ABOVE THIS PRICE, THEN THE MA WILL TURN UP, IT IS ALSO A SIGNAL.

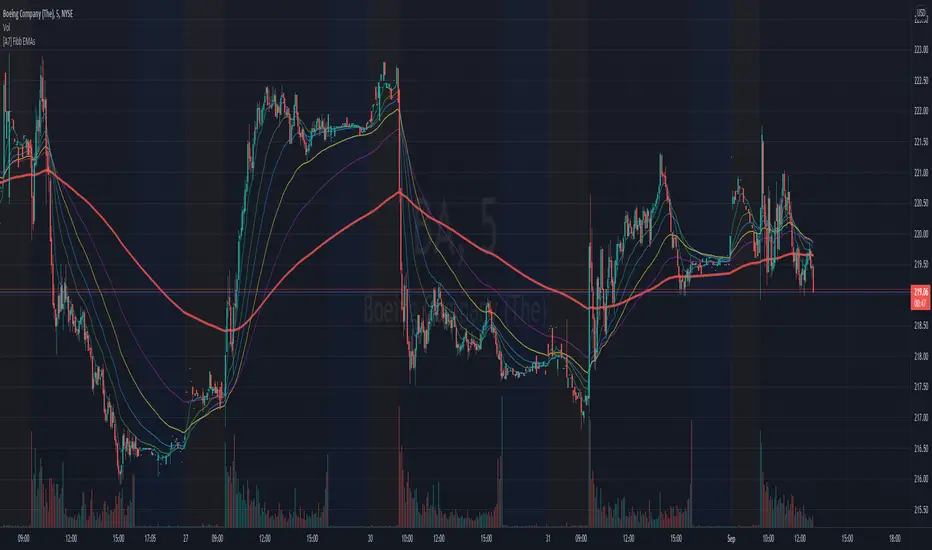
[A7] Fibonacci EMAs (8,21,34,55,89,233) Fibonacci EMAs (8,21,34,55,89,233)
Fibonacci Exponential Moving Averages
8 - aqua
21 - green
34 - blue
55 - yellow
89 - purple
233 - red
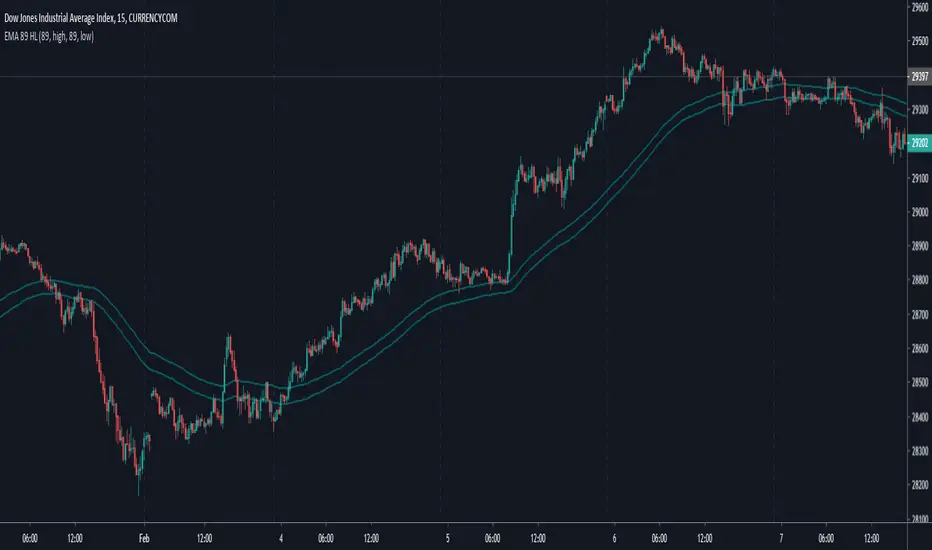
Exponential Moving Average 89Exponential Moving Average 89
Plots Exponential Moving Average 89 High Low
EMA 89 và EMA 34 - MTF AlertEMA34/89 in MTF and alert. If you want to find indicator for alert, I thing it for you

EMA 5,15,35,89,200 BY NUTPlots exponential moving average on four timeframes at once for rapid indication of momentum shift as well as slower-moving confirmations.
Displays EMA 5, 15, 35, 89 and 200... default colors are hotter for faster timeframes, cooler for slower ones
ขอบคุณครับ

Fibonacci EMA averages (21, 34, 55, 89, 144)Just a simple script that plots the following EMA averages that are based on the fibonacci sequence: 21, 34, 55, 89, 144


EMA 34, 89, 200 e cruzamento das EMAMédias exponenciais 34, 89 e 200 e estrategia de compra e venda com cruzamento das medias.

Multiple EMA 34(low-close-high)/89 by EricThis script supports for multiple EMA 34(low-close-high)/89 indicator.

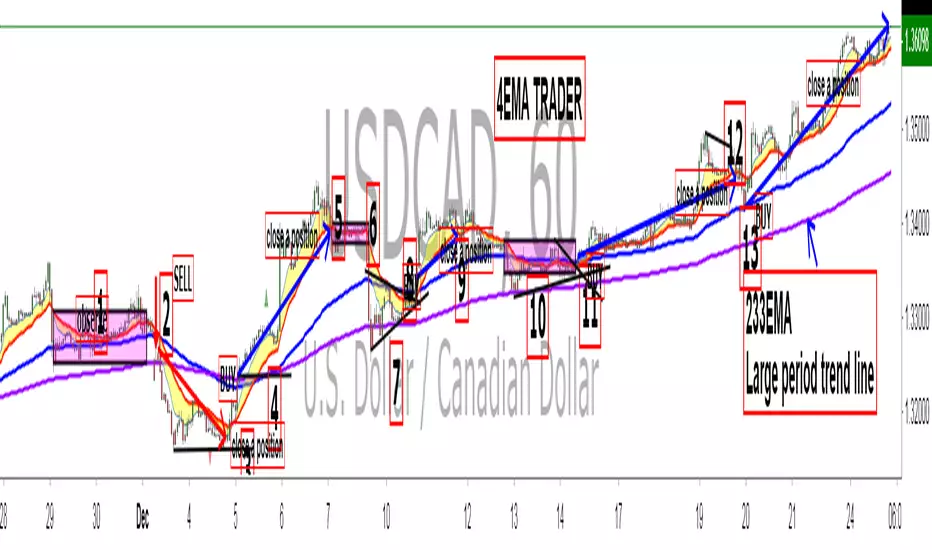
King 4EMA TraderKing 4EMA trader 8/21/89EMA+(233)V3.3
Explain the application of moving averages through the disk surface:
When the price runs above 89, it only looks for the buy signal.
When the price runs below 89, it only looks for sell signals.
The first step up through the 89 moving average after the first confirmation can buy homeoply,
The first pull down after crossing the 89 moving average for the first time confirms that it can be sold in line with the trend.
Price horizontal finishing, moving average frequently across the field observation.
The yellow area in the interval from 8 to 21 is the homeopathic warehouse addition signal.
When the price is above the 89 moving average, the k-line closes below the 21-day moving average as a callback signal
Prices below the 89 ema close above the 21 - day ema as a rebound signal
After the correction and rebound signals come out, we should make half of the profit and the other half of the stop loss in the break-even place.
Moving average is very suitable for the trend of strong varieties, is not suitable for volatile market.
Only at the end of the shock market moving average upward or downward divergent when it is possible to be used.
1. Repeatedly entangle the mean line of horizontal disk stage and observe it from the field
2. Sell the three EMA moving averages when they can't exceed 89EMA with downward crossing
3, many times can not break the new low when prices go sideways profit
4. Buy when the price reaches 89EMA after the convergence of triangle 3 is broken
5, the Angle of price rise slowed and closed below the 21 moving average when profit
6. Left field observation during transverse oscillation.
Sit tight while news or data cause prices to fall quickly
8. Buy when the price triangle breaks through the 89 moving average upward
9, the price does not rise to slow down when the horizontal closed below the 21 moving average when profit
10, price horizontal shock finishing at the same time the average line also transverse finishing field observation
11, the price of the triangle after finishing through the 89 moving average to buy.At this point all the averages have turned up
12, the second time can not break through the new high when the negative line can profit
13, the price of the first time in the same period of time through 89 after the first step back can be re-bought.
通过盘面讲解均线运用:
价格在89上面运行时时只找买入信号、
价格在89下面运行时只寻找卖出信号、
第一次向上穿过89均线后的第一次回踩确认可以顺势买入、
第一次向下穿过89均线后的第一次回抽确认可以顺势卖出、
价格横盘整理,均线频繁穿越时离场观察。
8-21区间里面黄色区域为顺势加仓信号,
价格在89均线上面时K线收盘在21天均线下面时为回调信号
价格在89均线下面时K线收盘在21天均线上面时为反弹信号
在回调和反弹信号出来之后我们应该获利一半的头寸,另外一半止损放到盈亏平衡的地方。
均线非常适合趋势性很强的品种,并不适合震荡行情。
只有在震荡行情结束时均线向上或向下发散时才有被运用的可能。
1、横盘阶段均线反复纠缠,离场观察
2、三条EMA均线向下交叉回抽无法超越89EMA时卖出
3、多次不能破新低时价格走横时获利
4、价格在3处三角形收敛被突破后站上了89EMA时买入
5、价格上涨角度变缓并收盘在21均线下面时获利
6、横盘震荡时离场观察。
7、见死不救新闻或数据导致价格快速下跌时观望
8、价格三角形向上突破时穿过89均线时买入
9、价格不升减速走横时收盘于21均线下面时获利
10、价格横盘震荡整理同时均线也横向整理时离场观察
11、价格突破三角形整理后重新穿过89均线时买入。此时所有均线已经向上翘头
12、第二次不能突破新高时收阴线可以获利
13、价格在同一个时间周期内第一次穿过89以后的第一次回踩可以重新买入。
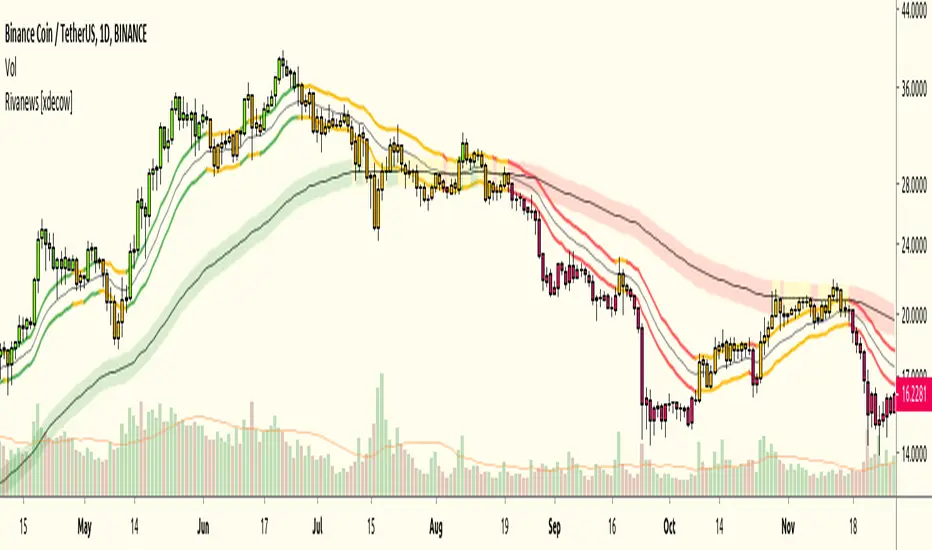
Rivanews Setup - Riva-Keltner, Média Rock [xdecow]This setup was created by Rivadavila S. Malheiros
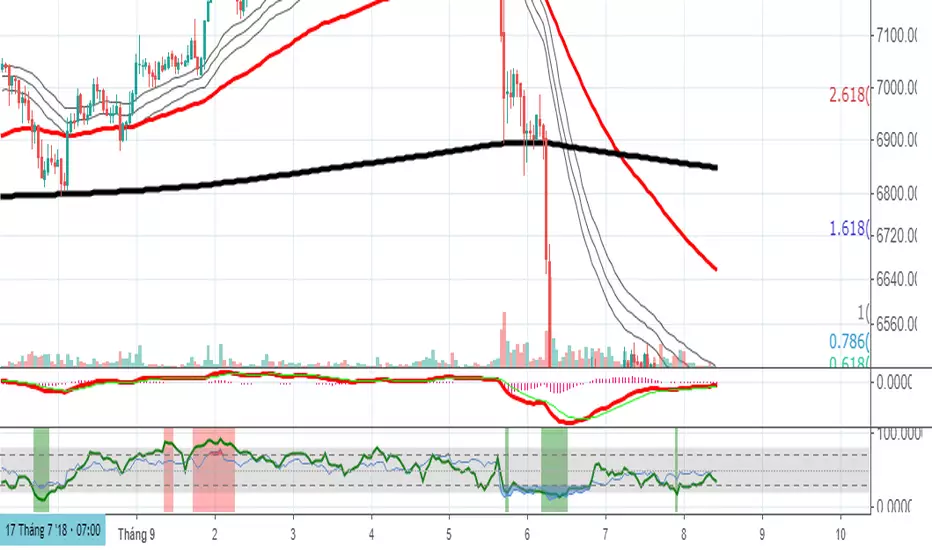
There are 2 Keltner Channels with exponential moving averages of 21 (riva) and 89 (rock) and ATR multiplier of 0.618.
When the price is between the bands, it is a sign of consolidation (yellow).
When the price is above the bands, it is an upward trend (green).
When the price is below the bands, it is a downward trend (red).
When the price crosses rock 89 and closes up / down, it may be a sign of a reversal. But it has a high probability of testing rock 89 again.
------------------------------------------------------------------------------------------
PT-BR
Este setup foi criado por Rivadavila S. Malheiros
São 2 Keltner Channels com médias móveis exponenciais de 21 (riva) e 89 (rock) e multiplicador do ATR de 0.618.
Quando o preço está entre as bandas, é sinal de consolidação (amarelo).
Quando o preço está acima das bandas, é uma tendencia de alta (verde).
Quando o preço está abaixo das bandas, é uma tendencia de baixa (vermelho).
Quando o preço cruza a rock 89 e fecha acima/abaixo, pode ser sinal de reversão. Mas tem uma alta probabilidade de testar a rock 89 novamente.
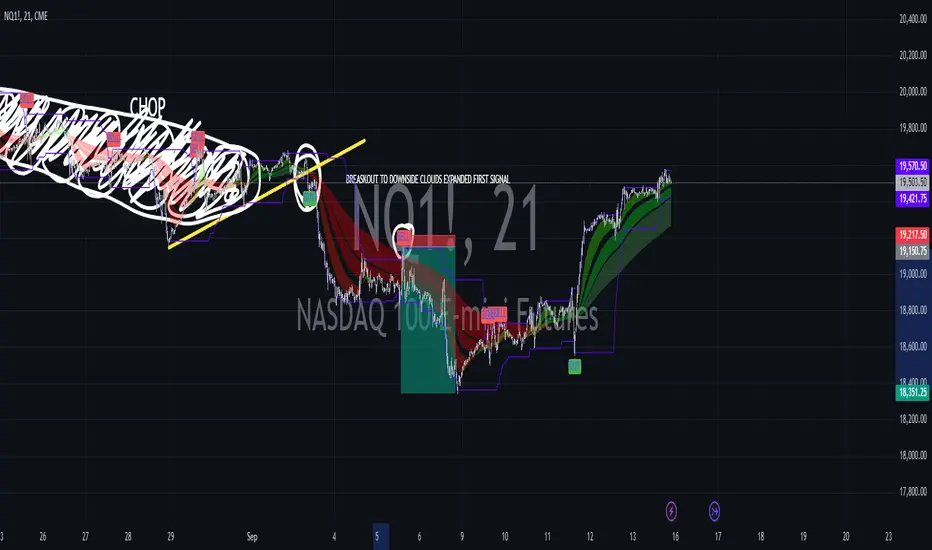
Combined EMA, SMMA, and 60-Day Cycle Indicator V2What This Script Does:
This script is designed to help traders visualize market trends and generate trading signals based on a combination of moving averages and price action. Here's a breakdown of its components and functionality:
Moving Averages:
EMAs (Exponential Moving Averages): These are indicators that smooth out price data to help identify trends. The script uses several EMAs:
200 EMA: A long-term trend indicator.
400 EMA: An even longer-term trend indicator.
55 EMA: A medium-term trend indicator.
89 EMA: Another medium-term trend indicator.
SMMA (Smoothed Moving Average): Similar to EMAs but with different smoothing. The script calculates:
21 SMMA: Short-term smoothed average.
9 SMMA: Very short-term smoothed average.
Cycle High and Low:
60-Day Cycle: The script looks back over the past 60 days to find the highest price (cycle high) and the lowest price (cycle low). These are plotted as horizontal lines on the chart.
Color-Coded Clouds:
Clouds: The script fills the area between certain EMAs with color-coded clouds to visually indicate trend conditions:
200 EMA vs. 400 EMA Cloud: Green when the 200 EMA is above the 400 EMA (bullish trend) and red when it’s below (bearish trend).
21 SMMA vs. 9 SMMA Cloud: Orange when the 21 SMMA is above the 9 SMMA and green when it’s below.
55 EMA vs. 89 EMA Cloud: Light green when the 55 EMA is above the 89 EMA and red when it’s below.
Trading Signals:
Buy Signal: This is shown when:
The price crosses above the 60-day low and
The EMAs indicate a bullish trend (e.g., the 200 EMA is above the 400 EMA and the 55 EMA is above the 89 EMA).
Sell Signal: This is shown when:
The price crosses below the 60-day high and
The EMAs indicate a bearish trend (e.g., the 200 EMA is below the 400 EMA and the 55 EMA is below the 89 EMA).
How It Helps Traders:
Trend Visualization: The colored clouds and EMA lines help you quickly see whether the market is in a bullish or bearish phase.
Trading Signals: The script provides clear visual signals (buy and sell labels) based on specific market conditions, helping you make more informed trading decisions.
In summary, this script combines several tools to help identify market trends and provide buy and sell signals based on price action relative to a 60-day high/low and the positioning of moving averages. It’s a useful tool for traders looking to visualize trends and automate some aspects of their trading strategy.
All Harmonic Patterns [theEccentricTrader]█ OVERVIEW
This indicator automatically draws and sends alerts for all of the harmonic patterns in my public library as they occur. The patterns included are as follows:
• Bearish 5-0
• Bullish 5-0
• Bearish ABCD
• Bullish ABCD
• Bearish Alternate Bat
• Bullish Alternate Bat
• Bearish Bat
• Bullish Bat
• Bearish Butterfly
• Bullish Butterfly
• Bearish Cassiopeia A
• Bullish Cassiopeia A
• Bearish Cassiopeia B
• Bullish Cassiopeia B
• Bearish Cassiopeia C
• Bullish Cassiopeia C
• Bearish Crab
• Bullish Crab
• Bearish Deep Crab
• Bullish Deep Crab
• Bearish Cypher
• Bullish Cypher
• Bearish Gartley
• Bullish Gartley
• Bearish Shark
• Bullish Shark
• Bearish Three-Drive
• Bullish Three-Drive
█ CONCEPTS
Green and Red Candles
• A green candle is one that closes with a close price equal to or above the price it opened.
• A red candle is one that closes with a close price that is lower than the price it opened.
Swing Highs and Swing Lows
• A swing high is a green candle or series of consecutive green candles followed by a single red candle to complete the swing and form the peak.
• A swing low is a red candle or series of consecutive red candles followed by a single green candle to complete the swing and form the trough.
Peak and Trough Prices
• The peak price of a complete swing high is the high price of either the red candle that completes the swing high or the high price of the preceding green candle, depending on which is higher.
• The trough price of a complete swing low is the low price of either the green candle that completes the swing low or the low price of the preceding red candle, depending on which is lower.
Historic Peaks and Troughs
The current, or most recent, peak and trough occurrences are referred to as occurrence zero. Previous peak and trough occurrences are referred to as historic and ordered numerically from right to left, with the most recent historic peak and trough occurrences being occurrence one.
Upper Trends
• A return line uptrend is formed when the current peak price is higher than the preceding peak price.
• A downtrend is formed when the current peak price is lower than the preceding peak price.
• A double-top is formed when the current peak price is equal to the preceding peak price.
Lower Trends
• An uptrend is formed when the current trough price is higher than the preceding trough price.
• A return line downtrend is formed when the current trough price is lower than the preceding trough price.
• A double-bottom is formed when the current trough price is equal to the preceding trough price.
Range
The range is simply the difference between the current peak and current trough prices, generally expressed in terms of points or pips.
Wave Cycles
A wave cycle is here defined as a complete two-part move between a swing high and a swing low, or a swing low and a swing high. The first swing high or swing low will set the course for the sequence of wave cycles that follow; for example a chart that begins with a swing low will form its first complete wave cycle upon the formation of the first complete swing high and vice versa.
Figure 1.
Retracement and Extension Ratios
Retracement and extension ratios are calculated by dividing the current range by the preceding range and multiplying the answer by 100. Retracement ratios are those that are equal to or below 100% of the preceding range and extension ratios are those that are above 100% of the preceding range.
Fibonacci Retracement and Extension Ratios
The Fibonacci sequence is a series of numbers in which each number is the sum of the two preceding numbers, starting with 0 and 1. For example 0 + 1 = 1, 1 + 1 = 2, 1 + 2 = 3, and so on. Ultimately, we could go on forever but the first few numbers in the sequence are as follows: 0 , 1, 1, 2, 3, 5, 8, 13, 21, 34, 55, 89, 144.
The extension ratios are calculated by dividing each number in the sequence by the number preceding it. For example 0/1 = 0, 1/1 = 1, 2/1 = 2, 3/2 = 1.5, 5/3 = 1.6666..., 8/5 = 1.6, 13/8 = 1.625, 21/13 = 1.6153..., 34/21 = 1.6190..., 55/34 = 1.6176..., 89/55 = 1.6181..., 144/89 = 1.6179..., and so on. The retracement ratios are calculated by inverting this process and dividing each number in the sequence by the number proceeding it. For example 0/1 = 0, 1/1 = 1, 1/2 = 0.5, 2/3 = 0.666..., 3/5 = 0.6, 5/8 = 0.625, 8/13 = 0.6153..., 13/21 = 0.6190..., 21/34 = 0.6176..., 34/55 = 0.6181..., 55/89 = 0.6179..., 89/144 = 0.6180..., and so on.
Fibonacci ranges are typically drawn from left to right, with retracement levels representing ratios inside of the current range and extension levels representing ratios extended outside of the current range. If the current wave cycle ends on a swing low, the Fibonacci range is drawn from peak to trough. If the current wave cycle ends on a swing high the Fibonacci range is drawn from trough to peak.
Measurement Tolerances
Tolerance refers to the allowable variation or deviation from a specific value or dimension. It is the range within which a particular measurement is considered to be acceptable or accurate. I have applied this concept in my pattern detection logic and have set default tolerances where applicable, as perfect patterns are, needless to say, very rare.
Chart Patterns
Generally speaking price charts are nothing more than a series of swing highs and swing lows. When demand outweighs supply over a period of time prices swing higher and when supply outweighs demand over a period of time prices swing lower. These swing highs and swing lows can form patterns that offer insight into the prevailing supply and demand dynamics at play at the relevant moment in time.
‘Let us assume… that you the reader, are not a member of that mysterious inner circle known to the boardrooms as “the insiders”… But it is fairly certain that there are not nearly so many “insiders” as amateur trader supposes and… It is even more certain that insiders can be wrong… Any success they have, however, can be accomplished only by buying and selling… hey can do neither without altering the delicate poise of supply and demand that governs prices. Whatever they do is sooner or later reflected on the charts where you… can detect it. Or detect, at least, the way in which the supply-demand equation is being affected… So, you do not need to be an insider to ride with them frequently… prices move in trends. Some of those trends are straight, some are curved; some are brief and some are long and continued… produced in a series of action and reaction waves of great uniformity. Sooner or later, these trends change direction; they may reverse (as from up to down), or they may be interrupted by some sort of sideways movement and then, after a time, proceed again in their former direction… when a price trend is in the process of reversal… a characteristic area or pattern takes shape on the chart, which becomes recognisable as a reversal formation… Needless to say, the first and most important task of the technical chart analyst is to learn to know the important reversal formations and to judge what they may signify in terms of trading opportunities’ (Edwards & Magee, 1948).
This is as true today as it was when Edwards and Magee were writing in the first half of the last Century, study your patterns and make judgements for yourself about what their implications truly are on the markets and timeframes you are interested in trading.
Over the years, traders have come to discover a multitude of chart and candlestick patterns that are supposed to pertain information on future price movements. However, it is never so clear cut in practice and patterns that where once considered to be reversal patterns are now considered to be continuation patterns and vice versa. Bullish patterns can have bearish implications and bearish patterns can have bullish implications. As such, I would highly encourage you to do your own backtesting.
There is no denying that chart patterns exist, but their implications will vary from market to market and timeframe to timeframe. So it is down to you as an individual to study them and make decisions about how they may be used in a strategic sense.
Harmonic Patterns
The concept of harmonic patterns in trading was first introduced by H.M. Gartley in his book "Profits in the Stock Market", published in 1935. Gartley observed that markets have a tendency to move in repetitive patterns, and he identified several specific patterns that he believed could be used to predict future price movements. The bullish and bearish Gartley patterns are the oldest recognized harmonic patterns in trading and all the other harmonic patterns are modifications of the original Gartley patterns. Gartley patterns are fundamentally composed of 5 points, or 4 waves.
Since then, many other traders and analysts have built upon Gartley's work and developed their own variations of harmonic patterns. One such contributor is Larry Pesavento, who developed his own methods for measuring harmonic patterns using Fibonacci ratios. Pesavento has written several books on the subject of harmonic patterns and Fibonacci ratios in trading. Another notable contributor to harmonic patterns is Scott Carney, who developed his own approach to harmonic trading in the late 1990s and also popularised the use of Fibonacci ratios to measure harmonic patterns. Carney expanded on Gartley's work and also introduced several new harmonic patterns, such as the Shark pattern and the 5-0 pattern.
█ INPUTS
• Change pattern and label colours
• Show or hide patterns individually
• Adjust pattern tolerances
• Set or remove alerts for individual patterns
█ NOTES
You can test the patterns with your own strategies manually by applying the indicator to your chart while in bar replay mode and playing through the history. You could also automate this process with PineScript by using the conditions from my swing and pattern libraries as entry conditions in the strategy tester or your own custom made strategy screener.
█ LIMITATIONS
All green and red candle calculations are based on differences between open and close prices, as such I have made no attempt to account for green candles that gap lower and close below the close price of the preceding candle, or red candles that gap higher and close above the close price of the preceding candle. This may cause some unexpected behaviour on some markets and timeframes. I can only recommend using 24-hour markets, if and where possible, as there are far fewer gaps and, generally, more data to work with.
█ SOURCES
Edwards, R., & Magee, J. (1948) Technical Analysis of Stock Trends (10th edn). Reprint, Boca Raton, Florida: Taylor and Francis Group, CRC Press: 2013.

Bearish Cassiopeia C Harmonic Patterns [theEccentricTrader]█ OVERVIEW
This indicator automatically detects and draws bearish Cassiopeia C harmonic patterns and price projections derived from the ranges that constitute the patterns.
Cassiopeia A, B and C harmonic patterns are patterns that I created/discovered myself. They are all inspired by the Cassiopeia constellation and each one is based on different rotations of the constellation as it moves through the sky. The range ratios are also based on the constellation's right ascension and declination listed on Wikipedia:
Right ascension 22h 57m 04.5897s–03h 41m 14.0997s
Declination 77.6923447°–48.6632690°
en.wikipedia.org
I actually developed this idea quite a while ago now but have not felt audacious enough to introduce a new harmonic pattern, let alone 3 at the same time! But I have since been able to run backtests on tick data going back to 2002 across a variety of market and timeframe combinations and have learned that the Cassiopeia patterns can certainly hold their own against the currently known harmonic patterns.
I would also point out that the Cassiopeia constellation does actually look like a harmonic pattern and the Cassiopeia A star is literally the 'strongest source of radio emission in the sky beyond the solar system', so its arguably more of a real harmonic phenomenon than the current patterns.
www.britannica.com
chandra.si.edu
█ CONCEPTS
Green and Red Candles
• A green candle is one that closes with a close price equal to or above the price it opened.
• A red candle is one that closes with a close price that is lower than the price it opened.
Swing Highs and Swing Lows
• A swing high is a green candle or series of consecutive green candles followed by a single red candle to complete the swing and form the peak.
• A swing low is a red candle or series of consecutive red candles followed by a single green candle to complete the swing and form the trough.
Peak and Trough Prices (Basic)
• The peak price of a complete swing high is the high price of either the red candle that completes the swing high or the high price of the preceding green candle, depending on which is higher.
• The trough price of a complete swing low is the low price of either the green candle that completes the swing low or the low price of the preceding red candle, depending on which is lower.
Historic Peaks and Troughs
The current, or most recent, peak and trough occurrences are referred to as occurrence zero. Previous peak and trough occurrences are referred to as historic and ordered numerically from right to left, with the most recent historic peak and trough occurrences being occurrence one.
Range
The range is simply the difference between the current peak and current trough prices, generally expressed in terms of points or pips.
Upper Trends
• A return line uptrend is formed when the current peak price is higher than the preceding peak price.
• A downtrend is formed when the current peak price is lower than the preceding peak price.
• A double-top is formed when the current peak price is equal to the preceding peak price.
Lower Trends
• An uptrend is formed when the current trough price is higher than the preceding trough price.
• A return line downtrend is formed when the current trough price is lower than the preceding trough price.
• A double-bottom is formed when the current trough price is equal to the preceding trough price.
Muti-Part Upper and Lower Trends
• A multi-part return line uptrend begins with the formation of a new return line uptrend and continues until a new downtrend ends the trend.
• A multi-part downtrend begins with the formation of a new downtrend and continues until a new return line uptrend ends the trend.
• A multi-part uptrend begins with the formation of a new uptrend and continues until a new return line downtrend ends the trend.
• A multi-part return line downtrend begins with the formation of a new return line downtrend and continues until a new uptrend ends the trend.
Double Trends
• A double uptrend is formed when the current trough price is higher than the preceding trough price and the current peak price is higher than the preceding peak price.
• A double downtrend is formed when the current peak price is lower than the preceding peak price and the current trough price is lower than the preceding trough price.
Muti-Part Double Trends
• A multi-part double uptrend begins with the formation of a new uptrend that proceeds a new return line uptrend, and continues until a new downtrend or return line downtrend ends the trend.
• A multi-part double downtrend begins with the formation of a new downtrend that proceeds a new return line downtrend, and continues until a new uptrend or return line uptrend ends the trend.
Wave Cycles
A wave cycle is here defined as a complete two-part move between a swing high and a swing low, or a swing low and a swing high. The first swing high or swing low will set the course for the sequence of wave cycles that follow; for example a chart that begins with a swing low will form its first complete wave cycle upon the formation of the first complete swing high and vice versa.
Figure 1.
Retracement and Extension Ratios
Retracement and extension ratios are calculated by dividing the current range by the preceding range and multiplying the answer by 100. Retracement ratios are those that are equal to or below 100% of the preceding range and extension ratios are those that are above 100% of the preceding range.
Fibonacci Retracement and Extension Ratios
The Fibonacci sequence is a series of numbers in which each number is the sum of the two preceding numbers, starting with 0 and 1. For example 0 + 1 = 1, 1 + 1 = 2, 1 + 2 = 3, and so on. Ultimately, we could go on forever but the first few numbers in the sequence are as follows: 0 , 1, 1, 2, 3, 5, 8, 13, 21, 34, 55, 89, 144.
The extension ratios are calculated by dividing each number in the sequence by the number preceding it. For example 0/1 = 0, 1/1 = 1, 2/1 = 2, 3/2 = 1.5, 5/3 = 1.6666..., 8/5 = 1.6, 13/8 = 1.625, 21/13 = 1.6153..., 34/21 = 1.6190..., 55/34 = 1.6176..., 89/55 = 1.6181..., 144/89 = 1.6179..., and so on. The retracement ratios are calculated by inverting this process and dividing each number in the sequence by the number proceeding it. For example 0/1 = 0, 1/1 = 1, 1/2 = 0.5, 2/3 = 0.666..., 3/5 = 0.6, 5/8 = 0.625, 8/13 = 0.6153..., 13/21 = 0.6190..., 21/34 = 0.6176..., 34/55 = 0.6181..., 55/89 = 0.6179..., 89/144 = 0.6180..., and so on.
1.618 is considered to be the 'golden ratio', found in many natural phenomena such as the growth of seashells and the branching of trees. Some now speculate the universe oscillates at a frequency of 0,618 Hz, which could help to explain such phenomena, but this theory has yet to be proven.
Traders and analysts use Fibonacci retracement and extension indicators, consisting of horizontal lines representing different Fibonacci ratios, for identifying potential levels of support and resistance. Fibonacci ranges are typically drawn from left to right, with retracement levels representing ratios inside of the current range and extension levels representing ratios extended outside of the current range. If the current wave cycle ends on a swing low, the Fibonacci range is drawn from peak to trough. If the current wave cycle ends on a swing high the Fibonacci range is drawn from trough to peak.
Harmonic Patterns
The concept of harmonic patterns in trading was first introduced by H.M. Gartley in his book "Profits in the Stock Market", published in 1935. Gartley observed that markets have a tendency to move in repetitive patterns, and he identified several specific patterns that he believed could be used to predict future price movements.
Since then, many other traders and analysts have built upon Gartley's work and developed their own variations of harmonic patterns. One such contributor is Larry Pesavento, who developed his own methods for measuring harmonic patterns using Fibonacci ratios. Pesavento has written several books on the subject of harmonic patterns and Fibonacci ratios in trading. Another notable contributor to harmonic patterns is Scott Carney, who developed his own approach to harmonic trading in the late 1990s and also popularised the use of Fibonacci ratios to measure harmonic patterns. Carney expanded on Gartley's work and also introduced several new harmonic patterns, such as the Shark pattern and the 5-0 pattern.
The bullish and bearish Gartley patterns are the oldest recognized harmonic patterns in trading and all the other harmonic patterns are ultimately modifications of the original Gartley patterns. Gartley patterns are fundamentally composed of 5 points, or 4 waves.
Bullish and Bearish Cassiopeia C Harmonic Patterns
• Bullish Cassiopeia C patterns are fundamentally composed of three troughs and two peaks. The second peak being higher than the first peak. And the third trough being lower than both the first and second troughs, while the second trough is higher than the first.
• Bearish Cassiopeia C patterns are fundamentally composed of three peaks and two troughs. The second trough being lower than the first trough. And the third peak being higher than both the first and second peaks, while the second peak is lower than the first.
The ratio measurements I use to detect the patterns are as follows:
• Wave 1 of the pattern, generally referred to as XA, has no specific ratio requirements.
• Wave 2 of the pattern, generally referred to as AB, should retrace by at least 11.34%, but no further than 22.31% of the range set by wave 1.
• Wave 3 of the pattern, generally referred to as BC, should extend by at least 225.7%, but no further than 341% of the range set by wave 2.
• Wave 4 of the pattern, generally referred to as CD, should retrace by at least 77.69%, but no further than 88.66% of the range set by wave 3.
Measurement Tolerances
In general, tolerance in measurements refers to the allowable variation or deviation from a specific value or dimension. It is the range within which a particular measurement is considered to be acceptable or accurate. In this script I have applied this concept to the measurement of harmonic pattern ratios to increase to the frequency of pattern occurrences.
For example, the AB measurement of Gartley patterns is generally set at around 61.8%, but with such specificity in the measuring requirements the patterns are very rare. We can increase the frequency of pattern occurrences by setting a tolerance. A tolerance of 10% to both downside and upside, which is the default setting for all tolerances, means we would have a tolerable measurement range between 51.8-71.8%, thus increasing the frequency of occurrence.
█ FEATURES
Inputs
• AB Lower Tolerance
• AB Upper Tolerance
• BC Lower Tolerance
• BC Upper Tolerance
• CD Lower Tolerance
• CD Upper Tolerance
• Pattern Color
• Label Color
• Show Projections
• Extend Current Projection Lines
Alerts
Users can set alerts for when the patterns occur.
█ LIMITATIONS
All green and red candle calculations are based on differences between open and close prices, as such I have made no attempt to account for green candles that gap lower and close below the close price of the preceding candle, or red candles that gap higher and close above the close price of the preceding candle. This may cause some unexpected behaviour on some markets and timeframes. I can only recommend using 24-hour markets, if and where possible, as there are far fewer gaps and, generally, more data to work with.
█ NOTES
I know a few people have been requesting a single indicator that contains all my patterns and I definitely hear you on that one. However, I have been very busy working on other projects while trying to trade and be a human at the same time. For now I am going to maintain my original approach of releasing each pattern individually so as to maintain consistency. But I am now also working on getting my some of my libraries ready for public release and in doing so I will finally be able to fit all patterns into one script. I will also be giving my scripts some TLC by making them cleaner once I have the libraries up and running. Please bear with me in the meantime, this may take a while. Cheers!

Bullish Cassiopeia C Harmonic Patterns [theEccentricTrader]█ OVERVIEW
This indicator automatically detects and draws bullish Cassiopeia C harmonic patterns and price projections derived from the ranges that constitute the patterns.
Cassiopeia A, B and C harmonic patterns are patterns that I created/discovered myself. They are all inspired by the Cassiopeia constellation and each one is based on different rotations of the constellation as it moves through the sky. The range ratios are also based on the constellation's right ascension and declination listed on Wikipedia:
Right ascension 22h 57m 04.5897s–03h 41m 14.0997s
Declination 77.6923447°–48.6632690°
en.wikipedia.org
I actually developed this idea quite a while ago now but have not felt audacious enough to introduce a new harmonic pattern, let alone 3 at the same time! But I have since been able to run backtests on tick data going back to 2002 across a variety of market and timeframe combinations and have learned that the Cassiopeia patterns can certainly hold their own against the currently known harmonic patterns.
I would also point out that the Cassiopeia constellation does actually look like a harmonic pattern and the Cassiopeia A star is literally the 'strongest source of radio emission in the sky beyond the solar system', so its arguably more of a real harmonic phenomenon than the current patterns.
www.britannica.com
chandra.si.edu
█ CONCEPTS
Green and Red Candles
• A green candle is one that closes with a close price equal to or above the price it opened.
• A red candle is one that closes with a close price that is lower than the price it opened.
Swing Highs and Swing Lows
• A swing high is a green candle or series of consecutive green candles followed by a single red candle to complete the swing and form the peak.
• A swing low is a red candle or series of consecutive red candles followed by a single green candle to complete the swing and form the trough.
Peak and Trough Prices (Basic)
• The peak price of a complete swing high is the high price of either the red candle that completes the swing high or the high price of the preceding green candle, depending on which is higher.
• The trough price of a complete swing low is the low price of either the green candle that completes the swing low or the low price of the preceding red candle, depending on which is lower.
Historic Peaks and Troughs
The current, or most recent, peak and trough occurrences are referred to as occurrence zero. Previous peak and trough occurrences are referred to as historic and ordered numerically from right to left, with the most recent historic peak and trough occurrences being occurrence one.
Range
The range is simply the difference between the current peak and current trough prices, generally expressed in terms of points or pips.
Upper Trends
• A return line uptrend is formed when the current peak price is higher than the preceding peak price.
• A downtrend is formed when the current peak price is lower than the preceding peak price.
• A double-top is formed when the current peak price is equal to the preceding peak price.
Lower Trends
• An uptrend is formed when the current trough price is higher than the preceding trough price.
• A return line downtrend is formed when the current trough price is lower than the preceding trough price.
• A double-bottom is formed when the current trough price is equal to the preceding trough price.
Muti-Part Upper and Lower Trends
• A multi-part return line uptrend begins with the formation of a new return line uptrend and continues until a new downtrend ends the trend.
• A multi-part downtrend begins with the formation of a new downtrend and continues until a new return line uptrend ends the trend.
• A multi-part uptrend begins with the formation of a new uptrend and continues until a new return line downtrend ends the trend.
• A multi-part return line downtrend begins with the formation of a new return line downtrend and continues until a new uptrend ends the trend.
Double Trends
• A double uptrend is formed when the current trough price is higher than the preceding trough price and the current peak price is higher than the preceding peak price.
• A double downtrend is formed when the current peak price is lower than the preceding peak price and the current trough price is lower than the preceding trough price.
Muti-Part Double Trends
• A multi-part double uptrend begins with the formation of a new uptrend that proceeds a new return line uptrend, and continues until a new downtrend or return line downtrend ends the trend.
• A multi-part double downtrend begins with the formation of a new downtrend that proceeds a new return line downtrend, and continues until a new uptrend or return line uptrend ends the trend.
Wave Cycles
A wave cycle is here defined as a complete two-part move between a swing high and a swing low, or a swing low and a swing high. The first swing high or swing low will set the course for the sequence of wave cycles that follow; for example a chart that begins with a swing low will form its first complete wave cycle upon the formation of the first complete swing high and vice versa.
Figure 1.
Retracement and Extension Ratios
Retracement and extension ratios are calculated by dividing the current range by the preceding range and multiplying the answer by 100. Retracement ratios are those that are equal to or below 100% of the preceding range and extension ratios are those that are above 100% of the preceding range.
Fibonacci Retracement and Extension Ratios
The Fibonacci sequence is a series of numbers in which each number is the sum of the two preceding numbers, starting with 0 and 1. For example 0 + 1 = 1, 1 + 1 = 2, 1 + 2 = 3, and so on. Ultimately, we could go on forever but the first few numbers in the sequence are as follows: 0 , 1, 1, 2, 3, 5, 8, 13, 21, 34, 55, 89, 144.
The extension ratios are calculated by dividing each number in the sequence by the number preceding it. For example 0/1 = 0, 1/1 = 1, 2/1 = 2, 3/2 = 1.5, 5/3 = 1.6666..., 8/5 = 1.6, 13/8 = 1.625, 21/13 = 1.6153..., 34/21 = 1.6190..., 55/34 = 1.6176..., 89/55 = 1.6181..., 144/89 = 1.6179..., and so on. The retracement ratios are calculated by inverting this process and dividing each number in the sequence by the number proceeding it. For example 0/1 = 0, 1/1 = 1, 1/2 = 0.5, 2/3 = 0.666..., 3/5 = 0.6, 5/8 = 0.625, 8/13 = 0.6153..., 13/21 = 0.6190..., 21/34 = 0.6176..., 34/55 = 0.6181..., 55/89 = 0.6179..., 89/144 = 0.6180..., and so on.
1.618 is considered to be the 'golden ratio', found in many natural phenomena such as the growth of seashells and the branching of trees. Some now speculate the universe oscillates at a frequency of 0,618 Hz, which could help to explain such phenomena, but this theory has yet to be proven.
Traders and analysts use Fibonacci retracement and extension indicators, consisting of horizontal lines representing different Fibonacci ratios, for identifying potential levels of support and resistance. Fibonacci ranges are typically drawn from left to right, with retracement levels representing ratios inside of the current range and extension levels representing ratios extended outside of the current range. If the current wave cycle ends on a swing low, the Fibonacci range is drawn from peak to trough. If the current wave cycle ends on a swing high the Fibonacci range is drawn from trough to peak.
Harmonic Patterns
The concept of harmonic patterns in trading was first introduced by H.M. Gartley in his book "Profits in the Stock Market", published in 1935. Gartley observed that markets have a tendency to move in repetitive patterns, and he identified several specific patterns that he believed could be used to predict future price movements.
Since then, many other traders and analysts have built upon Gartley's work and developed their own variations of harmonic patterns. One such contributor is Larry Pesavento, who developed his own methods for measuring harmonic patterns using Fibonacci ratios. Pesavento has written several books on the subject of harmonic patterns and Fibonacci ratios in trading. Another notable contributor to harmonic patterns is Scott Carney, who developed his own approach to harmonic trading in the late 1990s and also popularised the use of Fibonacci ratios to measure harmonic patterns. Carney expanded on Gartley's work and also introduced several new harmonic patterns, such as the Shark pattern and the 5-0 pattern.
The bullish and bearish Gartley patterns are the oldest recognized harmonic patterns in trading and all the other harmonic patterns are ultimately modifications of the original Gartley patterns. Gartley patterns are fundamentally composed of 5 points, or 4 waves.
Bullish and Bearish Cassiopeia C Harmonic Patterns
• Bullish Cassiopeia C patterns are fundamentally composed of three troughs and two peaks. The second peak being higher than the first peak. And the third trough being lower than both the first and second troughs, while the second trough is higher than the first.
• Bearish Cassiopeia C patterns are fundamentally composed of three peaks and two troughs. The second trough being lower than the first trough. And the third peak being higher than both the first and second peaks, while the second peak is lower than the first.
The ratio measurements I use to detect the patterns are as follows:
• Wave 1 of the pattern, generally referred to as XA, has no specific ratio requirements.
• Wave 2 of the pattern, generally referred to as AB, should retrace by at least 11.34%, but no further than 22.31% of the range set by wave 1.
• Wave 3 of the pattern, generally referred to as BC, should extend by at least 225.7%, but no further than 341% of the range set by wave 2.
• Wave 4 of the pattern, generally referred to as CD, should retrace by at least 77.69%, but no further than 88.66% of the range set by wave 3.
Measurement Tolerances
In general, tolerance in measurements refers to the allowable variation or deviation from a specific value or dimension. It is the range within which a particular measurement is considered to be acceptable or accurate. In this script I have applied this concept to the measurement of harmonic pattern ratios to increase to the frequency of pattern occurrences.
For example, the AB measurement of Gartley patterns is generally set at around 61.8%, but with such specificity in the measuring requirements the patterns are very rare. We can increase the frequency of pattern occurrences by setting a tolerance. A tolerance of 10% to both downside and upside, which is the default setting for all tolerances, means we would have a tolerable measurement range between 51.8-71.8%, thus increasing the frequency of occurrence.
█ FEATURES
Inputs
• AB Lower Tolerance
• AB Upper Tolerance
• BC Lower Tolerance
• BC Upper Tolerance
• CD Lower Tolerance
• CD Upper Tolerance
• Pattern Color
• Label Color
• Show Projections
• Extend Current Projection Lines
Alerts
Users can set alerts for when the patterns occur.
█ LIMITATIONS
All green and red candle calculations are based on differences between open and close prices, as such I have made no attempt to account for green candles that gap lower and close below the close price of the preceding candle, or red candles that gap higher and close above the close price of the preceding candle. This may cause some unexpected behaviour on some markets and timeframes. I can only recommend using 24-hour markets, if and where possible, as there are far fewer gaps and, generally, more data to work with.
█ NOTES
I know a few people have been requesting a single indicator that contains all my patterns and I definitely hear you on that one. However, I have been very busy working on other projects while trying to trade and be a human at the same time. For now I am going to maintain my original approach of releasing each pattern individually so as to maintain consistency. But I am now also working on getting my some of my libraries ready for public release and in doing so I will finally be able to fit all patterns into one script. I will also be giving my scripts some TLC by making them cleaner once I have the libraries up and running. Please bear with me in the meantime, this may take a while. Cheers!

Bearish Cassiopeia B Harmonic Patterns [theEccentricTrader]█ OVERVIEW
This indicator automatically detects and draws bearish Cassiopeia B harmonic patterns and price projections derived from the ranges that constitute the patterns.
Cassiopeia A, B and C harmonic patterns are patterns that I created/discovered myself. They are all inspired by the Cassiopeia constellation and each one is based on different rotations of the constellation as it moves through the sky. The range ratios are also based on the constellation's right ascension and declination listed on Wikipedia:
Right ascension 22h 57m 04.5897s–03h 41m 14.0997s
Declination 77.6923447°–48.6632690°
en.wikipedia.org
I actually developed this idea quite a while ago now but have not felt audacious enough to introduce a new harmonic pattern, let alone 3 at the same time! But I have since been able to run backtests on tick data going back to 2002 across a variety of market and timeframe combinations and have learned that the Cassiopeia patterns can certainly hold their own against the currently known harmonic patterns.
I would also point out that the Cassiopeia constellation does actually look like a harmonic pattern and the Cassiopeia A star is literally the 'strongest source of radio emission in the sky beyond the solar system', so its arguably more of a real harmonic phenomenon than the current patterns.
www.britannica.com
chandra.si.edu
█ CONCEPTS
Green and Red Candles
• A green candle is one that closes with a close price equal to or above the price it opened.
• A red candle is one that closes with a close price that is lower than the price it opened.
Swing Highs and Swing Lows
• A swing high is a green candle or series of consecutive green candles followed by a single red candle to complete the swing and form the peak.
• A swing low is a red candle or series of consecutive red candles followed by a single green candle to complete the swing and form the trough.
Peak and Trough Prices (Basic)
• The peak price of a complete swing high is the high price of either the red candle that completes the swing high or the high price of the preceding green candle, depending on which is higher.
• The trough price of a complete swing low is the low price of either the green candle that completes the swing low or the low price of the preceding red candle, depending on which is lower.
Historic Peaks and Troughs
The current, or most recent, peak and trough occurrences are referred to as occurrence zero. Previous peak and trough occurrences are referred to as historic and ordered numerically from right to left, with the most recent historic peak and trough occurrences being occurrence one.
Range
The range is simply the difference between the current peak and current trough prices, generally expressed in terms of points or pips.
Upper Trends
• A return line uptrend is formed when the current peak price is higher than the preceding peak price.
• A downtrend is formed when the current peak price is lower than the preceding peak price.
• A double-top is formed when the current peak price is equal to the preceding peak price.
Lower Trends
• An uptrend is formed when the current trough price is higher than the preceding trough price.
• A return line downtrend is formed when the current trough price is lower than the preceding trough price.
• A double-bottom is formed when the current trough price is equal to the preceding trough price.
Muti-Part Upper and Lower Trends
• A multi-part return line uptrend begins with the formation of a new return line uptrend and continues until a new downtrend ends the trend.
• A multi-part downtrend begins with the formation of a new downtrend and continues until a new return line uptrend ends the trend.
• A multi-part uptrend begins with the formation of a new uptrend and continues until a new return line downtrend ends the trend.
• A multi-part return line downtrend begins with the formation of a new return line downtrend and continues until a new uptrend ends the trend.
Double Trends
• A double uptrend is formed when the current trough price is higher than the preceding trough price and the current peak price is higher than the preceding peak price.
• A double downtrend is formed when the current peak price is lower than the preceding peak price and the current trough price is lower than the preceding trough price.
Muti-Part Double Trends
• A multi-part double uptrend begins with the formation of a new uptrend that proceeds a new return line uptrend, and continues until a new downtrend or return line downtrend ends the trend.
• A multi-part double downtrend begins with the formation of a new downtrend that proceeds a new return line downtrend, and continues until a new uptrend or return line uptrend ends the trend.
Wave Cycles
A wave cycle is here defined as a complete two-part move between a swing high and a swing low, or a swing low and a swing high. The first swing high or swing low will set the course for the sequence of wave cycles that follow; for example a chart that begins with a swing low will form its first complete wave cycle upon the formation of the first complete swing high and vice versa.
Figure 1.
Retracement and Extension Ratios
Retracement and extension ratios are calculated by dividing the current range by the preceding range and multiplying the answer by 100. Retracement ratios are those that are equal to or below 100% of the preceding range and extension ratios are those that are above 100% of the preceding range.
Fibonacci Retracement and Extension Ratios
The Fibonacci sequence is a series of numbers in which each number is the sum of the two preceding numbers, starting with 0 and 1. For example 0 + 1 = 1, 1 + 1 = 2, 1 + 2 = 3, and so on. Ultimately, we could go on forever but the first few numbers in the sequence are as follows: 0 , 1, 1, 2, 3, 5, 8, 13, 21, 34, 55, 89, 144.
The extension ratios are calculated by dividing each number in the sequence by the number preceding it. For example 0/1 = 0, 1/1 = 1, 2/1 = 2, 3/2 = 1.5, 5/3 = 1.6666..., 8/5 = 1.6, 13/8 = 1.625, 21/13 = 1.6153..., 34/21 = 1.6190..., 55/34 = 1.6176..., 89/55 = 1.6181..., 144/89 = 1.6179..., and so on. The retracement ratios are calculated by inverting this process and dividing each number in the sequence by the number proceeding it. For example 0/1 = 0, 1/1 = 1, 1/2 = 0.5, 2/3 = 0.666..., 3/5 = 0.6, 5/8 = 0.625, 8/13 = 0.6153..., 13/21 = 0.6190..., 21/34 = 0.6176..., 34/55 = 0.6181..., 55/89 = 0.6179..., 89/144 = 0.6180..., and so on.
1.618 is considered to be the 'golden ratio', found in many natural phenomena such as the growth of seashells and the branching of trees. Some now speculate the universe oscillates at a frequency of 0,618 Hz, which could help to explain such phenomena, but this theory has yet to be proven.
Traders and analysts use Fibonacci retracement and extension indicators, consisting of horizontal lines representing different Fibonacci ratios, for identifying potential levels of support and resistance. Fibonacci ranges are typically drawn from left to right, with retracement levels representing ratios inside of the current range and extension levels representing ratios extended outside of the current range. If the current wave cycle ends on a swing low, the Fibonacci range is drawn from peak to trough. If the current wave cycle ends on a swing high the Fibonacci range is drawn from trough to peak.
Harmonic Patterns
The concept of harmonic patterns in trading was first introduced by H.M. Gartley in his book "Profits in the Stock Market", published in 1935. Gartley observed that markets have a tendency to move in repetitive patterns, and he identified several specific patterns that he believed could be used to predict future price movements.
Since then, many other traders and analysts have built upon Gartley's work and developed their own variations of harmonic patterns. One such contributor is Larry Pesavento, who developed his own methods for measuring harmonic patterns using Fibonacci ratios. Pesavento has written several books on the subject of harmonic patterns and Fibonacci ratios in trading. Another notable contributor to harmonic patterns is Scott Carney, who developed his own approach to harmonic trading in the late 1990s and also popularised the use of Fibonacci ratios to measure harmonic patterns. Carney expanded on Gartley's work and also introduced several new harmonic patterns, such as the Shark pattern and the 5-0 pattern.
The bullish and bearish Gartley patterns are the oldest recognized harmonic patterns in trading and all the other harmonic patterns are ultimately modifications of the original Gartley patterns. Gartley patterns are fundamentally composed of 5 points, or 4 waves.
Bullish and Bearish Cassiopeia B Harmonic Patterns
• Bullish Cassiopeia B patterns are fundamentally composed of three troughs and two peaks. The second peak being lower than the first peak. And the third trough being lower than both the first and second troughs, while the second trough is also lower than the first.
• Bearish Cassiopeia B patterns are fundamentally composed of three peaks and two troughs. The second trough being higher than the first trough. And the third peak being higher than both the first and second peaks, while the second peak is also higher than the first.
The ratio measurements I use to detect the patterns are as follows:
• Wave 1 of the pattern, generally referred to as XA, has no specific ratio requirements.
• Wave 2 of the pattern, generally referred to as AB, should retrace by at least 11.34%, but no further than 22.31% of the range set by wave 1.
• Wave 3 of the pattern, generally referred to as BC, should extend by at least 225.7%, but no further than 341% of the range set by wave 2.
• Wave 4 of the pattern, generally referred to as CD, should retrace by at least 77.69%, but no further than 88.66% of the range set by wave 3.
Measurement Tolerances
In general, tolerance in measurements refers to the allowable variation or deviation from a specific value or dimension. It is the range within which a particular measurement is considered to be acceptable or accurate. In this script I have applied this concept to the measurement of harmonic pattern ratios to increase to the frequency of pattern occurrences.
For example, the AB measurement of Gartley patterns is generally set at around 61.8%, but with such specificity in the measuring requirements the patterns are very rare. We can increase the frequency of pattern occurrences by setting a tolerance. A tolerance of 10% to both downside and upside, which is the default setting for all tolerances, means we would have a tolerable measurement range between 51.8-71.8%, thus increasing the frequency of occurrence.
█ FEATURES
Inputs
• AB Lower Tolerance
• AB Upper Tolerance
• BC Lower Tolerance
• BC Upper Tolerance
• CD Lower Tolerance
• CD Upper Tolerance
• Pattern Color
• Label Color
• Show Projections
• Extend Current Projection Lines
Alerts
Users can set alerts for when the patterns occur.
█ LIMITATIONS
All green and red candle calculations are based on differences between open and close prices, as such I have made no attempt to account for green candles that gap lower and close below the close price of the preceding candle, or red candles that gap higher and close above the close price of the preceding candle. This may cause some unexpected behaviour on some markets and timeframes. I can only recommend using 24-hour markets, if and where possible, as there are far fewer gaps and, generally, more data to work with.
█ NOTES
I know a few people have been requesting a single indicator that contains all my patterns and I definitely hear you on that one. However, I have been very busy working on other projects while trying to trade and be a human at the same time. For now I am going to maintain my original approach of releasing each pattern individually so as to maintain consistency. But I am now also working on getting my some of my libraries ready for public release and in doing so I will finally be able to fit all patterns into one script. I will also be giving my scripts some TLC by making them cleaner once I have the libraries up and running. Please bear with me in the meantime, this may take a while. Cheers!
