ATR Spike KienthogoATR Spike Kienthogo
This indicator, titled "ATR Spike Kienthogo", is designed to visualize volatility spikes in the market by comparing the current Average True Range (ATR) against a dynamic threshold. The threshold is calculated as an EMA-smoothed ATR multiplied by a user-defined factor. When the current ATR exceeds this threshold, the indicator highlights it as a spike event, further classified by price direction (up or down).
The script features:
Configurable ATR smoothing methods: RMA, SMA, EMA, WMA.
Customizable spike detection threshold via spike_multiple.
Conditional color plotting of ATR:
Spike + Price Up → Green
Spike + Price Down → Red
Non-spike → User-defined neutral color, adaptive to candle direction (greenish for bullish candles, reddish for bearish candles).
This script is especially useful for:
Detecting volatility expansions.
Enhancing entry/exit timing during strong directional moves.
Confirming breakout strength or trap signals in low-volatility regimes.
The logic maintains clean separation between spike vs. non-spike conditions and offers full control over color coding for better visual integration in multi-indicator environments.
Cerca negli script per "ATR"

ATR, ADX, RSI TableATR, ADX & RSI Dashboard (Color-Coded)
Overview
This indicator provides a clean, all-in-one dashboard that displays the current values for three of the most popular technical indicators: Average True Range (ATR), Average Directional Index (ADX), and Relative Strength Index (RSI).
To make analysis faster and more intuitive, the values in the table are dynamically color-coded based on key thresholds. This allows you to get an immediate visual summary of market volatility, trend strength, and momentum without cluttering your main chart area.
Features
The indicator displays a simple table in the bottom-right corner of your chart with the following color logic:
ATR (Volatility): Measures the average volatility of an asset.
Green: Low Volatility (ATR is less than 3% of the current price).
Orange: Moderate Volatility (ATR is between 3% and 5%).
Red: High Volatility (ATR is greater than 5%).
ADX (Trend Strength): Measures the strength of the underlying trend, regardless of its direction.
Red: Weak or Non-Trending Market (ADX is below 20).
Orange: Developing or Neutral Trend (ADX is between 20 and 25).
Green: Strong Trend (ADX is above 25).
RSI (Momentum): Measures the speed and change of price movements to identify overbought or oversold conditions.
Green: Potentially Oversold (RSI is below 40).
Orange: Neutral/Normal Conditions (RSI is between 40 and 70).
Red: Potentially Overbought (RSI is above 70).
How to Use
This tool is perfect for traders who want a quick, at-a-glance understanding of the current market state. Instead of analyzing three separate indicators, you can use this dashboard to:
Quickly confirm if a strong trend is present before entering a trade.
Assess volatility to adjust your stop-loss and take-profit levels.
Instantly spot potential overbought or oversold conditions.
Customization
All input lengths for the ATR, ADX, and RSI are fully customizable in the indicator's settings menu, allowing you to tailor the calculations to your specific trading style and timeframe.

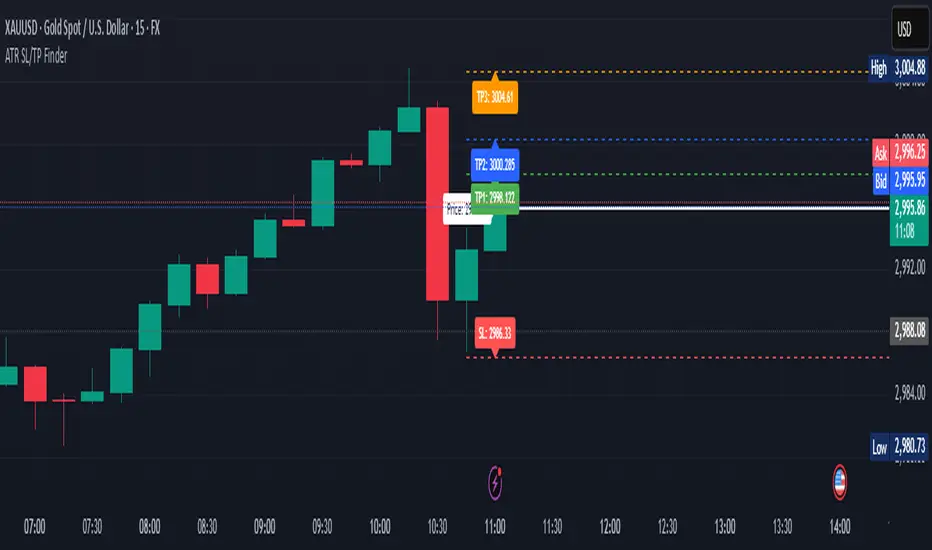
ATR Stop Loss & 3 TP FinderATR Stop Loss & 3 TP Finder - By SeehraSingh
This indicator is designed to help traders automate Stop Loss (SL) and Take Profit (TP) placement based on the Average True Range (ATR). It dynamically calculates:
Stop Loss (SL): Set based on a user-defined ATR multiplier.
Three Take Profit (TP) levels: Configurable ATR multipliers for TP1, TP2, and TP3.
Customizable Price Sources: Allows traders to choose different price sources (Open, High, Low, Close, HL2, HLC3, OHLC4, HLCC4) for both SL and TP calculations.
Visual Representation: Plots dashed lines for Entry, SL, TP1, TP2, and TP3.
Table Display: Provides an easy-to-read table at the bottom showing SL, TP1, TP2, and TP3 values.
How It Works:
Select ATR length and smoothing type (RMA, SMA, EMA, WMA).
Set ATR multipliers for SL and TP levels.
Choose the price source for SL and TP calculations.
The indicator automatically plots entry, SL, and three TP levels on the chart.
Ideal For:
Traders who use ATR-based dynamic Stop Loss and Take Profit strategies.
Those who want to avoid fixed SL/TP placements and prefer volatility-based risk management.
Scalpers, Swing Traders, and Position Traders looking for automated SL/TP visualization.
Disclaimer
⚠️ Trading involves risk. This indicator is for educational purposes only and should not be considered financial advice. Always conduct your own analysis before entering any trade. The author is not responsible for any financial losses incurred while using this tool. Past performance does not guarantee future results.
Daily True Range (DTR) vs Average True Range (ATR)Overview
The "DTR vs ATR with Color-Coded Percentage" indicator is a powerful volatility analysis tool designed for traders who want to understand daily price movements in the context of historical volatility. It calculates the Daily True Range (DTR)—the raw measure of a single day’s volatility—and compares it to the Average True Range (ATR), which smooths volatility over a user-defined period (default 14 days). The indicator presents this data in an intuitive table, featuring a color-coded percentage that visually represents how the current day’s move (DTR) stacks up against the average volatility (ATR). This helps traders quickly assess whether the current day’s price action is unusually volatile, average, or subdued relative to recent history.
Purpose
Volatility Comparison: Visualize how the current day’s price range (DTR) relates to the average range (ATR) over a specified period.
Decision Support: Identify days with exceptional movement (e.g., breakouts or reversals) versus normal or quiet days, aiding in trade entry/exit decisions.
Risk Management: Gauge daily volatility to adjust position sizing or stop-loss levels based on whether the market is exceeding or falling short of typical movement.
Features
Daily True Range (DTR) Calculation:
Computes the True Range for the current day as the greatest of:
Current day’s High - Low
High - Previous Close
Low - Previous Close
Aggregates data on any timeframe to ensure accurate daily values.
Average True Range (ATR):
Calculates the smoothed average of DTR over a customizable period (default 14 days) using Wilder’s smoothing method.
Updates in real-time as the day progresses.
Timeframe Flexibility: Works on any chart timeframe (e.g., 1-minute, 1-hour) while always calculating DTR and ATR based on daily data.
Color-Coded Display in either compact or table mode
The percentage value is color-coded in the table based on configurable thresholds:
Safe (default 75): Normal range, within typical volatility
Warning: (default 75-125): Above-average volatility.
Danger (default 125): Exceptionally high volatility

Double Supertrend Entry with ADX Filter and ATR Exits/EntriesThe Double Supertrend Entry with ADX Filter and ATR Exits/Entries indicator is a custom trading strategy designed to help traders identify potential buy and sell signals in trending markets. This indicator combines the strengths of multiple technical analysis tools, enhancing the effectiveness of the overall strategy.
Key features:
Two Supertrend Indicators - The indicator includes two Supertrend indicators with customizable parameters. These trend-following indicators calculate upper and lower trendlines based on the ATR and price. Buy signals are generated when the price crosses above both trendlines, and sell signals are generated when the price crosses below both trendlines.
ADX Filter - The Average Directional Index (ADX) is used to filter out weak trends and only generate buy/sell signals when the market exhibits a strong trend. The ADX measures the strength of the trend, and a customizable threshold level ensures that trades are only entered during strong trends.
ATR-based Exits and Entries - The indicator uses the Average True Range (ATR) to set profit target and stop-loss levels. ATR is a measure of market volatility, and these levels help traders determine when to exit a trade to secure profit or minimize loss.
Performance Statistics Table - A table is displayed on the chart, recording and showing the total number of winning trades, losing trades, percentage of profitable trades, average profit, and average loss. This information helps traders evaluate the performance of the strategy over time.
The Double Supertrend Entry with ADX Filter and ATR Exits/Entries indicator is a powerful trend-following strategy that can assist traders in making more informed decisions in the financial markets. By combining multiple technical analysis tools and providing performance statistics, this indicator helps traders improve their trading strategy and evaluate its success.

Correlated ATR MA | AdulariHow do I use it?
Never use this indicator as standalone trading signal, it should be used as confluence.
When the price is above the moving average this shows the bullish trend is strong.
When the price is below the moving average this shows the bearish trend is strong.
When the moving average is purple, the trend is bullish, when it is gray, the trend is bearish.
Features:
Purple line for bullish trend and gray line for bearish trend.
Custom formula combining an ATR and Hull MA to clearly indicate trend strength and direction.
Unique approach to moving averages by taking the average of 3 types of MA's combined with custom ATR's.
How does it work?
1 — ATR value is calculated, then the correlation between the source and ATR is calculated.
2 — Signal value is calculated from the difference between the previous source and ATR values.
3 — Final value is being calculated using the following formula:
cor * target + (1 - cor) * nz(atr , target)
4 — Moving average is calculated by getting the average of 3 values: a normal HMA, HMA plus final value, and HMA minus final value.

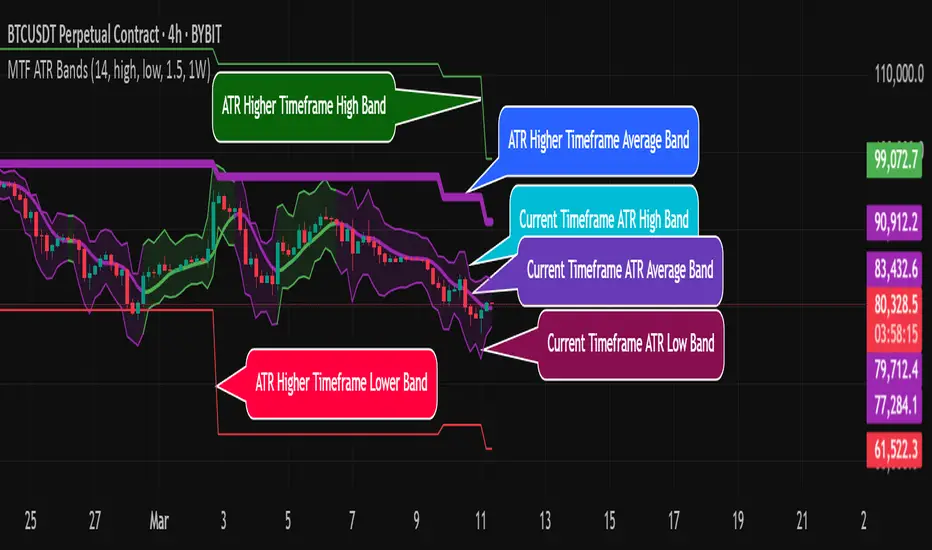
MTF ATR BandsA simple but effective MTF ATR bands indicator.
The script calculate and display ATR bands low and high of the current timeframe using high, low inputs and an RMA moving average, adding to it ATR of the period multiplied with the user multiplier, default is set to 1.5.
Than is calculated a smoothed average of the range and the color of it based on its slope, same color is used to fill the atr bands.
Than the higher timeframe bands are calculated and displayed on the chart.
How can be used ?
The higher timeframe average and bands can give you long term direction of the trend and the current timeframes moving average and filling short term trend, for example using the 15 min chart with a 4h HTF bands, or an 1h with a daily, or a daily with an weekly or weekly with bi-monthly atr bands.
Also can be used as a stop loss indicator.
Hope you will like it, any question send me a PM.
Volatility ATR Support and Resistance Bands [Quantigenics]Volatility ATR Support and Resistance Bands
The “Volatility ATR Support and Resistance Bands” is a trend visualization tool that uses Average True Range (ATR) to create a dynamic channel around price action, adapting to changes in volatility and offering clear trend indicators. The band direction can indicate trend and the lines can indicate support and resistance levels.
The script works by calculating a series of moving averages from the highest and lowest prices, then applies an ATR-based multiplier to generate a set of bands. These bands expand and contract with the market’s volatility, providing a visual guide to the strength and potential direction of price movements.
How to Trade with Volatility ATR Band:
Identify Trend Direction: When the bands slope upwards, the market is trending upwards, which may be a good opportunity to consider a long position. When the bands slope downward, the market is trending downwards, which could be a sign to sell or short.
Volatility Awareness: The wider the bands, the higher the market volatility. Narrow bands suggest a quieter market, which might indicate consolidation or a potential breakout/breakdown.
Confirm Entries and Exits: Use the bands as dynamic support and resistance; entering trades as the price bounces off the bands and considering exits as it reaches the opposite side or breaches the bands.
Hope you enjoy this script!
Happy trading!

The Flash-Strategy (Momentum-RSI, EMA-crossover, ATR)The Flash-Strategy (Momentum-RSI, EMA-crossover, ATR)
Are you tired of manually analyzing charts and trying to find profitable trading opportunities? Look no further! Our algorithmic trading strategy, "Flash," is here to simplify your trading process and maximize your profits.
Flash is an advanced trading algorithm that combines three powerful indicators to generate highly selective and accurate trading signals. The Momentum-RSI, Super-Trend Analysis and EMA-Strategy indicators are used to identify the strength and direction of the underlying trend.
The Momentum-RSI signals the strength of the trend and only generates trading signals in confirmed upward or downward trends. The Super-Trend Analysis confirms the trend direction and generates signals when the price breaks through the super-trend line. The EMA-Strategy is used as a qualifier for the generation of trading signals, where buy signals are generated when the EMA crosses relevant trend lines.
Flash is highly selective, as it only generates trading signals when all three indicators align. This ensures that only the highest probability trades are taken, resulting in maximum profits.
Our trading strategy also comes with two profit management options. Option 1 uses the so-called supertrend-indicator which uses the dynamic ATR as a key input, while option 2 applies pre-defined, fixed SL and TP levels.
The settings for each indicator can be customized, allowing you to adjust the length, limit value, factor, and source value to suit your preferences. You can also set the time period in which you want to run the backtest and how many dollar trades you want to open in each position for fully automated trading.
Choose your preferred trade direction and stop-loss/take-profit settings, and let Flash do the rest. Say goodbye to manual chart analysis and hello to consistent profits with Flash. Try it now!
General Comments
This Flash Strategy has been developed in cooperation between Baby_whale_to_moon and JS-TechTrading. Cudos to Baby_whale_to_moon for doing a great job in transforming sophisticated trading ideas into pine scripts.
Detailed Description
The “Flash” script considers the following indicators for the generation of trading signals:
1. Momentum-RSI
2. ‘Super-Trend’-Analysis
3. EMA-Strategy
1. Momentum-RSI
• This indicator signals the strength of the underlying upward- or downward-trend.
• The signal range of this indicator is from 0 to 100. Values > 60 indicate a confirmed upward- or downward-trend.
• The strategy will only generate trading signals in case the stock (or any other financial security) is in a confirmed upward- (long entry signals) or downward-trend (short entry signals).
• This indicator provides information with regards to the strength of the underlying trend and it does not give any insight with regard to the direction of the trend. Therefore, this strategy also considers other indicators which provide technical confirmation with regards to the direction of the underlying trend.
Graph 1 shows this concept:
• The Momentum-RSI indicator gives lower readings during consolidation phases and no trading signals are generated during these periods.
Example (graph 2):
2. Super-Trend Analysis
• The red line in the graph below represents the so-called super-trend-line. Trading signals are only generated in case the price action breaks through this super-trend-line indicating a new confirmed upward-trend (or downward-trend, respectively).
• If that happens, the super trend-line changes its color from red to green, giving confirmation that the trend changed from bearish to bullish and long-entries can be considered.
• The vice-versa approach can be considered for short entries.
Graph 3 explains this concept:
3. Exponential Moving Average / EMA-Strategy
The functionality of this EMA-element of the strategy has been programmed as follows:
• The exponential moving average and two other trend lines are being used as qualifiers for the generation of trading-signals.
• Buy-signals for long-entries are only considered in case the EMA (yellow line in the graph below) crosses the red line.
• Sell-signals for short-entries are only considered in case the EMA (yellow line in the graph below) crosses the green line.
An example is shown in graph 4 below:
We use this indicator to determine the new trend direction that may occur by using the data of the price's past movement.
4. Bringing it all together
This section describes in detail, how this strategy combines the Momentum-RSI, the super-trend analysis and the EMA-strategy.
The strategy only generates trading-signals in case all of the following conditions and qualifiers are being met:
1. Momentum-RSI is higher than the set value of this strategy. The standard and recommended value is 60 (graph 5):
2. The super-trend analysis needs to indicate a confirmed upward-trend (for long-entry signals) or a confirmed downward-trend (for short-entry signals), respectively.
3. The EMA-strategy needs to indicate that the stock or financial security is in a confirmed upward-trend (long-entries) or downward-trend (short-entries), respectively.
The strategy will only generate trading signals if all three qualifiers are being met. This makes this strategy highly selective and is the key secret for its success.
Example for Long-Entry (graph 6):
When these conditions are met, our Long position is opened.
Example for Short-Entry (graph 7):
Trade Management Options (graph 8)
Option 1
In this dynamic version, the so-called supertrend-indicator is being used for the trade exit management. This supertrend-indicator is a sophisticated and optimized methodology which uses the dynamic ATR as one of its key input parameters.
The following settings of the supertrend-indicator can be changed and optimized (graph 9):
The dynamic SL/TP-lines of the supertrend-indicator are shown in the charts. The ATR-length and the supertrend-factor result in a multiplier value which can be used to fine-tune and optimize this strategy based on the financial security, timeframe and overall market environment.
Option 2 (graph 10):
Option 2 applies pre-defined, fixed SL and TP levels which will appear as straight horizontal lines in the chart.
Settings options (graph 11):
The following settings can be changed for the three elements of this strategy:
1. (Length Mom-Rsi): Length of our Mom-RSI indicator.
2. Mom-RSI Limit Val: the higher this number, the more momentum of the underlying trend is required before the strategy will start creating trading signals.
3. The length and factor values of the super trend indicator can be adjusted:ATR Length SuperTrend and Factor Super Trend
4. You can set the source value used by the ema trend indicator to determine the ema line: Source Ema Ind
5. You can set the EMA length and the percentage value to follow the price: Length Ema Ind and Percent Ema Ind
6. The backtesting period can be adjusted: Start and End time of BackTest
7. Dollar cost per position: this is relevant for 100% fully automated trading.
8. Trade direction can be adjusted: LONG, SHORT or BOTH
9. As we explained above, we can determine our stop-loss and take-profit levels dynamically or statically. (Version 1 or Version 2 )
Display options on the charts graph 12):
1. Show horizontal lines for the Stop-Loss and Take-profit levels on the charts.
2. Display relevant Trend Lines, including color setting options for the supertrend functionality. In the example below, green lines indicate a confirmed uptrend, red lines indicate a confirmed downtrend.
Other comments
• This indicator has been optimized to be applied for 1 hour-charts. However, the underlying principles of this strategy are supply and demand in the financial markets and the strategy can be applied to all timeframes. Daytraders can use the 1min- or 5min charts, swing-traders can use the daily charts.
• This strategy has been designed to identify the most promising, highest probability entries and trades for each stock or other financial security.
• The combination of the qualifiers results in a highly selective strategy which only considers the most promising swing-trading entries. As a result, you will normally only find a low number of trades for each stock or other financial security per year in case you apply this strategy for the daily charts. Shorter timeframes will result in a higher number of trades / year.
• Consequently, traders need to apply this strategy for a full watchlist rather than just one financial security.

Ladder ATRThis indicator shows the upwards (green) and downward (red) volatility of the market. It is a moving average of the true range values like the ATR indicator does but with a twist! For the upwards volatility, only the green candles are taken into account, and for the downwards only the red candles are.
To the best of my knowledge, this technique had been introduced by HeWhoMustNotBeNamed in his "Supertrend - Ladder ATR" publication where the different types of volatility helped to improve the "trend reversal" conditions compared to the "Supertrend" indicator.
However, the actual "Ladder ATR" values were hard to see. This indicator shows the actual upward and downward volatility making it easy to reason about long and short price moves and potential biases in each direction.
In layman's terms this indicator "Ladder ATR" is to the "Supertrend - Ladder ATR" what the "Average True Range" indicator is to the "Supertrend" indicator.

[-_-] Volatility Calibrated ATRDescription:
An indicator based on ATR adjusted for volatility of the market. It uses Heikin Ashi data to find short and long opportunities and displays a dynamic stop loss level. Additionally, it has alerts for when the trend changes (which is an entry signal).
How it works:
It works by dynamically calculating the Period for ATR which depends on current volatility level that is calculated by a function that uses Standard Deviation of price. ATR is then smoothed by Weighted Moving Average and multiplied by ATR Factor, resulting in a plot that changes its colour to red when we're in a downtrend and green when in an uptrend. This plot should be used as a dynamic Stop Loss level. Trend change is determined by price crossing the dynamic Stop Loss level. The squared red and green labels appear when the trend changes, and should be used as Entry signals.
Parameters:
- Source -> data used for calculations
- ATR Factor -> higher values produce less noise and longer trends, lower values give more signals

Didi ATR HybridThis is a hybrid indicator that combines the Didi Index with the Average True Range.
It acts as both an ATR and a Confirmation indicator, based on the No-Nonsense Forex (NNFX) trade rules.
The Didi Index takes three moving averages to build a fast line (MA1 and MA2) and a slow line (MA2 and MA3). You can use it several different ways (2 lines cross, zero-cross); in this setup, we only use the slow line with the zero-cross to produce a signal (source code is set up to take advantage of the fast line - you just need to plot it yourself).
ATR is a measure of candle volatility.
The plotted value is equal to the ATR, which then gets colored based on:
Black : Didi Index is below 0 - do not enter trade
Red : Didi Index is above 1, but the previous candle closed >1x ATR - do not enter trade (too volatile)
Green : Didi Index is above 1, and the previous candle closed <1x ATR - a possible trend is confirmed and you may enter the trade (use other indicators too)
The provided chart does not look exciting - as with NNFX, I am posting it with the OANDA:EURUSD , which is one of the harder FX pairs to trade.

Multiple MAs + No Trend Zone + ATR WidgetThis is my first Pine Script attempt. Nothing special, just an "all in one" for the most common things I use, and what I have found to be the most common in a lot of strategies.
Great for free and limited accounts as it combines 7 total indicators into one.
-- First 5 indicators are Independant Moving Averages:
-Each one can be set for length, as well as source and type (SMA, EMA, SMMA, WMA, VWMA) individually
-- Second type (6th) of indicator is one I find extremly useful for staying OUT of consolidation trading. It's called a "No Trend Zone" indicator I swipped from the Hoffman Startegy. Basically, its set for a small deviation (0.5) of a 35 EMA, which creates a "Band" around the 35 line. When you have this "Band" flat or with no discernable incline/decline, with price action OR some or multiple moving averages inside this banded zone, it typically indicates a zone of consolidation. This will help you identify when you may be in one of those zones, that way you don't get trapped "waiting for paint to dry" before the market starts to move again with your position, and keep you from entering should you be considering the market at that time.
The last indicator is my favorite, and one I will refine a little deeper soon.
-- The ATR widget finishes us out. This widget can be customized for colors, turned on or off, and automatically rounds the ATR (ATR period based on the chart timeframe) to a nice readable number for what you're trading. It has settings to show or not, the length, what rounding style to use (forex pip 0.0001, forex/stock/etf/indicies 0.01) where to show it on the pane, a Multiplier Factor (for stop loss calculations automatically) and the colors.
***NOTE ABOUT ATR WIDGET:
I am primarily a forex trader, so the defaults are for Forex 0.0001. If you see some odd numbers (like 55798 on a current chart), check the inputs tab on the settings, and change the "ATR Style" from "Forex 0.0001" to "Forex/Stock/ETF/Indicies 0.01", and you should arrive with the correct number.

[BA] ATR Stop LineThis indicator helps you to set your stoploss levels by using ATR. Traders often use atr values in order to calculate their stoploss levels.
This indicator does the calculation for you and draw two tiny lines without messing up the chart so that you can easily see your stoploss levels and get an idea about the volatility and risk amount as well.
One line is below the last candle as a long trade stop loss level and the other one is above the last candle as a short trade stop loss level.
Calculation is simple:
For short trades, 2 times ATR added to last price;
For long trades, 2 times ATR subtracted from last price.
You can change ATR length, ATR multiplier and the line length.
Good luck.

quantized pin bar indicator with ATRAbstract
This script computes the strength of pin bars.
This script uses the corrent and the previous two bars to compute the strength of pin bars.
The strength of pin bars can be also comared with average true range, so we can evaluate those pin bars are strong or weak.
Introduction
Pin bar is a popular price action trading strategy.
It is based on quick price rejection.
Most of existing pin bar scripts only determine if a bar is a pin bar or not.
However, evaluating the strength of pin bars is important.
If price rejection is too weak, it is difficult to trigger trend reversal.
If a pin bar is too strong, we may enter the trade too late and cannot have good profit.
In this script, it provides a method to compute to strength of pin bars.
After the strength of pin bars are quantized, they can compare with average true range, price range and trend strength, which can help us to determine where are worthy for us to open trades.
Computation
Bullish hammer : current low is lower than ( previous high or current open ) and current close.
Bearish gravestone : current high is higher than ( previous low or current open ) and current close.
Bullish engulfing and harami : ( current low or previous low ) is lower than ( previous 2nd high or previous open ) and current close.
Bearish engulfing and harami : ( current high or previous high ) is higher than ( previous 2nd low or previous open ) and current close.
Parameters
Smoothing : the type of computing average.
Length of ATR : determines the number of true ranges for computing average true range.
ATR multiplier line : the threshould that a pin bar is strong enough. For example, if this value is 0.5, it means a pin bar with 0.5*atr or more is considered a strong pin bar.
one direction pinbar : set to 1 if you want the strength of bullish pin bars and bearish pin bars are cancelled. Set to 0 if you want to keep both strength of bullish pin bars and bearish pin bars; in this case, you may need to change the plot style to make both strength visible.
Trading Suggestions
Evaluate the strength of trend against pin bars. After all, a single reverse pin bar may be too weak to reverse the trend.
Timeframe : if atr is higher than 4*spread, the timeframe is high enough. However, if strong pin bars appear too frequent or price range is too small, going to higher fimeframe may be more safe.
Entry and exit : according to personal flavors.
Conclusion
The strength of pin bars can be quantized.
With this indicator, we can find more potential pin bars which human eyes and binary pattern detectors were leaked.
In my opinion, 0.5*atr is the most suitable streng of a pin bar for my trade entry but I still need to consider the direction of the trend.
You are welcome to share your settings and related trading strategy.
References
Most of related knowledge can be searched from the internet.
I cannot say the exact references because they may violate the rules of Tradingview.

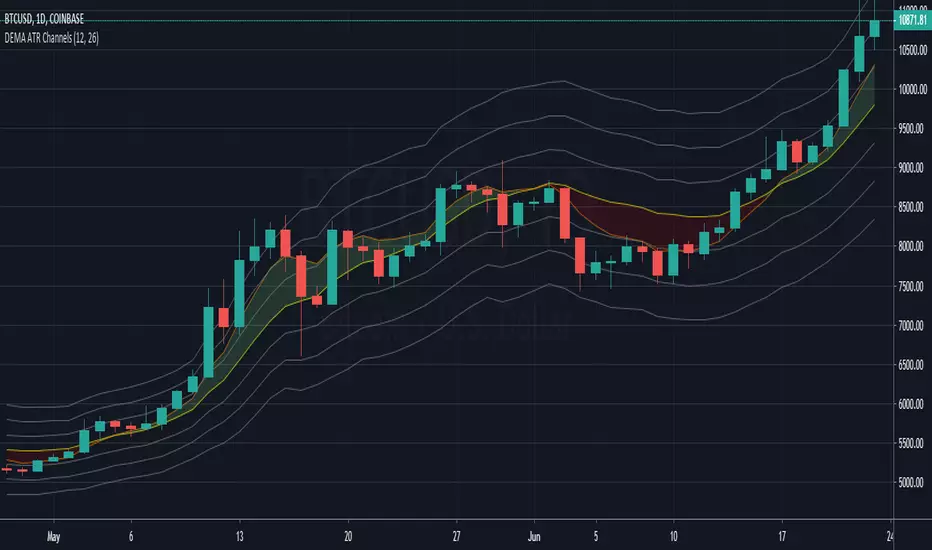
DEMA ATR Channels - New IndicatorA Double Exponential Moving Average (DEMA) with three sets of channel lines each one Average True Range (ATR) apart, above and below the DEMA.
Similar to my "ATR Channels" indicator, but using a DEMA instead of an EMA for the base. In addition, this indicator also plots a fast DEMA as well as a fill between the two. Fully customizable, you can toggle both DEMAs, the fill, and each set of ATR Channels.
ATR channel idea from Kerry Lovvorn as mentioned in Elder's "New Trading for a Living", page 93: "Kerry Lovvorn likes to plot 3 sets of lines around a moving average: at one, two, and three ATRs above and below an EMA . These can be used for setting up entry points and stops, as well as profit targets."
CM ATR PercentileRankCM ATR PercentileRank - Great For Showing Market Bottoms.
When Increased Volatility to the Downside Reaches Extreme Levels it’s Usually a Sign of a Market Bottom.
This Indicator Takes the ATR and uses a different LookBack Period to calculate the Percentile Rank of ATR Which is a Great Way To Calculate Volatility
Be Careful Of Using w/ Market Tops. Not As Reliable.
***Ability to Control ATR Period and set PercentileRank to Different Lookback Period
***Ability to Plot Histogram Just Showing Percentiles or Histogram Based on Up/Down Close
Fuchsia Lines = Greater Than 90th Percentile of Volatility based on ATR and LookBack Period.
Red Lines = Warning — 80-90th Percentile
Orange Lines = 70-80th Percentile
Other Useful Indicators
Williams Vix Fix
CM_RSI EMA Is a Great Filter for Williams Vix Fix

ATR: Body % + Ranges and AnomaliesATR: Body % + Ranges and Anomalies
This indicator provides a dual analysis of price bars to help you better understand market dynamics and volatility. It combines two powerful concepts into one tool: a candle body percentage and a range analysis with an anomaly-excluding average.
Key Features:
1. Candle Body Percentage
This feature plots the size of the candle's body as a percentage of its total high-low range.
A high percentage (e.g., above the 50% gray line) indicates strong, directional movement. The more solid the body is relative to its wicks, the more conviction is behind that move.
The 100% red line marks "Marubozu" candles—bars with no wicks, showing absolute control by buyers or sellers.
2. Range Analysis with Anomalies
This is a unique part of the indicator that helps you identify and understand normal vs. abnormal volatility.
Custom SMA: It calculates an average range of the last N bars, but it smartly excludes "anomalous" bars (spikes or unusually small ranges) from the calculation. This gives you a more reliable baseline for normal volatility.
Anomaly Detection: Bars are colored differently based on their range:
Blue: Small anomalies (range less than 0.5 * ATR). These often occur during periods of low liquidity or indecision.
Red: Large anomalies (range greater than 1.8 * ATR). These can signal a sudden burst of volatility, breakout events, or capitulation.
ATR Range % Label: The label on the chart shows the current bar's range as a percentage of the custom SMA. This tells you how much larger or smaller the current bar's range is compared to a clean average.
How to Use:
Spotting Trends: Use the Body % to confirm the strength of a trend. A series of bars with high body percentages can indicate a strong, healthy trend.
Identifying Volatility: Use the Range Analysis to find areas of interest. A large red anomaly bar could signal a significant event, while a series of blue anomalies might suggest the market is in a tight consolidation before a breakout.
Contextual Analysis: The combination of these tools can provide powerful context. For example, a bar with a high Body % and a red anomaly color suggests a strong, volatile move that could be a turning point or the start of a major trend.
Experiment with the input settings to fine-tune the ATR and SMA periods for different timeframes and assets.

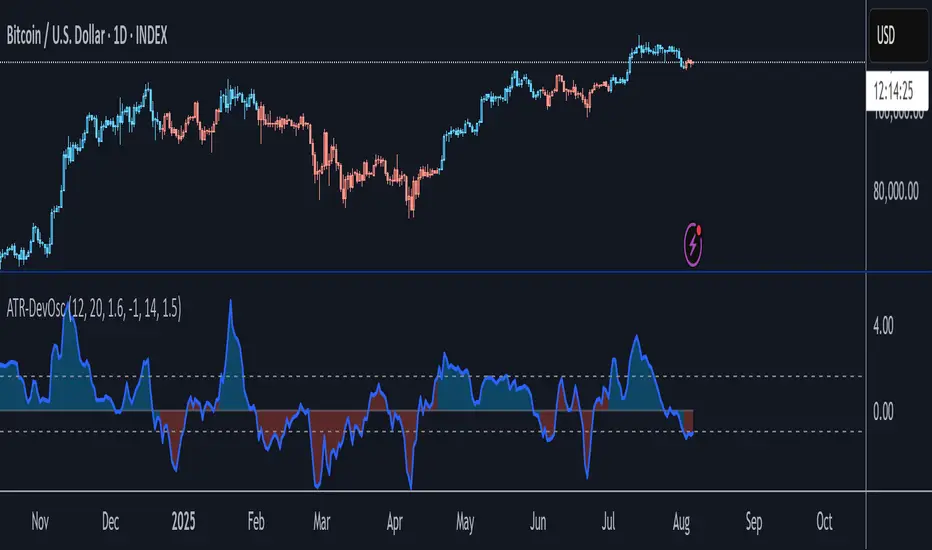
ATR-Scaled Deviation OscillatorATR-DevOsc is a custom momentum-and-volatility adaptive oscillator that scales N-bar price momentum by its rolling deviation and then reacts dynamically to sudden ATR spikes. By shrinking the deviation window when true volatility surges, it amplifies extreme moves—making medium-term trend shifts and deep drawdowns far more likely to breach your predefined thresholds.
Key features include:
• configurable momentum length and separate deviation length for precise control over look-back periods
• ATR Reaction Multiplier to tune how strongly sudden volatility spikes contract the deviation, boosting oscillator amplitude during extreme moves
• independent upper and lower threshold inputs for clear long/short signal definitions
• integrated candle-coloring overlay to immediately visualize trend state on your price chart
• built-in alert conditions for both oscillator-threshold crossovers and ATR-reactive triggers
This indicator is particularly useful for swing traders seeking medium-term entry and exit points in highly volatile markets like BTC. It combines normalized momentum readings with true volatility feedback, so large drawdowns or breakouts generate unmistakable signal events while routine noise stays filtered.
Note: ATR-DevOsc is provided “as is” without formal robustness or optimization testing. Past performance is not indicative of future results; use in live trading only after sufficient back-testing and validation.
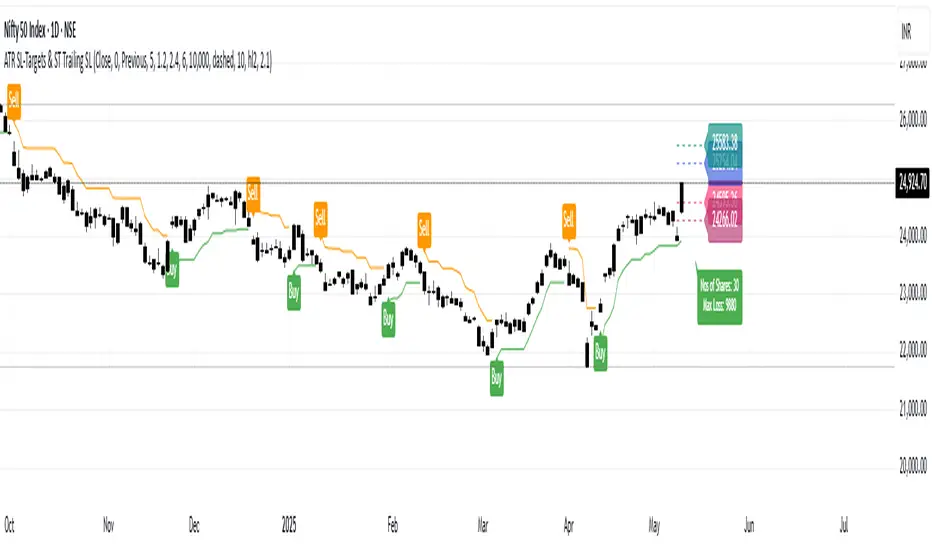
ATR Stop-Loss & TargetsATR and Supertrend-based SL/TP & Trailing System
This indicator combines Average True Range (ATR) and Supertrend logic to help traders define precise stop-loss, first target, and trailing stop-loss (TSL) levels.
⚙️ Key Features:
📏 ATR-based Stop-Loss & Target Lines:
Uses ATR (default period: 5) based on the previous day's candle for more stable risk management.
Traders can choose the price source: Close, Open, or enter a manual price.
SL and first target are calculated using multipliers:
Multiplier 1 = Stop Loss
Multiplier 2 = First Target
📉 Supertrend for Trailing Stop:
Built-in Supertrend logic for trailing stop-loss management.
Uses ATR(10) with a multiplier of 2.1, based on HL2.
Supertrend can be toggled ON/OFF from the settings.
Engulfing Candles (ATR-Based)This indicator detects Engulfing Patterns with an ATR-based filtering mechanism and trend confirmation. Unlike a basic engulfing pattern indicator that only checks if a current candle engulfs the previous one, this script incorporates trend detection using either the 50-period SMA alone or a combination of 50 and 200-period SMAs to ensure that signals align with the broader trend. The indicator identifies Bullish Engulfing patterns when a strong bullish candle engulfs a smaller bearish candle in a downtrend and Bearish Engulfing patterns when a strong bearish candle engulfs a smaller bullish candle in an uptrend. It also generates alerts and visually marks these patterns with labels ("BU" for bullish and "BE" for bearish) while highlighting the background accordingly.
What sets this indicator apart from a normal engulfing indicator is its ATR-based filtering system, which ensures that only significant engulfing candles are considered. Instead of accepting any engulfing pattern, the script measures candle body size relative to 1.5x ATR (configurable) to filter out weak signals. It also differentiates between long-bodied and small-bodied candles to confirm that the engulfing pattern represents real momentum shifts. This approach reduces false signals caused by small, insignificant candles and ensures that traders focus on high-probability reversal patterns. By integrating trend-based filtering and ATR-based confirmation, this indicator provides more reliable and context-aware engulfing signals than a standard engulfing pattern detector.
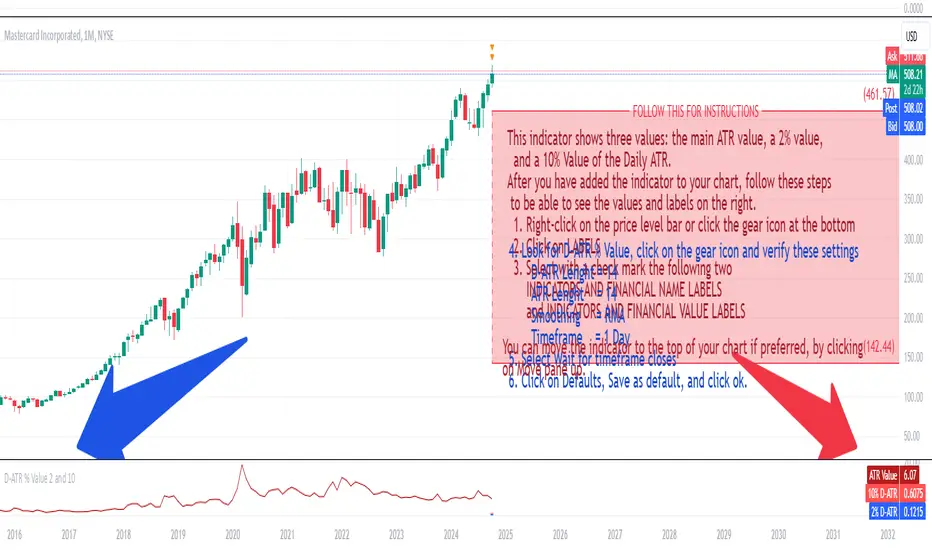
Daily ATR 2 and 10 Percent Value
This indicator shows three values: the main ATR value, a 2% value,
and a 10% Value of the Daily ATR.
After you have added the indicator to your chart, follow these steps
to be able to see the values and labels on the right.
1. Right-click on the price level bar or click the gear icon at the bottom
2. Click on LABELS
3. Select with a check mark the following two
INDICATORS AND FINANCIAL NAME LABELS
and INDICATORS AND FINANCIAL VALUE LABELS
4. Look for D-ATR % Value, click on the gear icon and verify these settings
- D-ATR Lenght = 14
- ATR Lenght = 14
- Smoothing = RMA
- Timeframe = 1 Day
5. Select Wait for timeframe closes
6. Click on Defaults, Save as default, and click ok.
You can move the indicator to the top of your chart if preferred, by clicking
on Move pane up.
Slightly modifications from other indicators.
Fetch ATR + MA StrategyA trend following indicator that allows traders/investors to enter trades for the long term, as it is mainly tested on the daily chart. The indicator fires off buy and sell signals. The sell signals can be turned off as trader can decide to use this indicator for long term buy signals. The buy signals are indicated by the green diamonds, and the red diamonds show the points on then chart where the asset can be sold.
The indicator uses a couple indicators in order to generate the buy signals:
- ADX
- ATR
- Moving Average of ATR
- 50 SMA
- 200 SMA
The buy signal is generated at the cross overs of the 50 and 200 SMA's while the ATR is lower than then Moving Average of the ATR. The buy signal is fired when these conditions are met and if the ADX is lower than 30.
The thought process is as follows:
When the ATR is lower than its moving average, the price should be in a low volatilty environment. An ADX between 25 and 50 signals a Strong trend. Every value below 25 is an absent or weak trend. So entering a trade when the volatilty is still low but increasing, you'll be entering a trade at the start of a new uptrend. This mechanism also filters out lots of false signals of the simple cross overs.
The sell signals are fired every time the 50 SMA drops below the 200 SMA.
