BTC Buy Sell Guide (BSG) - MA & RSIhi BTChes,
green is when the price drops below the 100 day MA
red is the intensity of the 14 day RSI
BUY @ green
SELL @ the second or third RSI spike
most importantly, keep in mind fundamentals :)
-joie
Cerca negli script per "BTC"
(CRISIS) BTC money flow oscilator V0.1Modified version of Ricado Santos' money flow oscilator.
now featuring 3 oscilators. Makes it easier to obseerve when dumps/pumps are targeting OKC futures contracts or just looking for divergences.
1x Aggregate of OKcoin:BTCCNY, Houbi:BTCCNY & Bitfinex:BTCUSD (Orange)
1X OKcoin 1 Week futures (pink)
1x OKcoin 3 Month futures (purple)
Ben's BTC Macro Fair Value OscillatorBen's BTC Macro Fair Value Oscillator
Overview
The **BTC Macro Fair Value Oscillator** is a non-crypto fair value framework that uses macro asset relationships (equities, dollar, gold) to estimate Bitcoin's "macro-driven fair value" and identify mean-reversion opportunities.
"Is BTC cheap or expensive right now?" on the 4 Hour Timeframe ONLY
### Key Features
✅ **Macro-driven**: Uses QQQ, DXY, XAUUSD instead of on-chain or crypto metrics
✅ **Dynamic weighting**: Assets weighted by rolling correlation strength
✅ **Mean-reversion signals**: Identifies when BTC is cheap/expensive vs macro
✅ **Validated parameters**: Optimized through 5-year backtest (Sharpe 6.7-9.9)
✅ **Visual transparency**: Live correlation panel, fair value bands, statistics
✅ **Non-repainting**: All calculations use confirmed historical data only
### What This Indicator Does
- Builds a **synthetic macro composite** from traditional assets
- Runs a **rolling regression** to predict BTC price from macro
- Calculates **deviation z-score** (how far BTC is from macro fair value)
- Generates **entry signals** when BTC is extremely cheap vs macro (dev < -2)
- Generates **exit signals** when BTC returns to fair value (dev > 0)
### What This Indicator Is NOT
❌ Not a high-frequency trading system (sparse signals by design)
❌ Not optimized for absolute returns (optimized for Sharpe ratio)
❌ Not suitable as standalone trading system (best as overlay/confirmation)
❌ Not predictive of short-term price movements (mean-reversion timeframe: days to weeks)
---
## Core Concept
### The Premise
Bitcoin doesn't trade in a vacuum. It's influenced by:
- **Risk appetite** (equities: QQQ, SPX)
- **Dollar strength** (DXY - inverse to risk assets)
- **Safe haven flows** (Gold: XAUUSD)
When macro conditions are "good for BTC" (risk-on, weak dollar, strong equities), BTC should trade higher. When macro conditions turn against it, BTC should trade lower.
### The Innovation
Instead of looking at BTC in isolation, this indicator:
1. **Measures how strongly** BTC currently correlates with each macro asset
2. **Builds a weighted composite** of those macro returns (the "D" driver)
3. **Regresses BTC price on D** to estimate "macro fair value"
4. **Tracks the deviation** between actual price and fair value
5. **Signals mean reversion** when deviation becomes extreme
### The Edge
The validated edge comes from:
- **Extreme deviations predict future returns** (dev < -2 → +1.67% over 12 bars)
- **Monotonic relationship** (more negative dev → higher forward returns)
- **Works out-of-sample** (test Sharpe +83-87% better than training)
- **Low correlation with buy & hold** (provides diversification value)
---
## Methodology
### Step 1: Macro Composite Driver D(t)
The indicator builds a weighted composite of macro asset returns:
**Process:**
1. Calculate **log returns** for BTC and each macro reference (QQQ, DXY, XAUUSD)
2. Compute **rolling correlation** between BTC and each reference over `corrLen` bars
3. **Weight each asset** by `|correlation|` if above `minCorrAbs` threshold, else 0
4. **Sign-adjust** weights (+1 for positive corr, -1 for negative) to handle inverse relationships
5. **Z-score normalize** each reference's returns over `fvWindow`
6. **Composite D(t)** = weighted sum of sign-adjusted z-scores
**Formula:**
```
For each reference i:
corr_i = correlation(BTC_returns, ref_i_returns, corrLen)
weight_i = |corr_i| if |corr_i| >= minCorrAbs else 0
sign_i = +1 if corr_i >= 0 else -1
z_i = (ref_i_returns - mean) / std
contrib_i = sign_i * z_i * weight_i
D(t) = sum(contrib_i) / sum(weight_i)
```
**Key Insight:** D(t) represents "how good macro conditions are for BTC right now" in a normalized, correlation-weighted way.
---
### Step 2: Fair Value Regression
Uses rolling linear regression to predict BTC price from D(t):
**Model:**
```
BTC_price(t) = α + β * D(t)
```
**Calculation (Pine Script approach):**
```
corr_CD = correlation(BTC_price, D, fvWindow)
sd_price = stdev(BTC_price, fvWindow)
sd_D = stdev(D, fvWindow)
cov = corr_CD * sd_price * sd_D
var_D = variance(D, fvWindow)
β = cov / var_D
α = mean(BTC_price) - β * mean(D)
fair_value(t) = α + β * D(t)
```
**Result:** A time-varying "macro fair value" line that adapts as correlations change.
---
### Step 3: Deviation Oscillator
Measures how far BTC price has deviated from fair value:
**Calculation:**
```
residual(t) = BTC_price(t) - fair_value(t)
residual_std = stdev(residual, normWindow)
deviation(t) = residual(t) / residual_std
```
**Interpretation:**
- `dev = 0` → BTC at fair value
- `dev = -2` → BTC is 2 standard deviations **cheap** vs macro
- `dev = +2` → BTC is 2 standard deviations **rich** vs macro
---
### Step 4: Signal Generation
**Long Entry:** `dev` crosses below `-2.0` (BTC extremely cheap vs macro)
**Long Exit:** `dev` crosses above `0.0` (BTC returns to fair value)
**No shorting** in default config (risk management choice - crypto volatility)
---
## How It Works
### Visual Components
#### 1. Price Chart (Main Panel)
**Fair Value Line (Orange):**
- The estimated "macro-driven fair value" for BTC
- Calculated from rolling regression on macro composite
**Fair Value Bands:**
- **±1σ** (light): 68% confidence zone
- **±2σ** (medium): 95% confidence zone
- **±3σ** (dark, dots): 99.7% confidence zone
**Entry/Exit Markers:**
- **Green "LONG" label** below bar: Entry signal (dev < -2)
- **Red "EXIT" label** above bar: Exit signal (dev > 0)
#### 2. Deviation Oscillator (Separate Pane)
**Line plot:**
- Shows current deviation z-score
- **Green** when dev < -2 (cheap)
- **Red** when dev > +2 (rich)
- **Gray** when neutral
**Histogram:**
- Visual representation of deviation magnitude
- Green bars = negative deviation (cheap)
- Red bars = positive deviation (rich)
**Threshold lines:**
- **Green dashed at -2.0**: Entry threshold
- **Red dashed at 0.0**: Exit threshold
- **Gray solid at 0**: Fair value line
#### 3. Correlation Panel (Top-Right)
Shows live correlation and weighting for each macro asset:
| Asset | Corr | Weight |
|-------|------|--------|
| QQQ | +0.45 | 0.45 |
| DXY | -0.32 | 0.32 |
| XAUUSD | +0.15 | 0.00 |
| Avg \|Corr\| | 0.31 | 0.77 |
**Reading:**
- **Corr**: Current rolling correlation with BTC (-1 to +1)
- **Weight**: How much this asset contributes to fair value (0 = excluded)
- **Avg |Corr|**: Average correlation strength (should be > 0.2 for reliable signals)
**Colors:**
- Green/Red corr = positive/negative correlation
- White weight = asset included, Gray = excluded (below minCorrAbs)
#### 4. Statistics Label (Bottom-Right)
```
━━━ BTC Macro FV ━━━
Dev: -2.34
Price: $103,192
FV: $110,500
Status: CHEAP ⬇
β: 103.52
```
**Fields:**
- **Dev**: Current deviation z-score
- **Price**: Current BTC close price
- **FV**: Current macro fair value estimate
- **Status**: CHEAP (< -2), RICH (> +2), or FAIR
- **β**: Current regression beta (sensitivity to macro)
---
## Installation & Setup
### TradingView Setup
1. Open TradingView and navigate to any **BTC chart** (BTCUSD, BTCUSDT, etc.)
2. Open **Pine Editor** (bottom panel)
3. Click **"+ New"** → **"Blank indicator"**
4. **Delete** all default code
5. **Copy** the entire Pine Script from `GHPT_optimized.pine`
6. **Paste** into the editor
7. Click **"Save"** and name it "BTC Macro Fair Value Oscillator"
8. Click **"Add to Chart"**
### Recommended Chart Settings
**Timeframe:** 4h (validated timeframe)
**Chart Type:** Candlestick or Heikin Ashi
**Overlay:** Yes (indicator plots on price chart + separate pane)
**Alternative Timeframes:**
- Daily: Works but slower signals
- 1h-2h: May work but not validated
- < 1h: Not recommended (too noisy)
### Symbol Requirements
**Primary:** BTC/USD or BTC/USDT on any exchange
**Macro References:** Automatically fetched
- QQQ (Nasdaq 100 ETF)
- DXY (US Dollar Index)
- XAUUSD (Gold spot)
**Data Requirements:**
- At least **90 bars** of history (warmup period)
- Premium TradingView recommended for full historical data
---
## Reading the Indicator
### Identifying Signals
#### Strong Long Signal (High Conviction)
- ✅ Deviation < -2.0 (extreme undervaluation)
- ✅ Avg |Corr| > 0.3 (strong macro relationships)
- ✅ Price touching or below -2σ band
- ✅ "LONG" label appears below bar
**Interpretation:** BTC is extremely cheap relative to macro conditions. Historical data shows +1.67% average return over next 12 bars (48 hours at 4h timeframe).
#### Moderate Long Signal (Lower Conviction)
- ⚠️ Deviation between -1.5 and -2.0
- ⚠️ Avg |Corr| between 0.2-0.3
- ⚠️ Price approaching -2σ band
**Interpretation:** BTC is cheap but not extreme. Consider as confirmation for other signals.
#### Exit Signal
- 🔴 Deviation crosses above 0 (returns to fair value)
- 🔴 "EXIT" label appears above bar
**Interpretation:** Mean reversion complete. Close long positions.
#### Strong Short/Avoid Signal
- 🔴 Deviation > +2.0 (extreme overvaluation)
- 🔴 Avg |Corr| > 0.3
- 🔴 Price touching or above +2σ band
**Interpretation:** BTC is expensive vs macro. Historical data shows -1.79% average return over next 12 bars. Consider exiting longs or reducing exposure.
### Regime Detection
**Strong Regime (Reliable Signals):**
- Avg |Corr| > 0.3
- Multiple assets weighted > 0
- Fair value line tracking price reasonably well
**Weak Regime (Unreliable Signals):**
- Avg |Corr| < 0.2
- Most weights = 0 (grayed out)
- Fair value line diverging wildly from price
- **Action:** Ignore signals until correlations strengthen

Intellect_city - Halvings Bitcoin CycleWhat is halving?
The halving timer shows when the next Bitcoin halving will occur, as well as the dates of past halvings. This event occurs every 210,000 blocks, which is approximately every 4 years. Halving reduces the emission reward by half. The original Bitcoin reward was 50 BTC per block found.
Why is halving necessary?
Halving allows you to maintain an algorithmically specified emission level. Anyone can verify that no more than 21 million bitcoins can be issued using this algorithm. Moreover, everyone can see how much was issued earlier, at what speed the emission is happening now, and how many bitcoins remain to be mined in the future. Even a sharp increase or decrease in mining capacity will not significantly affect this process. In this case, during the next difficulty recalculation, which occurs every 2014 blocks, the mining difficulty will be recalculated so that blocks are still found approximately once every ten minutes.
How does halving work in Bitcoin blocks?
The miner who collects the block adds a so-called coinbase transaction. This transaction has no entry, only exit with the receipt of emission coins to your address. If the miner's block wins, then the entire network will consider these coins to have been obtained through legitimate means. The maximum reward size is determined by the algorithm; the miner can specify the maximum reward size for the current period or less. If he puts the reward higher than possible, the network will reject such a block and the miner will not receive anything. After each halving, miners have to halve the reward they assign to themselves, otherwise their blocks will be rejected and will not make it to the main branch of the blockchain.
The impact of halving on the price of Bitcoin
It is believed that with constant demand, a halving of supply should double the value of the asset. In practice, the market knows when the halving will occur and prepares for this event in advance. Typically, the Bitcoin rate begins to rise about six months before the halving, and during the halving itself it does not change much. On average for past periods, the upper peak of the rate can be observed more than a year after the halving. It is almost impossible to predict future periods because, in addition to the reduction in emissions, many other factors influence the exchange rate. For example, major hacks or bankruptcies of crypto companies, the situation on the stock market, manipulation of “whales,” or changes in legislative regulation.
---------------------------------------------
Table - Past and future Bitcoin halvings:
---------------------------------------------
Date: Number of blocks: Award:
0 - 03-01-2009 - 0 block - 50 BTC
1 - 28-11-2012 - 210000 block - 25 BTC
2 - 09-07-2016 - 420000 block - 12.5 BTC
3 - 11-05-2020 - 630000 block - 6.25 BTC
4 - 20-04-2024 - 840000 block - 3.125 BTC
5 - 24-03-2028 - 1050000 block - 1.5625 BTC
6 - 26-02-2032 - 1260000 block - 0.78125 BTC
7 - 30-01-2036 - 1470000 block - 0.390625 BTC
8 - 03-01-2040 - 1680000 block - 0.1953125 BTC
9 - 07-12-2043 - 1890000 block - 0.09765625 BTC
10 - 10-11-2047 - 2100000 block - 0.04882813 BTC
11 - 14-10-2051 - 2310000 block - 0.02441406 BTC
12 - 17-09-2055 - 2520000 block - 0.01220703 BTC
13 - 21-08-2059 - 2730000 block - 0.00610352 BTC
14 - 25-07-2063 - 2940000 block - 0.00305176 BTC
15 - 28-06-2067 - 3150000 block - 0.00152588 BTC
16 - 01-06-2071 - 3360000 block - 0.00076294 BTC
17 - 05-05-2075 - 3570000 block - 0.00038147 BTC
18 - 08-04-2079 - 3780000 block - 0.00019073 BTC
19 - 12-03-2083 - 3990000 block - 0.00009537 BTC
20 - 13-02-2087 - 4200000 block - 0.00004768 BTC
21 - 17-01-2091 - 4410000 block - 0.00002384 BTC
22 - 21-12-2094 - 4620000 block - 0.00001192 BTC
23 - 24-11-2098 - 4830000 block - 0.00000596 BTC
24 - 29-10-2102 - 5040000 block - 0.00000298 BTC
25 - 02-10-2106 - 5250000 block - 0.00000149 BTC
26 - 05-09-2110 - 5460000 block - 0.00000075 BTC
27 - 09-08-2114 - 5670000 block - 0.00000037 BTC
28 - 13-07-2118 - 5880000 block - 0.00000019 BTC
29 - 16-06-2122 - 6090000 block - 0.00000009 BTC
30 - 20-05-2126 - 6300000 block - 0.00000005 BTC
31 - 23-04-2130 - 6510000 block - 0.00000002 BTC
32 - 27-03-2134 - 6720000 block - 0.00000001 BTC

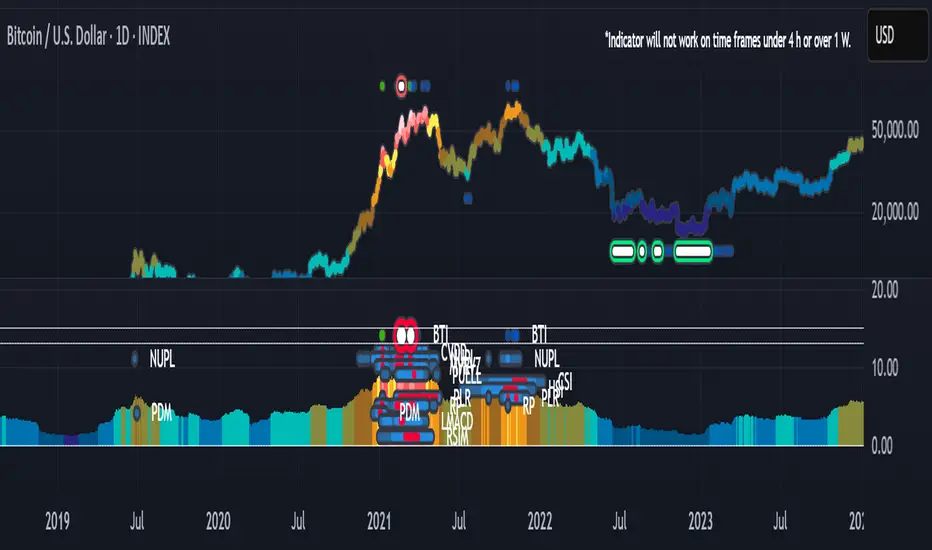
BTB - Bitcoin (BTC) Top and Bottom Indicator [Logue]This indicator is a combination of multiple on-chain, seasonality, and momentum BTC macro cycle bottom and top indicators. The BTB detects confluence of multiple indicators to select bottoms and tops of each BTC macro cycle. More detail can be seen on the BTI and BBI indicators. The BTB indicators are:
1) Cumulative Value Days Destroyed (CVDD) - The CVDD is the ratio of the cumulative value of coin days destroyed in USD and the market age (in days). When the BTC price goes below this value, BTC is generally considered to be undervalued. The bottom indicator is triggered when the BTC price is below the CVDD or above the CVDD extension. Because the "strength" of the BTC tops has decreased over the cycles, a logarithmic function for the extension was created by fitting past cycles as log extension = slope * time + intercept.
2) Net Unrealized Profit Loss (NUPL) - The NUPL measures if past transfers of BTC are currently in an unrealized profit or loss state. Historically positive or negative NUPL values indicate an over/undervaluation of the BTC network. The bottom indicator is triggered when the NUPL is below -15 and the top is triggered above an adjusted value based on decreasing "strength" of BTC tops. A decreasing linear function (trigger = slope * time + intercept) was fit to past cycle tops and used to determine overvaluation.
3) Market Value-Realized Value Z-score (MVRV-Z) - The MVRV-Z measures the value of the bitcoin network by comparing the market cap to the realized value and dividing by the standard deviation of the market cap (market cap – realized cap) / std(market cap)). The bottom indicator is triggered when the MVRVZ value is below 4 and tops are above 55.
4) Puell multiple (PUELL) - PUELL is the ratio between the daily coin issuance in USD and its 365-day moving average. This multiple helps to measure miner profitability. Extremes in PUELL may indicate tops or bottoms. The bottom indicator triggers when the PUELL is below 0.4 and top is triggered above 3.33.
5) Calendar Seasonality Index (CSI) - The CSI takes advantage of the consistency of BTC cycles. Past cycles have formed macro bottoms every four years between December and February which triggers the bottom indicator. Past cycles have formed macro tops every four years between October 21st and December 12th, triggering the top indicator.
6) Halving Seasonality Index (HSI) - Past cycles have formed macro bottoms approximately 948 days after each halving, triggering this indicator at set times, 948 +- 45 days, after each halving. Aside from the first halving, cycles have formed macro tops approximately 538 days after each halving. Therefore, this indicator triggers at 538 +- 10 days after each halving.
7) Polylog Regression (PLR) - The BTC cycle tops and bottoms were separately fit using a polynomial regression. The shape of the regression into the future was estimated and a fit was used to estimate when tops and bottoms are near. This triggers when the BTC price is inside or below the lower polylog regression channel and when the BTC price is inside or above the upper polylog regression channel.
8) Realized Price (RP) - The RP is summation of the value of each BTC when it last moved divided by the total number of BTC in circulation. This gives an estimation of the average "purchase" price of BTC. This indicator triggers when the BTC price is below the realized price or above an RP extension. Because the "strength" of the BTC tops has decreased over the cycles, a logarithmic function for the extension was created by fitting past cycles as log extension = slope * time + intercept.
9) Plus Directional Movement (PDM) weekly index - The PDM is a momentum indicator that measures the strength of a trend in the positive direction. The weekly PDM is calculated by determining the difference between the week's high price and the previous week's high price smoothed by a 14-period moving average. Higher PDM values indicate higher momentum in the positive (higher price) direction. Based on decreasing "strength" of BTC tops, a decreasing linear function (trigger = slope * time + intercept) was fit to past cycle tops for this indicator. This indicator is triggered when the PDM is above the trigger value or below 14.
10) Logarithmic Moving Average Convergence Divergence (LMACD) weekly indicator - The LMACD is a momentum indicator that measures the strength of a trend using the difference of the log values of the 12-period and 26-week exponential moving averages. Larger positive numbers indicate a larger positive momentum. Based on decreasing "strength" of BTC tops, a decreasing linear function (trigger = slope * time + intercept) was fit to past cycle tops for this indicator. This indicator is triggered when the PDM is above the trigger value or below -0.06.
11) Hash Rate Capitulation (HRC) - The HRC indicator measures the rate of change of the hash rate. Steadily increasing hash rate is a sign of health of the bitcoin network. This indicator uses moving averages (20- and 100-day) of the hash rate to indicate when a decrease in the rate of change is has occurred (i.e., the 20-day MA goes below the 100-day MA). This indicator triggers when the 20-day moving average of the hash rate going below the 100-day moving average.
12) Pi-cycle Top (PCT) - The PCT indicator is simply the cross of the 111-day moving average above a 2x multiple of the 350-day moving average of the BTC price. While there is no fundamental reasoning behind why this works, it has worked to indicate previous bitcoin tops by taking advantage of the cyclicality of the BTC price and measurement overextension of BTC price. This indicator triggers when the fast moving average (111-day) crosses above the 2x multiple of the slow moving average (350-day).
13) Transaction Fee Spike (TFS) - Transaction fees on the bitcoin network can signal a mania phase when they increase well above historical values. This mania phase may indicate we are near a top in the BTC price. The daily transaction fee total in USD is divided by the number of daily transactions to calculate the average transaction fee paid on the bitcoin network. The transaction fees increasing above $40 trigger this indicator.
The on-chain indicators (CVDD, NUPL, MVRV-Z, PUELL, RP, and HRC) work together to give a health check of the BTC price as compared to its network health. The seasonality indicators (CSI, HSI, and PLR) work together to map the macro cycles of BTC. The momentum indicators (PDM and LMACD) give the strength of the BTC trend. Each of these indicators is weighted evenly when selected and if over 45% of the indicators are triggering on a candle, the overall BTB indicator prints a clear signal. This signal is meant to indicate when the macro cycle bottom or top is likely hit or is near.
You are able to deselect any indicator you do not wish to have considered and select it back again. To prepare you for indicators triggering, the BTB shows dark blue or dark green when the indicator is close to triggering. The background color of the BBI becomes blue when at least 30% of the indicators considered are triggering and it becomes green when the BBI fully triggers. The BLX is most appropriate chart, but the indicator works on all BTC/USD charts. Because of the limitations of TradingView, the indicator doesn't work on time frames lower than 4 h or over one week.
Use this indicator at your own risk. I make no assertions that this indicator will work to detect any future bottom or top since we all know that past performance is no guarantee of future results.

BTI - Bitcoin (BTC) Top Indicator [Logue]Bitcoin top indicator. This indicator is a combination of multiple on-chain and seasonality BTC macro cycle top indicators, plus the Pi-Cycle top moving average. Because there is no magic single indicator to detect macro cycle tops in bitcoin, the BTI detects confluence of multiple indicators to select tops of each BTC macro cycle. The individual indicators used for the BTI are:
1) Cumulative Value Days Destroyed (CVDD) - The CVDD was created by Willy Woo and is the ratio of the cumulative value of Coin Days Destroyed in USD and the market age (in days). While this indicator is used to detect bottoms normally, an extension is used to allow detection of BTC tops. When the BTC price goes above the CVDD extension, BTC is generally considered to be overvalued. Because the "strength" of the BTC tops has decreased over the cycles, a logarithmic function for the extension was created by fitting past cycles as log extension = slope * time + intercept. This indicator is triggered when the BTC price is above the CVDD extension.
2) Net Unrealized Profit Loss (NUPL) - The NUPL measures the profit state of the bitcoin network to determine if past transfers of BTC are currently in an unrealized profit or loss state.
Values above zero indicate that the network is in overall profit, while values below zero indicate the network is in overall loss. Highly positive NUPL values indicate overvaluation of the BTC network. Based on decreasing "strength" of BTC tops, a decreasing linear function (trigger = slope * time + intercept) was fit to past cycle tops. Therefore, future trigger values can be calculated over time. This indicator is triggered when the NUPL is above the trigger value.
3) Market Value-Realized Value Z-score (MVRV-Z) - The MVRV-Z measures the value of the bitcoin network by comparing the market cap to the realized value and dividing by the standard deviation of the market cap (market cap – realized cap) / std(market cap)). When the market value is significantly higher than the realized value, the bitcoin network is "overvalued". Very high values have signaled cycle tops in the past. This indicator is triggered when the MVRVZ value is above 55.
4) Puell multiple (PUELL) - PUELL is the ratio between the daily coin issuance in USD and its 365-day moving average. This multiple helps to measure miner profitability. When the PUELL goes to extremely high values relative to historical values, it indicates the profitability of the miners is very high and a top may be near. This indicator triggers when the PUELL is above 3.33.
5) Calendar Seasonality Index (CSI) - The CSI takes advantage of the consistency of BTC cycles. Past cycles have formed macro tops every four years between October 21st and December 12th. Therefore, this indicator triggers at set times that are marked every four years between these two dates.
6) Halving Seasonality Index (HSI) - The HSI, as with the CSI, takes advantage of the consistency of BTC cycles following the major event that is the halving. Aside from the first halving cycle, cycles have formed macro tops approximately 538 days after each halving. Therefore, this indicator triggers at set times that are marked 528 to 548 days (i.e., 538 +- 10 days) after each halving.
7) Polylog Regression (PLR) - The BTC cycle tops and bottoms were separately fit using a polynomial regression for the PLR. The bottom band was fit on much more data than the top band, so is likely to be more reliable. The shape of the regression into the future was estimated, so may not be accurate into the future, but is the best fit of tops and bottoms to date. This indicator is used to estimate when tops and bottoms are near when the price goes into the top or bottom bands. This triggers when the BTC price is inside or above the upper polylog regression channel.
8) Realized Price (RP) - The RP is summation of the value of each BTC when it last moved divided by the total number of BTC in circulation. This gives an estimation of the average "purchase" price of BTC on the bitcoin network based on when it was last transacted. This indicator tells us if the average network participant is in a state of profit or loss. This indicator is normally used to detect BTC bottoms, but an extension can be used to detect when the bitcoin network is "highly" overvalued. Because the "strength" of the BTC tops has decreased over the cycles, a logarithmic function for the extension was created by fitting past cycles as log extension = slope * time + intercept. This indicator triggers when the BTC price is above the realized price extension.
9) Pi-cycle Top (PCT) - The PCT indicator is simply the cross of the 111-day moving average above a 2x multiple of the 350-day moving average of the BTC price. While there is no fundamental reasoning behind why this works, it has worked to indicate previous bitcoin tops by taking advantage of the cyclicality of the BTC price and measurement overextension of BTC price. This indicator triggers when the fast moving average (111-day) crosses above the 2x multiple of the slow moving average (350-day).
10) Transaction Fee Spike (TFS) - Transaction fees on the bitcoin network can signal a mania phase when they increase well above historical values. This mania phase may indicate we are near a top in the BTC price. The daily transaction fee total in USD is divided by the number of daily transactions to calculate the average transaction fee paid on the bitcoin network. The transaction fees increasing above $40 trigger this indicator.
The on-chain indicators (CVDD, NUPL, MVRV-Z, PUELL, RP, and TFS) work together to give a health check of the BTC price as compared to its network health. The seasonality indicators (CSI, HSI, and PLR) work together to map the macro cycles of BTC. The PCT gives a view of the overvaluation of the BTC price. Each of these indicators is weighted evenly when selected and if over 45% of the indicators are triggering on a candle (i.e., at least 5 of 10), the overall BTI indicator prints a clear signal -- a red dot with a white middle portion between the white horizontal lines at the top of the indicator. This signal is meant to indicate when the macro cycle top is likely already hit or is near. Each of the individual indicators used for the BTI are proven macro top indicators over multiple cycles.
Each of the individual indicators are shown in their own rows to visualize which indicators are triggering. You are able to deselect any indicator you do not wish to have considered and select it back again. To prepare you for indicators triggering, the BTI shows dark blue or dark green when the indicator is close to triggering (i.e., generally around 20% from the trigger value, a less intense background will appear, and 10% from the trigger value, a more intense background will appear). The color of the individual indicators turns pink when they are triggered. The background color of the BTI becomes blue when at least 30% of the indicators considered are triggering and it becomes purple/pink when the BTI fully triggers. See the BTC chart above the indicator showing the performance of the indicator in picking out macro top regions (red dots with white middle portion). Because not all daily data for BTC can be shown on one chart, ensure you also play with the indictor yourself. The BLX is most appropriate, but the indicator works on all BTC/USD charts. Because of the limits imposed by TradingView, the indicator doesn't work on time frames lower than 4 h or higher than the weekly.
You can use this indicator to help you understand when the BTC price is more likely topping based on past performance of these indicators. This indicator pairs with the BBI (Bitcoin (BTC) Bottom Indictor) and the BTB (Bitcoin Top and Bottom indicator).
Use this indicator at your own risk. I make no assertions that this indicator will work to detect any future top since we all know that past performance is no guarantee of future results.
Momentum Matrix (BTC-COIN)The Momentum Matrix (BTC-COIN) indicator analyzes the momentum relationship between Coinbase stock ( NASDAQ:COIN ) and Bitcoin ( CRYPTOCAP:BTC ). By combining RSI, correlation, and dominance metrics, it identifies bullish and bearish macro trends to align trades with market momentum.
How It Works
Price Inputs: Pulls weekly price data for CRYPTOCAP:BTC and NASDAQ:COIN for macro analysis.
Metrics Calculated:
• RSI Divergence: Measures momentum differences between CRYPTOCAP:BTC and $COIN.
• Price Ratio: Tracks the $COIN/ CRYPTOCAP:BTC relationship relative to its long-term average (SMA).
• Correlation: Analyzes price co-movement between CRYPTOCAP:BTC and $COIN.
• Dominance Impact: Incorporates CRYPTOCAP:BTC dominance for broader crypto trends.
Composite Momentum Score: Combines these metrics into a smoothed macro momentum value.
Thresholds for Trend Detection: Upper and lower thresholds dynamically adapt to market conditions.
Signals and Visualization:
• Buy Signal: Momentum exceeds the upper threshold, indicating bullish trends.
• Sell Signal: Momentum falls below the lower threshold, indicating bearish trends.
• Background Colors: Green (bullish), Red (bearish).
Strengths
Integrates multiple metrics for robust macro analysis.
Dynamic thresholds adapt to market conditions.
Effective for identifying macro momentum shifts.
Limitations
Lag in high volatility due to smoothing.
Less effective in choppy, sideways markets.
Assumes CRYPTOCAP:BTC dominance drives NASDAQ:COIN momentum, which may not always hold true.
Improvements
Multi-Timeframe Analysis: Add daily or monthly data for precision.
Volume Filters: Include volume thresholds for signal validation.
Additional Metrics: Consider MACD or Stochastics for further confirmation.
Complementary Tools
Volume Indicators: OBV or cumulative delta for confirmation.
Trend-Following Systems: Pair with moving averages for timing.
Market Breadth Metrics: Combine with CRYPTOCAP:BTC dominance trends for context.

BBI - Bitcoin (BTC) Bottom Indicator [Logue]This indicator is a combination of multiple on-chain and seasonality BTC macro cycle bottom indicators. Because there is no magic single indicator to detect macro cycle bottoms in bitcoin, the BBI detects confluence of multiple indicators to select bottoms of each BTC macro cycle. The individual indicators used for the BBI are:
1) Cumulative Value Days Destroyed (CVDD) - The CVDD was created by Willy Woo and is the ratio of the cumulative value of Coin Days Destroyed in USD and the market age (in days). When the BTC price goes below this value, BTC is generally considered to be undervalued. This indicator is triggered when the BTC price is below the CVDD.
2) Net Unrealized Profit Loss (NUPL) - The NUPL measures the profit state of the bitcoin network to determine if past transfers of BTC are currently in an unrealized profit or loss state.
Values above zero indicate that the network is in overall profit, while values below zero indicate the network is in overall loss. Highly negative NUPL values indicate an undervaluation of the BTC network. This indicator is triggered when the NUPL is below -15.
3) Market Value-Realized Value Z-score (MVRV-Z) - The MVRV-Z measures the value of the bitcoin network by comparing the market cap to the realized value and dividing by the standard deviation of the market cap (market cap – realized cap) / std(market cap)). When the market value is significantly lower than the realized value, the bitcoin network is "undervalued". Very low values have signaled cycle bottoms in the past. This indicator is triggered when the MVRVZ value is below 4.
4) Puell multiple (PUELL) - PUELL is the ratio between the daily coin issuance in USD and its 365-day moving average. This multiple helps to measure miner profitability. When the PUELL goes to extremely low values relative to historical values, it indicates the profitability of the miners is low and a bottom may be near. This indicator triggers when the PUELL is below 0.4.
5) Calendar Seasonality Index (CSI) - The CSI takes advantage of the consistency of BTC cycles. Past cycles have formed macro bottoms every four years between December and February. Therefore, this indicator triggers at set times that are marked every four years in December, January, or February.
6) Halving Seasonality Index (HSI) - The HSI, as with the CSI, takes advantage of the consistency of BTC cycles following the major event that is the halving. Past cycles have formed macro bottoms approximately 948 days after each halving. Therefore, this indicator triggers at set times that are marked 903-993 days (i.e., 948 +- 45 days) after each halving.
7) Polylog Regression (PLR) - The BTC cycle tops and bottoms were separately fit using a polynomial regression for the PLR. The bottom band was fit on much more data than the top band, so is likely to be more reliable. The shape of the regression into the future was estimated, so may not be accurate into the future, but is the best fit of tops and bottoms to date. This indicator is used to estimate when tops and bottoms are near when the price goes into the top or bottom bands. This triggers when the BTC price is inside or below the lower polylog regression channel.
8) Realized Price (RP) - The RP is summation of the value of each BTC when it last moved divided by the total number of BTC in circulation. This gives an estimation of the average "purchase" price of BTC on the bitcoin network based on when it was last transacted. This indicator tells us if the average network participant is in a state of profit or loss. This indicator triggers when the BTC price is below the realized price.
9) Hash Rate Capitulation (HRC) - The HRC indicator measures the rate of change of the hash rate. Steadily increasing hash rate is a sign of health of the bitcoin network. This indicator uses moving averages (20- and 100-day) of the hash rate to indicate when a decrease in the rate of change is has occurred (i.e., the 20-day MA goes below the 100-day MA). This indicator triggers when the 20-day moving average of the hash rate going below the 100-day moving average.
The on-chain indicators (CVDD, NUPL, MVRV-Z, PUELL, RP, and HRC) work together to give a health check of the BTC price as compared to its network health. The seasonality indicators (CSI, HSI, and PLR) work together to map the macro cycles of BTC. Each of these indicators is weighted evenly when selected and if over 40% of the indicators are triggering on a candle (i.e., at least 4 of 9), the overall BBI indicator prints a clear signal -- a green dot with a white middle portion between the white horizontal lines at the top of the indicator. This signal is meant to indicate when the macro cycle bottom is likely already hit or is near. Each of the individual indicators used for the BBI are proven macro bottom indicators over multiple cycles.
Each of the individual indicators are shown in their own rows to visualize which indicators are triggering. You are able to deselect any indicator you do not wish to have considered and select it back again. To prepare you for indicators triggering, the BBI shows dark blue or dark green when the indicator is close to triggering (i.e., generally around 20% from the trigger value, a less intense background will appear, and 10% from the trigger value, a more intense background will appear). The color of the individual indicators turns pink when they are triggered. The background color of the BBI becomes blue when at least 30% of the indicators considered are triggering and it becomes green when the BBI fully triggers. See the BTC chart above the indicator showing the performance of the indicator in picking out macro bottom regions (green dots with white middle portion). Because not all daily data for BTC can be shown on one chart, ensure you also play with the indictor yourself. The BLX is most appropriate, but the indicator works on all BTC/USD charts. Because of the limitations of moving averages in TradingView, the indicator doesn't work on time frames lower than 4 h.
You can use this indicator to help you understand when the BTC price is more likely bottoming based on past performance of these indicators. This indicator pairs with the BTI (Bitcoin (BTC) top indictor) and the BTB (Bitcoin top and bottom) indicators.
Use this indicator at your own risk. I make no assertions that this indicator will work to detect any future bottom since we all know that past performance is no guarantee of future results.

MACRO BTC HEALTH 1WThis indicator is used as MACRO tool to view the outlook of BTC on the 1W time frame to illustrate (BLX chart works best)
BTC's price action and where it's at, it helps provide an indication of the crypto market's current health as BTC health is an overall indicator in the crypto market as a whole.
This indicator uses historic data to fit between 4 bands fitted to MA, top(red) when BTC is overheated, 2 bands in middle(yellow) when BTC in fair value, and bottom band(blue) when BTC is oversold
I combined MA that fit BTC 1W chart precisely to show when BTC looks overheated vs over sold using historic data.
When BTC is in the top bands historically overheated.
When BTC is in the middle it is fighting at fair value with the 2 yellow lines in the middle, bullish when above yellow lines, as they act as support, and in downtrend when price is below yellow lines and can act as resistance.
Historically the 200W MA is where BTC finds support at an oversold level at the bottom blue line.
When two yellow lines in middle cross downwards historically results in a downtrend to the bottom oversold line (blue). and when two yellow lines cross up and BTC holds them as support bullish trend continues until it is overheated passed the red band.
This indicator is not meant for day trading but is meant to illustrate a MACRO view of BTC current situation from a zoomed-out view, and to help illustrate to investors where things are at so they leave emotions out of the market and can make decisions based on BTC current levels using Historic data. Pro tip use bottom line(blue, oversold) as an opportunity to buy in and top line red(overheated) to scale out of positions, LONG TERM CRYPTO IS BULLISH BUT GREAT TO GET AN OUTLOOK OF THE CURRENT STATE OF BTC, WHILE ALSO USING MACRO ECONOMIC SENTIMENT IRL, FUNDAMENTAL ECONOMIC DECISIONS, ECONOMIC CONDITIONS/ENVIRONMENT, ECONOMIC HEALTH ,FED DECISIONS, INTEREST RATE ENVIRONMENT AND OF COURSE LOOKING AT CRYPTO ADOPTION.
Hope this indicator helps leave emotions out of the market by providing a good guide of BTC sentiment, and its current health to make decisions accordingly. NFA but good to envision the MACRO BTC HEALTH at the 1W timeframe.

CE Crypto Dow Theory – BTC & ETH # Professional User Guide: Crypto Dow Theory Indicator
## Crypto Exponentials Technical Analysis Suite
---
## 📋 Introduction
Welcome to the Crypto Dow Theory indicator—a professional-grade technical analysis tool designed for sophisticated cryptocurrency market participants. This comprehensive guide will enable you to leverage the full capabilities of the indicator for informed trading decisions.
**Prerequisites**: Basic understanding of technical analysis and Dow Theory principles recommended but not required.
---
## 🚀 Initial Setup Protocol
### Step 1: Adding the Indicator
1. Navigate to **Indicators** menu at the top of your TradingView chart
2. Search for **"Crypto Dow Theory – BTC & ETH"** in your invited/private scripts
3. Click to apply the indicator to your active chart
4. The indicator will overlay directly on the price chart
### Step 2: Optimal Configuration
Access settings via the **gear icon (⚙️)** next to the indicator name:
#### Essential Parameters
**Dow Theory Settings**
- **Min % Move (Pullback Threshold)**: 5.0% (default)
*Recommendation*: 5-7% for standard volatility, 8-10% for high volatility periods
- **Min Days for Secondary Reaction**: 8 days (default)
*Note*: This parameter is currently informational; future versions may incorporate duration filtering
- **Timeframe**: D (Daily) - *Primary recommendation for reliable signals*
**Symbol Configuration**
- **Bitcoin Symbol**: BTCUSD (default)
*Alternatives*: COINBASE:BTCUSD, BINANCE:BTCUSDT, BITSTAMP:BTCUSD
- **Ethereum Symbol**: ETHUSD (default)
*Alternatives*: COINBASE:ETHUSD, BINANCE:ETHUSDT, BITSTAMP:ETHUSD
#### Visual Options (Customizable Display)
**Recommended Professional Setup**:
- ✅ **Show Divergence Alerts**: ON (critical signals)
- ☐ **Show Support/Resistance Lines**: OFF (toggle on for level analysis)
- ☐ **Show Trend Change Arrows**: OFF (toggle on for entry/exit timing)
- ☐ **Show BTC/ETH Price Lines**: OFF (redundant with price chart)
- ✅ **Show Pullback Triangles**: ON (continuous market state monitoring)
- ✅ **Show Info Label**: ON (real-time pullback metrics)
- ☐ **Show Help Panel**: OFF (reference available in this documentation)
#### Alert Configuration
**Alert Threshold Settings**
- **Alert on Pullback Greater Than**: 10.0% (default for significant moves)
*Adjust based on your risk tolerance and trading style*
---
## 📊 Signal Interpretation Framework
### Primary Status Indicator (Top Label)
Located at the top-right of your chart, this label provides instant market condition assessment:
- **✓ BULLISH** → Both assets in confirmed uptrend
*Interpretation*: Favorable conditions for long positioning; primary trend intact
- **⚠️ BTC** → Bitcoin in pullback phase
*Interpretation*: Monitor Ethereum for confirmation; potential isolated correction
- **⚠️ ETH** → Ethereum in pullback phase
*Interpretation*: Monitor Bitcoin for confirmation; assess correlation strength
- **⚠️ BOTH PULLBACK** → Dual-asset correction in progress
*Interpretation*: Market-wide retracement; defensive positioning recommended
### Information Label (Bottom Display)
Positioned at the bottom-right, this label provides quantitative pullback metrics:
**Format Examples**:
- `BTC: 5.2% down | ETH: 3.1% down` → Both assets in measured pullback
- `BTC: Uptrend | ETH: Uptrend` → No corrections detected; trend strength
- `BTC: 8.7% down | ETH: Uptrend` → Single-asset pullback (divergence potential)
- **Additional Flag**: `DIVERGENCE!` → Correlation breakdown detected
### Visual Marker System
#### Continuous Indicators
**Pullback Triangles** (Small, persistent markers)
- 🟠 **Orange Triangles** → Bitcoin in secondary reaction (below candles)
- 🔵 **Blue Triangles** → Ethereum in secondary reaction (below candles)
- **Multiple Consecutive Triangles** → Extended pullback duration
*Professional Use*: Track pullback persistence; extended pullbacks (10+ triangles) often precede strong reversals
#### Event-Based Signals
**Trend Change Arrows** (Optional, toggle in settings)
- 🔴 **Red Arrow Down** → Pullback initiation detected
- 🟢 **Green Arrow Up** → Recovery confirmed; new high established
*Professional Use*: Entry/exit timing markers; green arrows indicate trend resumption
#### Critical Alert Signals
**Divergence Warning**
- ❌ **Red X (Cross)** → Bearish divergence identified
*Scenario*: One asset makes new high while other remains in pullback
*Action*: Exercise caution; consider profit-taking or tightening stops
**Bullish Confirmation**
- 💎 **Green Diamond** → Coordinated recovery signal
*Scenario*: Both assets exit pullbacks simultaneously
*Action*: High-probability long entry zone; strong market agreement
#### Background Visualization
**Red Background Tint**
- Light red overlay when **both assets in pullback**
- Provides at-a-glance market condition awareness
- Signals elevated risk environment
---
## 📈 Professional Trading Strategies
### Strategy 1: Conservative Trend Following
**Risk Profile**: Low | **Recommended For**: Risk-averse participants, capital preservation focus
**Execution Protocol**:
1. **Entry Criteria**: Status displays **"✓ BULLISH"**; both assets trending
2. **Position Management**: Maintain exposure during bullish status
3. **Exit Trigger**: Status changes to **"⚠️ BOTH PULLBACK"**; initiate defensive positioning
4. **Re-Entry Signal**: Green diamond (bullish confirmation) after correction
5. **Risk Management**: Stop-loss below recent swing low
**Expected Characteristics**: Lower frequency trades, higher win rate, reduced drawdowns
---
### Strategy 2: Pullback Accumulation
**Risk Profile**: Medium | **Recommended For**: Swing traders, value-oriented entries
**Execution Protocol**:
1. **Setup Identification**: Single-asset pullback (**"⚠️ BTC"** or **"⚠️ ETH"**)
2. **Entry Zone**: Pullback reaches 5-7% (monitor info label)
3. **Confirmation**: Other asset remains in uptrend (divergence absent)
4. **Stop-Loss Placement**: Below pullback low with 1-2% buffer
5. **Exit Strategy**: Green arrow (recovery) or status returns to bullish
**Expected Characteristics**: Higher frequency, requires active monitoring, medium holding period
---
### Strategy 3: Divergence-Based Risk Management
**Risk Profile**: Medium-High | **Recommended For**: Advanced practitioners, short-term traders
**Execution Protocol**:
1. **Alert Trigger**: Red X (bearish divergence) appears
2. **Assessment**: Verify one asset making new highs while other in pullback
3. **Initial Action**: Reduce position size by 30-50% or tighten trailing stops
4. **Monitoring**: Watch for dual-asset pullback confirmation
5. **Re-Entry**: Green diamond signal after both assets correct and recover
**Expected Characteristics**: Defensive positioning, capital preservation during uncertainty
---
### Strategy 4: Institutional Accumulation
**Risk Profile**: Low (Long-Term) | **Recommended For**: Portfolio managers, HODLers, DCA strategies
**Execution Protocol**:
1. **Trigger**: **"⚠️ BOTH PULLBACK"** status + red background
2. **Accumulation Method**: Scale into position as pullback deepens
- 25% position at 5% pullback
- 25% position at 7% pullback
- 50% position at 10%+ pullback
3. **Confirmation Wait**: Green diamond (coordinated recovery)
4. **Hold Strategy**: Maintain through subsequent minor pullbacks
**Expected Characteristics**: Low frequency, high conviction entries, long holding periods
---
## 🔔 Alert Configuration Best Practices
### Recommended Alert Setup
**Critical Alerts** (Enable immediately):
1. ✅ **"Both in Pullback"** → Market-wide correction notification
2. ✅ **"Bearish Divergence"** → Correlation breakdown warning
3. ✅ **"Bullish Confirmation"** → High-confidence entry signal
4. ✅ **"Deep Pullback Alert"** → Threshold: 10% for significant moves
**Optional Alerts** (Based on trading style):
5. ☐ **"BTC Recovery"** → May generate frequent notifications
6. ☐ **"ETH Recovery"** → May generate frequent notifications
### Alert Configuration Parameters
**TradingView Alert Settings**:
- **Trigger Frequency**: "Once Per Bar Close" (recommended to avoid intrabar noise)
- **Expiration**: "Open-ended" (continuous monitoring)
- **Notification Methods**:
- Mobile push notifications (time-sensitive signals)
- Email (detailed records)
- SMS (critical alerts only due to volume)
---
## ⚙️ Parameter Optimization by Trading Style
### Swing Traders (Recommended Primary Use Case)
**Profile**: Multi-day to multi-week holding periods
**Optimal Settings**:
- **Timeframe**: Daily (1D)
- **Min % Move**: 5-7%
- **Alert Threshold**: 8-10%
- **Check Frequency**: Once daily post-market close
- **Visual Options**: Divergence alerts + Info label (minimal clutter)
---
### Position Traders / Long-Term Investors
**Profile**: Weeks to months holding periods
**Optimal Settings**:
- **Timeframe**: Daily (1D) or Weekly (1W)
- **Min % Move**: 7-10%
- **Alert Threshold**: 12-15%
- **Check Frequency**: 2-3 times weekly
- **Visual Options**: Status label only (macro view)
---
### High-Volatility Environments
**Market Condition**: Elevated realized volatility, choppy price action
**Optimal Settings**:
- **Min % Move**: Increase to 8-10%
- **Alert Threshold**: 12-15%
- **Rationale**: Reduces noise and false signals during turbulent periods
---
### Low-Volatility Environments
**Market Condition**: Consolidation, narrow ranges, low realized volatility
**Optimal Settings**:
- **Min % Move**: Decrease to 3-5%
- **Alert Threshold**: 7-8%
- **Rationale**: Captures smaller structural movements during quiet periods
---
## 🔧 Advanced Configuration
### Custom Symbol Implementation
**Major Exchange Pairs**:
```
Bitcoin Options:
- COINBASE:BTCUSD (US-based, high liquidity)
- BINANCE:BTCUSDT (global volume leader)
- BITSTAMP:BTCUSD (established exchange)
Ethereum Options:
- COINBASE:ETHUSD (US-based, high liquidity)
- BINANCE:ETHUSDT (global volume leader)
- BITSTAMP:ETHUSD (established exchange)
```
**Alternative Cryptocurrency Pairs**:
While designed for BTC/ETH, experimental configurations possible:
- **Large Cap Altcoins**: SOLUSD + ADAUSD (sector analysis)
- **DeFi Leaders**: AVAXUSD + MATICUSD (ecosystem tracking)
⚠️ **Important**: Dow Theory principles work optimally with dominant market leaders (BTC/ETH). Alternative pairs may produce less reliable signals.
---
## 🛠️ Troubleshooting Guide
### Issue: Excessive Signal Generation
**Symptoms**: Constant triangle markers, frequent alerts
**Root Cause**: Threshold too sensitive for current volatility
**Solution**: Increase "Min % Move" to 7-10%
**Verification**: Observe reduction in signal frequency while maintaining major moves
---
### Issue: Missed Significant Moves
**Symptoms**: No triangles during visible corrections
**Root Cause**: Threshold too conservative
**Solution**: Decrease "Min % Move" to 3-5%
**Verification**: Triangles appear during moderate retracements
---
### Issue: Labels Obscured or Invisible
**Symptoms**: Cannot see status or info labels
**Diagnostic Checklist**:
- Zoom level: Zoom out to reveal off-screen labels
- Settings: Verify "Show Info Label" is enabled
- Overlap: Check for other indicators obscuring labels
- Position: Labels placed 3 bars left of current price to prevent cutoff
**Solution**: Adjust chart zoom or disable overlapping indicators
---
### Issue: Persistent Red Background
**Symptoms**: Continuous red tinting despite apparent uptrend
**Root Cause**: One or both assets technically in pullback per threshold
**Solution**: Verify pullback percentages in info label; increase threshold if false positive
**Note**: Red background requires BOTH assets in pullback simultaneously
---
### Issue: No Triangles Displayed
**Diagnostic Checklist**:
- Verify "Show Pullback Triangles" enabled in Visual Options
- Confirm market not in extended uptrend (no pullbacks detected)
- Check threshold isn't too high (increase sensitivity)
---
### Issue: Divergence Signals Absent
**Solution**: Enable "Show Divergence Alerts" in Visual Options
**Note**: Divergence signals relatively rare; indicate significant correlation breakdowns
---
## 💡 Professional Trading Insights
### 1. Volume Confluence Analysis
**Integration Strategy**:
- Overlay volume indicator below price chart
- **Pullback + Low Volume** → Healthy correction within uptrend (bullish)
- **Pullback + High Volume** → Potential distribution or reversal (bearish)
- **Recovery + High Volume** → Strong accumulation confirmation (bullish)
**Application**: Validate indicator signals with volume context for higher-confidence trades
---
### 2. Multi-Timeframe Validation
**Hierarchical Analysis**:
- **Weekly (1W)**: Primary trend direction (strategic bias)
- **Daily (1D)**: Indicator signals (tactical execution)
- **4-Hour (4H)**: Precise entry timing within daily signals
**Protocol**: Ensure daily signals align with weekly trend; use 4H for entry refinement
---
### 3. Risk Management Framework
**Position Sizing Guidelines**:
- **Maximum Risk**: 2% account equity per position
- **Stop-Loss Placement**: Below pullback low + 1-2% buffer
- **Position Scaling**:
- Initial entry: 50% intended size
- Add 25% on confirmation (green arrow)
- Final 25% on bullish confirmation (green diamond)
**Capital Preservation**:
- Reduce exposure 50% on "BOTH PULLBACK" status
- Tighten stops to breakeven on bearish divergence (red X)
- Scale out 30% of position at predetermined profit targets
---
### 4. Macro Context Integration
**External Factors to Monitor**:
- **Total Crypto Market Capitalization**: Validate broad market alignment
- **Bitcoin Dominance**: Rising = BTC outperformance; Falling = altcoin season
- **Macro Events**: FOMC meetings, regulatory announcements, geopolitical developments
- **On-Chain Metrics**: Network activity, exchange flows (advanced)
**Application**: Indicator signals most reliable when macro context supports directional bias
---
### 5. Correlation Dynamics
**Healthy Market Characteristics**:
- ✅ Strong positive correlation (BTC and ETH move together)
- ✅ Coordinated recoveries (green diamond frequent)
- ✅ Simultaneous pullbacks of similar magnitude
**Warning Signs**:
- ⚠️ Frequent divergences (red X signals)
- ⚠️ Opposite directional moves
- ⚠️ One asset perpetually lagging
**Interpretation**: Strong correlation = stable bull market; Weak correlation = uncertainty, choppy conditions
---
## ✅ Best Practices Checklist
### DO:
- ✅ Primarily use daily timeframe for reliable signal generation
- ✅ Wait for confirmation signals (green diamond) before aggressive positioning
- ✅ Adjust threshold parameters based on prevailing volatility regime
- ✅ Configure alerts for critical signals (both pullback, divergence, confirmation)
- ✅ Combine indicator signals with volume analysis and macro context
- ✅ Maintain detailed trading journal to track signal accuracy and performance
- ✅ Backtest historical signals to understand indicator behavior in your market
- ✅ Scale position sizes proportionally to signal strength
### DO NOT:
- ❌ Apply to very short timeframes (<4H) where noise dominates signal
- ❌ Ignore "BOTH PULLBACK" warnings (market-wide risk elevation)
- ❌ Trade counter to primary trend without exceptional confirmation
- ❌ Rely exclusively on this indicator; use as part of comprehensive methodology
- ❌ Overtrade based on every minor signal; exercise discretion
- ❌ Neglect threshold adjustments during volatility regime changes
- ❌ Enter positions during bearish divergence without additional confirmation
- ❌ Exceed predetermined risk parameters based on signal enthusiasm
---
## 📚 Dow Theory Educational Context
### Core Principles Implemented
**1. Trend Persistence Doctrine**
*"The trend is assumed to continue until a definitive reversal signal occurs"*
**Implementation**: Indicator tracks absolute highest high for each asset, maintaining trend assumption until threshold breach (5%+ pullback)
---
**2. Significant Movement Threshold**
*"Minor fluctuations are noise; significant moves indicate structural change"*
**Implementation**: Configurable percentage threshold (default 5%) filters noise, identifying meaningful secondary reactions
---
**3. Confirmation Principle**
*"Market indices must confirm each other for signal validity"*
**Implementation**: Dual-asset tracking; highest confidence signals require BTC and ETH agreement (both bullish or both in pullback)
---
**4. Secondary Reactions Within Primary Trend**
*"Corrections within trends are natural and present opportunity"*
**Implementation**: Pullback detection maintains context of primary trend; triangles mark secondary reactions, not reversals
---
### Dow Theory Concepts Not Directly Implemented
**Volume Confirmation** (Dow's Three Phases)
- *Rationale*: Volume analysis requires separate indicator for comprehensive assessment
- *Recommendation*: Overlay volume indicator alongside this tool
**Three-Phase Market Cycle** (Accumulation-Distribution Framework)
- *Rationale*: Phase identification requires subjective analysis beyond pure price action
- *Recommendation*: Manual identification using indicator signals as supporting evidence
**Line Analysis** (Support/Resistance)
- *Rationale*: Optional in settings; trader discretion preferred for level identification
- *Recommendation*: Enable S/R lines when conducting detailed structural analysis
---
## 📞 Support Resources
### Technical Assistance
**For indicator-specific questions**:
- Platform: TradingView direct messaging
- Response Time: 24-48 hours
- Required Information:
- Chart screenshot
- Settings configuration
- Specific issue description
### Institutional Inquiries
**For enterprise deployment or custom development**:
- Website: (cryptoexponentials.com)
- Services: Custom indicator development, integration support, training
### Community Resources
**For general discussion and shared insights**:
- Test indicator on historical data before live trading
- Document edge cases and unusual behavior
- Share settings optimizations for specific market conditions
---
## 📝 Version Information
### Current Release: v1.0
**Feature Set**:
- Dual-asset (BTC/ETH) tracking with real-time synchronization
- Divergence detection and alert system
- Customizable pullback thresholds (volatility adaptation)
- Six distinct alert conditions
- Comprehensive visual framework with toggleable elements
- Professional interface optimized for minimal chart clutter
**Planned Enhancements** (Future Versions):
- Additional cryptocurrency pair support
- Volume-based signal confirmation
- Advanced divergence pattern library
- Custom alert message templates
- Historical signal performance metrics
- Multi-timeframe coordinated analysis
---
## 🎯 Closing Remarks
### Philosophy
The Crypto Dow Theory indicator is engineered as a **decision support tool**, not an autonomous trading system. Optimal results require:
1. **Comprehensive Market Understanding**: Technical signals within fundamental context
2. **Disciplined Risk Management**: Predetermined rules consistently applied
3. **Patient Signal Selection**: Quality over quantity; await high-probability setups
4. **Continuous Learning**: Document trades, analyze outcomes, refine approach
### Success Factors
**Highest-Probability Trades Exhibit**:
- ✅ Dual-asset confirmation (both agree on direction)
- ✅ Volume supporting the move (separate analysis)
- ✅ Alignment with weekly trend (higher timeframe confluence)
- ✅ Favorable risk/reward ratio (>2:1 minimum)
- ✅ Supportive macro environment (regulatory/economic context)
### Risk Acknowledgment
- This tool provides technical analysis, **not financial advice**
- All trading involves substantial risk of capital loss
- Past signal performance does not guarantee future accuracy
- Users are solely responsible for trading decisions and outcomes
- Always conduct independent research and consult qualified professionals
---
## 📧 Contact & Feedback
Your feedback drives continuous improvement. Please share:
- Feature requests and enhancement ideas
- Bug reports with detailed reproduction steps
- Settings optimizations for specific market conditions
- Success stories and lessons learned
**Thank you for choosing Crypto Exponentials technical analysis tools.**
**Trade with discipline. Manage risk religiously. Compound knowledge consistently.**
---
*© Crypto Exponentials | Professional Technical Analysis Solutions*
*Website: (cryptoexponentials.com)*
---
**Disclaimer**: This indicator is provided for educational and analytical purposes. The creator assumes no liability for financial losses. Cryptocurrency trading involves substantial risk. Never invest more than you can afford to lose. Always perform independent due diligence before making investment decisions.

Rolling Correlation BTC vs Hedge AssetsRolling Correlation BTC vs Hedge Assets
Overview
This indicator calculates and plots the rolling correlation between Bitcoin (BTC) returns and several key hedge assets:
• XAUUSD (Gold)
• EURUSD (proxy for DXY, U.S. Dollar Index)
• VIX (Volatility Index)
• TLT (20y U.S. Treasury Bonds ETF)
By monitoring these dynamic correlations, traders can identify whether BTC is moving in sync with risk assets or decoupling as a hedge, and adjust their trading strategy accordingly.
How it works
1. Computes returns for BTC and each asset using percentage change.
2. Uses the rolling correlation function (ta.correlation) over a configurable window length (default = 12 bars).
3. Plots each correlation as a separate colored line (Gold = Yellow, EURUSD = Blue, VIX = Red, TLT = Green).
4. Adds threshold levels at +0.3 and -0.3 to help classify correlation regimes.
How to use it
• High positive correlation (> +0.3): BTC is moving together with the asset (risk-on behavior).
• Near zero (-0.3 to +0.3): BTC is showing little to no correlation — neutral/independent moves.
• Negative correlation (< -0.3): BTC is moving in the opposite direction — potential hedge opportunity.
Practical strategies:
• Watch BTC vs VIX: a spike in volatility (VIX ↑) usually coincides with BTC selling pressure.
• Track BTC vs EURUSD: stronger USD often puts downside pressure on BTC.
• Observe BTC vs Gold: during “flight to safety” events, gold rises while BTC weakens.
• Monitor BTC vs TLT: rising yields (falling TLT) often align with BTC weakness.
Inputs
• Window Length (bars): Number of bars used to calculate rolling correlations (default = 12).
• Comparison Timeframe: Default = 5m. Can be changed to align with your intraday or swing trading style.
Notes
• Works best on intraday charts (1m, 5m, 15m) for scalping and short-term setups.
• Use correlations as context, not standalone signals — combine with volume, VWAP, and price action.
• Correlations are dynamic; they can switch regimes quickly during macro events (CPI, NFP, FOMC).
This tool is designed for traders who want to manage risk exposure by monitoring whether BTC is behaving as a risk-on asset or hedge, and to exploit opportunities during decoupling phases.

Cash And Carry Arbitrage BTC Compare Month 6 by SeoNo1Detailed Explanation of the BTC Cash and Carry Arbitrage Script
Script Title: BTC Cash And Carry Arbitrage Month 6 by SeoNo1
Short Title: BTC C&C ABT Month 6
Version: Pine Script v5
Overlay: True (The indicators are plotted directly on the price chart)
Purpose of the Script
This script is designed to help traders analyze and track arbitrage opportunities between the spot market and futures market for Bitcoin (BTC). Specifically, it calculates the spread and Annual Percentage Yield (APY) from a cash-and-carry arbitrage strategy until a specific expiry date (in this case, June 27, 2025).
The strategy helps identify profitable opportunities when the futures price of BTC is higher than the spot price. Traders can then buy BTC in the spot market and short BTC futures contracts to lock in a risk-free profit.
1. Input Settings
Spot Symbol: The real-time BTC spot price from Binance (BTCUSDT).
Futures Symbol: The BTC futures contract that expires in June 2025 (BTCUSDM2025).
Expiry Date: The expiration date of the futures contract, set to June 27, 2025.
These inputs allow users to adjust the symbols or expiry date according to their trading needs.
2. Price Data Retrieval
Spot Price: Fetches the latest closing price of BTC from the spot market.
Futures Price: Fetches the latest closing price of BTC futures.
Spread: The difference between the futures price and the spot price (futures_price - spot_price).
The spread indicates how much higher (or lower) the futures price is compared to the spot market.
3. Time to Maturity (TTM) and Annual Percentage Yield (APY) Calculation
Current Date: Gets the current timestamp.
Time to Maturity (TTM): The number of days left until the futures contract expires.
APY Calculation:
Formula:
APY = ( Spread / Spot Price ) x ( 365 / TTM Days ) x 100
This represents the annualized return from holding a cash-and-carry arbitrage position if the trader buys BTC at the spot price and sells BTC futures.
4. Display Information Table on the Chart
A table is created on the chart's top-right corner showing the following data:
Metric: Labels such as Spread and APY
Value: Displays the calculated spread and APY
The table automatically updates at the latest bar to display the most recent data.
5. Alert Condition
This sets an alert condition that triggers every time the script runs.
In practice, users can modify this alert to trigger based on specific conditions (e.g., APY exceeds a threshold).
6. Plotting the APY and Spread
APY Plot: Displays the annualized yield as a blue line on the chart.
Spread Plot: Visualizes the futures-spot spread as a red line.
This helps traders quickly identify arbitrage opportunities when the spread or APY reaches desirable levels.
How to Use the Script
Monitor Arbitrage Opportunities:
A positive spread indicates a potential cash-and-carry arbitrage opportunity.
The larger the APY, the more profitable the arbitrage opportunity could be.
Timing Trades:
Execute a buy on the BTC spot market and simultaneously sell BTC futures when the APY is attractive.
Close both positions upon futures contract expiry to realize profits.
Risk Management:
Ensure you have sufficient margin to hold both positions until expiry.
Monitor funding rates and volatility, which could affect returns.
Conclusion
This script is an essential tool for traders looking to exploit price discrepancies between the BTC spot market and futures market through a cash-and-carry arbitrage strategy. It provides real-time data on spreads, annualized returns (APY), and visual alerts, helping traders make informed decisions and maximize their profit potential.

Arbitrage Sniper (POC)Good Morning Traders!
Today I want to share with you the proof-of-concept of how you would be able to do arbitrage with crypto pairs.
THE INDICATOR MUST BE PLACED ON THE TRADING PAIR OF THE TWO CURRENCIES (i.e. ETH/BTC, EOS/ETH etc.)
This arbitrage method is based on the transitional decorrelation between the crypto treding pair and the price ratio of the involved currencies, of course computing commissions as well.
Whenever the non-arbitrage condition is not respected, there is an arbitrage oportunity.
This indicator won't consider the chance of shorting, so if the arbitrage oportunity occurs the indicator will suggest you just the chance of buying the relative-undervalued currency (but inside the code you will know how to do the alternative method as well, by shorting the relative-overvalued currency)
Let's take the trading pair ETH/BTC (as in the graph) → if we assume commissions for the 0.075% of the order, the non-arbitrage condition will be presented like this
This arbitrage method will need three orders, so n=3
So let's assume that P(ETH)/(P(BTC)*P(ETH/BTC))>(1-0.075)^(-3) → it means that the price of Ethereum is currently overreated enough (relatively to the trading pair) for doing arbitrage.
We have two alternatives:
• Buy BTC, change it into ETH (by "buying" ETH in the trading pair ETH/BTC) and then sell ETH
• Sell ETH, buy BTC, change it into ETH (by "buying" ETH in the trading pair ETH/BTC)
On the other hand, if P(ETH)/(P(BTC)*P(ETH/BTC))<(1-0.075)^(-3) → it means that the price of Ethereum is currently underrared enough (relatively to the trading pair) for doing arbitrage.
We have two alternatives:
• Buy ETH, change it into BTC (by "selling" ETH in the trading pair ETH/BTC) and then sell BTC
• Sell BTC, buy ETH, change it into BTC (by "selling" ETH in the trading pair ETH/BTC)
I'm saying that is nothing more than a proof-of-concept since:
- Arbitrage Oportunities will emerge frequently just nearly zero commissions
- Data of prices are retrieved using security() function and there can be some delay (so the arbitrage oportunity will be already extinguished by the time the signal is retrieved)
- In order to have the freshest data, repiainting will occurr

Sveezy BTC Level SyncThis indicator lets you define up to 5 key Bitcoin price levels (support or resistance zones). Whenever BTC “touches” (crosses up) one of those levels on your chosen exchange, the script records the exact bar, then on any non-BTC chart it draws a dashed horizontal line at that asset’s price at the same moment in time. You can optionally display a plain-text BTC-level label, right-justified a configurable number of bars to the right of each line.
Features:
- 5 user-defined BTC levels via separate inputs
- Time-synced across symbols: marks altcoin price on the exact bar BTC hit the level
- Most recent touch only: lines update when BTC crosses the same level again
- Right-justified labels: plain text (no box) showing the BTC level, offset by bars & ticks
- Lightweight: uses only built-in line and label primitives, no heavy loops
How to Use:
- Open any altcoin chart (ETH, SOL, your token).
- Add the indicator from Pine Editor (paste and save).
- Enter your BTC symbol and up to 5 levels.
- Enable labels if desired; adjust offsets.
- Watch dashed lines plot at your alt’s price every time BTC crosses a level.
Ideal For:
- Pair traders who want to sync entries/exits to BTC key levels
- Arbitrageurs scanning multiple alt charts for BTC-driven swings
- Anyone wishing to visualize how alts responded at specific BTC prices
Feel free to fork and customize further (cross-down detection, color schemes, multi-timeframe support). If you find it helpful, drop a comment or upvote!
Asset Corr. with BTC/USD (Macroeconomics X BTC)This indicator provides a comprehensive analysis of the correlation between multiple assets (DXY, Gold, S&P 500, US10Y, and USDT Dominance) and their potential impact on the BTC/USD price. The script calculates the 24-hour percentage variation of these assets, determines their direction (bullish, bearish, or neutral), and displays this information in a table, helping traders assess how each asset is influencing BTC.
How the Script Works:
Asset Monitoring:
The script tracks the following assets:
DXY: The U.S. Dollar Index.
Gold (XAUUSD): The price of gold in U.S. dollars.
S&P 500 (SP500): A stock market index of U.S. companies.
US10Y: U.S. 10-year treasury yield.
USDT Dominance (USDT.D): The market dominance of USDT (Tether) in the crypto market.
Variation Calculation:
The script calculates the percentage variation for each asset over the last 24 hours using the close price of the previous day and the current close price on the 5-minute chart.
Based on the variation, the script determines the direction of each asset:
Bullish (1): Positive variation.
Bearish (-1): Negative variation.
Neutral (0): No significant change.
Impact Assessment:
The script uses weighted values for each asset to calculate its potential impact on BTC. The assets are given different weights:
DXY = 3
Gold = 2
S&P 500 = 2
US10Y = 3
USDT.D = 3
The direction and correlation of each asset are assessed to determine whether they are having a positive or negative impact on BTC. This impact is represented by arrows in the table.
Table Display:
The script displays a table on the chart, providing detailed information for each asset:
Asset: The name of the asset being analyzed.
Weight (Wgt): The assigned weight of the asset.
Direction (Dir): The current direction of the asset (up, down, or neutral).
24h Variation (Var %): The percentage change of the asset over the last 24 hours.
BTC Impact: The predicted impact of each asset on BTC, based on its direction and correlation.
Dominance Calculation:
A final "Dominance" score is calculated by summing the weighted values of each asset's direction and correlation with BTC.
This result is displayed in the table, providing a clear indication of whether the overall market sentiment is bullish or bearish for BTC.
How to Use the Script:
Add the Indicator: Apply the script to any chart with a 5-minute timeframe. The indicator works by analyzing the correlation of multiple assets with BTC, so it is best used for short-term traders looking to gauge BTC's price movement based on broader market trends.
Interpret the Table: The table shows the direction, variation, and impact of each asset on BTC. The "Dominance" row at the end of the table provides an overall sentiment score, helping traders understand whether the broader market is leaning bullish or bearish on BTC.
Monitor the Correlation: By tracking the assets with the highest weights and monitoring their influence on BTC, traders can make informed decisions on potential BTC price movements.
Key Concepts:
Asset Correlation: The script monitors multiple key assets that typically influence BTC's price, including the U.S. Dollar Index, Gold, S&P 500, US10Y, and USDT Dominance.
Impact Assessment: Uses weighted calculations to assess how each asset’s direction affects BTC.
Dominance Score: Provides a summary score of overall market sentiment, helping traders understand the broader influence on BTC.
Short-Term Trading: This tool is optimized for short-term traders who want to gauge market sentiment and its effect on BTC in real time.
For a better view of the table, right-click on >> visual order >> bring it to the top.

Aggregate BTC Volume Spot - Ma78erAggregate BTC Volume indicator show aggregates trading volumes of Bitcoin from multiple trading platforms.
Exchange Include:
1: Binance - BTC(USDT, USDC, FDUSD, TUSD)
2: Coinbase - BTC(USD, EUR, USDT, GBP)
3: OKX - BTC(USDT, USDC)
4: BYBIT - BTC(USDT, USDC)
5: KUCOIN - BTC(USDT, USDC)
6: KRAKEN - BTC(USD, EUR, USDT, GBP, USDC)
7: Bitfinex - BTC(USD, EUR, GBP)
8: Bitstamp - BTC(USD, EUR, USDT, GBP, USDC)
9: GATEIO - BTC(USDT)
You can also add other exchange in script manually.
USDT Premium Rate RTA-V1.0USDT Premium Rate 来自RTA学院,公开指标。
USDT Premium Rate 中文名:USDT溢价率指标
该专门用于分析场内BTC市场USDT溢价率情况。
当 BTCUSD>BTCUSDT 则 USDT场内正溢价
当 BTCUSDBTCUSDT,因为BTC是自由流通的,所以意味着USDT>USD 正溢价(摘自赵老板)
因此得出以下结论
USD交易所大量买入BTC会导致USDT场内正溢价
USD交易所大量卖出BTC会导致USDT场内负溢价
USDT交易所大量买入BTC会导致USDT场内负溢价
USDT交易所大量卖出BTC会导致USDT场内正溢价
该指标需结合RTA课程使用。
BTCUSD现货指数包含
Coinbase
Bitstamp
Karken
Gemini
Bittrex
BTCUSDT现货指数包含
Binance
OKEX
Huobi
Bittrex
-------------------------------------------------
USDT Premium Rate published by RTA , public indicators.
When BTCUSD>BTCUSDT, the USDT premium rate is positive in exchange.
When BTCUSD

Other altcoins BTC capitalization histogram [peregringlk]Introduction
==========
This study is intented to be used in combination with my other study "Other alts compensated cap". Read its description, in particular, it's rationale, to understand why I have removed the big capitalized altcoins from these studies.
The middle indicator in the image is that other study, while the indicator in the buttom of the image is that one.
It shows, in form of histogram, the BTC capitalization change rate (per candle, using closes) of the "OTHERS" altcoins together with the inverse of the BTCUSD price change rate per candle.
NOTE: I call the change rate to the multiplier factor of price from bar to bar. For example, a change rate of 1.20 means +20% respect to "yesterday", and a change rate of 0.80 means -20%.
The idea is to know what are altcoin markets (against BTC) doing after each BTC price change.
Definitions
=========
I will use ALT from now one as the name of an index or fictional coin that represents the average price of all other altcoins combined. I'll use then ALTUSD to represent the price against USD of such fictional coin (= the OTHERS capitalization, as if the USD capitalization of altcoins were the USD price of ALT), and ALTBTC to represent the same price but against BTC (calculated by taking ALTUSD/BITSTAMP:BTCUSD; the choosing of BITSTAMP is because it's the market with a longer history in tradingview).
Since I use the "OTHERS" security, I cannot know the real altcoin index so I can only estimate by using the capitalization. CIX100 could be a solution, but it is too recent in time as to inspect past price actions.
Description
=========
For example, let's assume BTCUSD decreases by 20% today. It would cause a fall in ALTUSD of 20% (just maths). So, what should it happen in ALTBTC to preserve the original ALTUSD price? People should buy alts in BTC markets by a factor of 1/0.8 = 1.25. Or in other words, unless there are a +25% grow in ALTBTC, ALTUSD would see a decrease in value.
This is what the histogram shows. The red columns shows the ALTBTC change rate per candle, while each green column shows what is the required change rate in ALTBTC required to preserve its ALTUSD value (capitalization). In other words, the green columns are the "targets" to preserve USD capitalization in ALTBTC, while the red histogram shows the actual changes.
Also, it shows two curves. There are just the change rate accumulation during some customizable interval (the same for both lines, and 7 by default; or the "week" for daily candles).
The green line is the accumulated "target" change rate within that period of time (the accumulated product of the last `interval` change rates), and the red line is the actual change rate for the same `interval` candles.
Interpretation
============
If red column values are bigger than the green ones (green column is negative, and red column is positive; or both are positives but the red one "put outs", or both are negative but the red column doesn't "put out"), OTHERS USD capitalization has increased.
If red column values are lower than the green ones (green column is positive and red column is negative; or both are positives but the red one doesn't "put out"; or both are negative but the red column "put outs"), OTHERS USD capitalization has decreased.
The same for the continuous lines: if the red line is above the green one, OTHERS USD capitalization has increased during "the past week". Otherwise, it has decreased.
The added value of this indicator is that it allows you to know "why". For example, if a green column is positive, and its corresponding red column is positive as well, but below the green one, the capitalization has decreased but BECAUSE the btc price has fallen, not because there was a sellof in alts. Actually, there was some buys (the ALTBTC price increased); it just it was not enough to counteract the btc fall.
That can be clearly seen in the remarked candle in the plot, the "coronavirus" sellof. The BTCUSD fall was huge (the hugest in BTC history), and the green column is telling you that to preserve the capitalization a lot of buys were required. However, that didn't happen. Actually, the OTHER alts were pretty quiet (the red column is tiny), causing a massive indirect loss of capitalization.
Also, with the curves, you can know if there was a total gainning or loss of capitalization during the past few days or candles. Also you can try to spot the beginning of alts seasons by crosses between red and green lines: if the red lines crosses above the green one (because there was a continuous sequence of red columns above green ones), it means that, potentially, were are at the beginning of an alt season because people are accumulating.
Table of cases
===========
- if the green column is positive (BTCUSD is down)
- if the red column is positive (ALTBTC is up)
- bigger than the green column: ALTBTC buys are stronger than required by arbitrage and have counteracted and overcome the BTC fall.
- shorter than the green column: there have been some buys but not enough, so the BTCUSD fall has not been fully counteracted.
- if the red column is negative (ALTBTC is down): the loss is double: BTCUSD have lost value + ALTBTC is bleeding.
- If the green column is negative (BTCUSD is up)
- if the red column is negative (ALTBTC is down)
- bigger than the green column: ALTBTC sells are so strong that have counteracted the BTC increase in value, causing a loss of USD value.
- shorter than the green column: there have been sells but overall the ALTUSD price has increased.
- if the red column is positive (ALTBTC is up): the gain is double: BTCUSD has gain value + ALTBTC is also growing.
WeTrade. Trend Alerts 2.0
Данные сигналы были созданы для понимания начала и разворота тренда. Не забывайте правило: The trend is your friend. Стрелки НЕ ПЕРЕРИСОВЫВАЮТСЯ. Как и большинство индикаторов, данный нуждается в поддержке тех. анализом и строгом алгоритме торговле. Используется для маржинальной торговли на криптовалютных парах BTC/USD, ETH/BTC 5.24% , ADA/BTC, BCH/BTC, LTC/BTC, а так же на валютных парах EUR/USD, GBP/USD. НЕ (!) используйте индикатор на инструментах, в которых идёт жёсткий флэт и сильные pump and dump. Такие монеты были созданы не для движения по тренду! А для использования робота и накачки!
Торговля по системе идёт со строгим управлением капиталом.
Советую использовать стратегию Мартингейла. Увеличивать позиции не более чем на 40%. С кредитным плечом до X10. Контролируйте свои риски. В этом главный успех.
Всем большого дохода!
------------------------------------------------------------------------------------------------------------------------------------
This alerts is created to understand the beginning and the reversal of the trend. Do not forget the rule: The trend is your friend. The arrows do not re-painting! Like most indicators, this one needs the support of technical analysis and strict algorithm of trade. Used for margin trading on BTC 0.97% / USD, ETH / BTC 0.97% , ADA / BTC 0.97% , BCH / BTC 0.97% , LTC / BTC 0.97% , and also in currency pairs like EUR/USD -0.05% , GBP/USD 0.10% . DO NOT (!) Use the indicator on tools, in which there is a rigid flat and strong pump and dump. Such coins were not created for movement on the trend! They are created for using a robot and pumping!
Trade in the system goes with strict management of capital.
Write comments, I will answer your questions.
Thank you.

Basis & APR Table [BTC/ETH]Basis & APR Table
BTC, ETH의 선물 가격과 현물 가격의 차이(베이시스) 그리고 그 차이를 **연 환산 수익률(APR)**로 바꿔서 보여주는 표야.
두 개의 선물 만기(예: 12/26, 03/27)를 동시에 보면서 어떤 만기가 더 매력적인지 비교할 수 있게 만든 거라고 보면 돼.
컬럼별 설명
종목명
코인 이름 (BTC, ETH).
1226 (18일 남음)
12월 26일에 만기되는 선물 가격.
뒤에 적힌 “18일 남음”은 그 만기까지 남은 날짜 수.
갭-1
1226 선물이 현재 현물 가격보다 몇 퍼센트 비싸거나 싼지를 나타내는 값.
양수면 선물이 현물보다 비싸고, 음수면 선물이 더 싼 상태.
APR-1
갭-1을 연 수익률 기준으로 환산한 값.
지금 기준 가격 차이가, 12월 26일까지 같은 비율로 유지된다고 가정했을 때
1년 기준으로 환산하면 몇 퍼센트 수익률이 되는지 보여줌.
0327 (109일 남음)
3월 27일 만기 선물 가격.
괄호 안은 역시 그 만기까지 남은 일수.
갭-2
0327 선물의 현물 대비 가격 차이를 퍼센트로 표시한 값.
해석은 갭-1과 동일.
APR-2
갭-2를 연 수익률 기준으로 환산한 값.
3월 27일 만기까지 들고 있다고 가정했을 때의 연 환산 수익률.
현물
현재 BTC 혹은 ETH의 실제 현물 가격.
기본편비-1 / 기본편비-2
사용자가 미리 정해 둔 기준 베이시스(또는 기준 APR) 값으로 보는 게 자연스러워.
이 숫자와 비교해서
현재 APR이 이 값보다 높으면 “평소보다 베이시스가 많이 붙었다(프리미엄 큼)”
낮으면 “평소보다 베이시스가 작다(프리미엄 작음)”
정도 판단하는 용도로 쓰는 참고 기준치라고 이해하면 돼.
Basis & APR Table
This table displays the futures basis (the price difference between futures and spot) for BTC and ETH,
and converts that difference into an annualized return (APR).
You can compare two expiries (e.g., Dec 26 and Mar 27) to see which one offers a more attractive implied yield
for a basis or cash-and-carry trade.
Column details
Symbol
The asset name (BTC, ETH).
1226 (18 days left)
Futures price that expires on December 26.
“18 days left” shows how many days remain until that expiry.
Gap-1
How many percent the 1226 futures price is above or below the current spot price.
Positive = futures are more expensive than spot (premium).
Negative = futures are cheaper than spot (discount).
APR-1
The annualized return implied by Gap-1.
It tells you what the yield would be on a yearly basis if today’s price difference stayed the same
and you held the position until the Dec 26 expiry.
0327 (109 days left)
Futures price that expires on March 27.
The number in parentheses is the remaining days to that expiry.
Gap-2
Percentage premium or discount of the Mar 27 futures relative to spot.
Interpreted in the same way as Gap-1.
APR-2
Annualized return implied by Gap-2, assuming you hold the position until the Mar 27 expiry.
Spot
The current spot price of BTC or ETH.
Base Basis-1 / Base Basis-2
User-defined reference levels for the “normal” basis or APR for the near and far contracts.
They are used as benchmarks:
If the current APR is above this level, the basis is relatively rich.
If it is below, the basis is relatively cheap.

Stochastic BTC OptimizedEnhanced Stochastic for Bitcoin (BTC) – Optimized for Daily Timeframe
This enhanced Stochastic oscillator is specifically fine-tuned for BTC/USD on the 1D timeframe, leveraging historical data from Bitstamp (2011–2025) to minimize false signals and maximize reliability in Bitcoin's volatile swings.
Unlike the classic Stochastic (14, 3, 3), this version uses optimized parameters:
- K Period = 21 – smoother reaction, better suited for BTC’s macro cycles
- D Period = 3, Smooth K = 3 – reduces noise while preserving responsiveness
- Overbought = 85, Oversold = 15 – accounts for BTC’s tendency to trend strongly within extreme zones without immediate reversal
✅ Smart Signal Logic:
Buy/sell signals appear only when %K crosses %D inside the oversold (≤15) or overbought (≥85) zones, and only the first signal is shown to avoid whipsaws.
Visual Enhancements:
- Thick lines when %K/%D are in overbought/oversold zones
- Green/red background highlights on valid signals
- Optional up/down arrows for clear entry visualization
- Customizable colors, line widths, and transparency
🔒 No alerts included – clean, focused on price action and momentum.
💡 Pro Tip: For even higher accuracy, use this indicator in combination with a long-term trend filter (e.g., EMA 200). The oscillator excels in ranging or retracement phases but should not be used alone in strong parabolic moves.
Based on Mozilla Public License v2.0 – feel free to use, modify, and share. Perfect for swing traders and long-term Bitcoin analysts seeking high-probability reversal zones.
перевод на русский
Улучшенный Stochastic для Bitcoin (BTC) — оптимизирован для дневного таймфрейма
Этот улучшенный осциллятор Stochastic специально настроен под BTC/USD на дневном графике, с учётом исторических данных Bitstamp (2011–2025), чтобы минимизировать ложные сигналы и повысить надёжность в условиях высокой волатильности биткоина.
В отличие от классического Stochastic (14, 3, 3), эта версия использует оптимизированные параметры:
- Период K = 21 — более плавная реакция, лучше соответствует макроциклам BTC
- Период D = 3, Сглаживание K = 3 — снижает шум, сохраняя отзывчивость
- Уровень перекупленности = 85, перепроданности = 15 — учитывает склонность BTC к сильным трендам в экстремальных зонах без немедленного разворота
✅ Интеллектуальная логика сигналов:
Покупка/продажа отображается только при пересечении %K и %D внутри зоны перепроданности (≤15) или перекупленности (≥85), и только первый сигнал фиксируется, чтобы избежать «хлыстов».
Улучшенная визуализация:
- Жирные линии, когда %K/%D находятся в экстремальных зонах
- Зелёный/красный фон при появлении сигналов
- Опциональные стрелки для чёткого отображения точек входа
- Настройка цветов, толщины линий и прозрачности
🔒 Без алертов — чистый инструмент, сфокусированный на цене и импульсе.
💡 Совет профессионала: для ещё большей точности используйте этот индикатор вместе с трендовым фильтром (например, EMA 200). Осциллятор лучше всего работает в фазах консолидации или отката, но не стоит применять его в одиночку во время сильных параболических движений.
На основе Mozilla Public License v2.0 — свободно используйте, модифицируйте и делитесь. Идеален для свинг-трейдеров и аналитиков Bitcoin, ищущих зоны с высокой вероятностью разворота.

Dual Harmonic-based AHR DCA (Default :BTC-ETH)A panel indicator designed for dual-asset BTC/ETH DCA (Dollar Cost Averaging) decisions.
It is inspired by the Chinese community indicator "AHR999" proposed by “Jiushen”.
How to use:
Lower HM-based AHR → cheaper (potential buy zone).
Higher HM-based AHR → more expensive (potential risk zone).
Higher than Risk Threshold → consider to sell, but not suitable for DCA.
When both AHR lines are below the Risk threshold → buy the cheaper one (or split if similar).
If one AHR is above Risk → buy the other asset.
If both are above Risk → simulation shows “STOP (both risk)”.
Not limited to BTC/ETH — you can freely change symbols in the input panel
to build any dual-asset DCA pair you want (e.g., BTC/BNB, ETH/SOL, etc.).
What you’ll see:
Two lines: AHR BTC (HM) and AHR ETH (HM)
Two dashed lines: OppThreshold (green) and RiskThreshold (red)
Colored fill showing which asset is cheaper (BTC or ETH)
Buy markers:
- B = Buy BTC
- E = Buy ETH
- D = Dual (split budget)
Top-right table: prices, AHRs, thresholds, qOpp/qRisk%, simulation, P&L
Labels showing last-bar AHR values
Core idea:
Use an AHR based on Harmonic Moving Average (HM) — a ratio that measures how “cheap or expensive” price is relative to both its short-term mean and long-term trend.
The original AHR999 used SMA and was designed for BTC only.
This indicator extends it with cross-exchange percentile mapping, allowing the empirical “opportunity/risk” zones of the AHR999 (on Bitstamp) to adapt automatically to the current market pair.
The indicator derives two adaptive thresholds:
OppThreshold – opportunity zone
RiskThreshold – risk zone
These thresholds are compared with the current HM-based AHR of BTC and ETH to decide which asset is cheaper, and whether it is good to DCA or not, or considering to sell(When it in risk area).
This version uses
Display base: Binance (default: perpetual) with HM-based AHR
Percentile base: Bitstamp spot SMA-AHR (complete, stable history)
Rolling window: 2920 daily bars (~8 years) for percentile tracking
Concept summary
AHR measures the ratio of price to its long-term regression and short-term mean.
HM replaces SMA to better reflect equal-fiat-cost DCA behavior.
Cross-exchange percentile mapping (Bitstamp → Binance) keeps thresholds consistent with the original AHR999 interpretation.
Recommended settings (1D):
DCA length (harmonic): 200
Log-regression lookback: 1825 (≈5 years)
Rolling window: 2920 (≈8 years)
Reference thresholds: 0.45 / 1.20 (AHR999 empirical priors)
Tie split tolerance (ΔAHR): 0.05
Daily budget: 15 USDT (simulation)
All display options can be toggled: table, markers, labels, etc.
Notes:
When the rolling window is filled (2920 bars by default), thresholds are first calculated and then visually backfilled as left-extended lines.
The “buy markers” and “decision table” are light simulations without fees or funding costs — for rhythm and relative analysis, not backtesting.
