Cerca negli script per "BULL"

Bull / Bear Market RegimeBull / Bear Market Regime
Instructions:
- A simple risk on or risk off indicator based on CBOE's Implied Correlation and VIX to highlight and indicate Bull / Bear Markets. To be used with the S&P500 index as that's the source from where the CBOE calculates and measures implied volatility & implied correlation. Can also be used with the other indices such as: Dow Jones, S&P 500, Nasdaq, & Nasdaq100, & Index ETF's such as DIA, SPY, QQQ, etc.
- Know the active regime, see the larger picture using the Daily or Weekly view, and visualize the current "Risk On (Bull) or Risk Off (Bear)" environment.
Description:
- Risk On and Risk Off simplified & visualized. Know if we are in a RISK ON or RISK OFF environment (Bull or Bear Market). (Absolute bottoms and tops will occur BEFORE a Risk On (Bull Market) or Risk Off (Bear Market) environment is confirmed!) This indicator is not meant to bottom tick or uptick market price action, but to show the active regime.
- Green: Bull Market, Risk On, low volatility, and low risk.
- Red: Bear Market, Risk Off, high volatility, and higher risk.
Buy & Sell Indicators (DAILY time frame)
- Nothing is 100% guaranteed! Can be used for short to medium term trades at the users discretion in BEAR MARKETS!!
- These signals are meant to be used during a RISK OFF / BEAR MARKET environment that tends to be accompanied with high volatility. A Risk on / Bull Market environment tends to have low volatility and endless rallies, so the signals will differ and in most instances not apply for Bull market / Risk on regime.
- The SELL signal will more often than not signal that a pullback is near in a BULL market and that a BMR-Bear Market Rally is almost over in a BEAR market.
- The BUY signal will have far more accuracy in a BEAR market-high volatility environment and can Identify short-term and major bottoms.
Always use proper sizing and risk management!

Bull and Bear Fear Expert by Walter Downs StrategyBull and Bear Fear Expert by Walter Downs Strategy

Bull Power Strategy Backtest Bull Power Indicator
To get more information please see "Bull And Bear Balance Indicator"
by Vadim Gimelfarb.
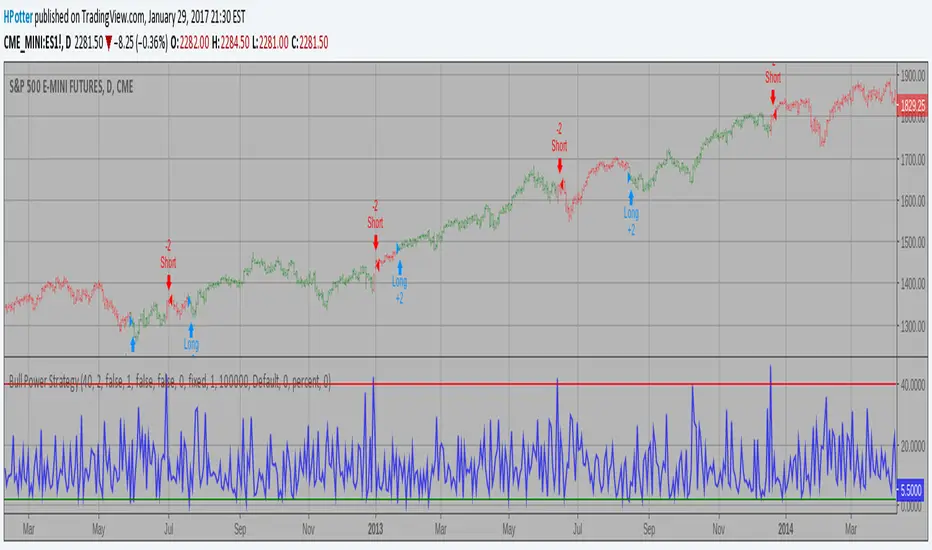
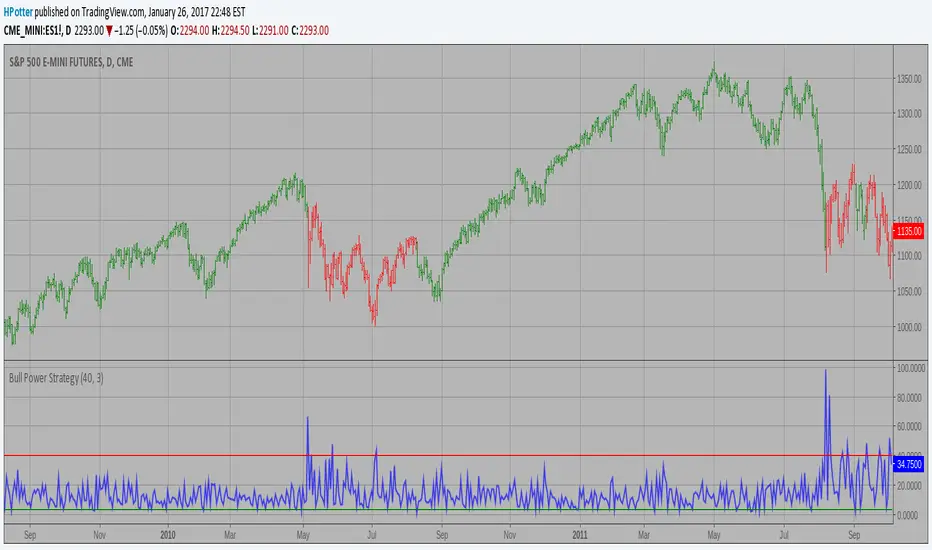
Bull Power Strategy Bull Power Indicator
To get more information please see "Bull And Bear Balance Indicator"
by Vadim Gimelfarb.
Bull And Bear Balance Indicator Hi
Let me introduce my Bull And Bear Balance Indicator script.
This new indicator analyzes the balance between bullish and
bearish sentiment.
One can cay that it is an improved analogue of Elder Ray indicator.
To get more information please see "Bull And Bear Balance Indicator"
by Vadim Gimelfarb

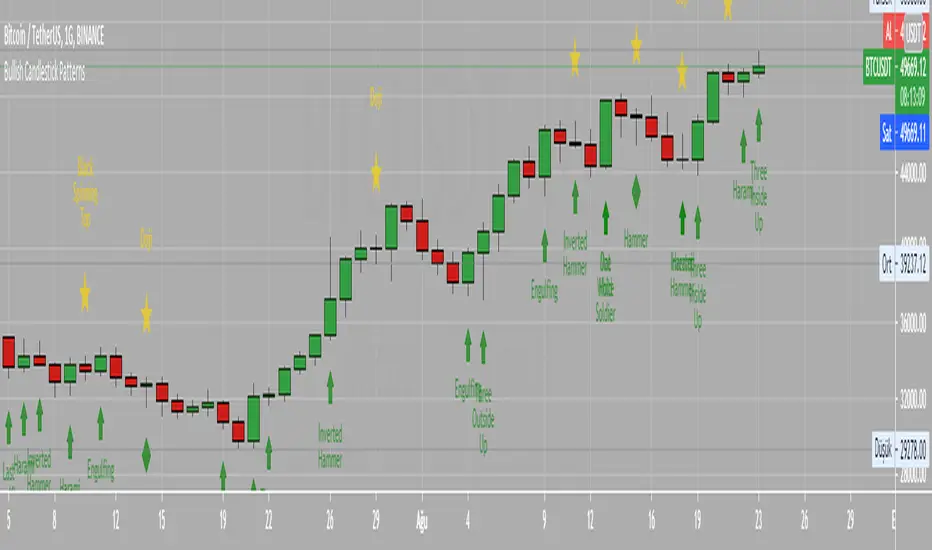
Bullish Candlestick PatternsBullish Abandone Baby
Bullish Above The Stomach
Bullish Belt Hold
Bullish Breakaway
Bullish Concealing Baby Swallow
Bullish Counterattack Lines
Bullish Deliberation Block
Bullish Descent Block
Bullish Doji Star
Bullish Downside Gap Two Rabbits
Bullish Dragonfly Doji
Bullish Engulfing
Bullish Hammer
Bullish Harami
Bullish Harami Cross
Bullish High Price Gapping Play
Bullish Homing Pigeon
Bullish Hook Reversal
Bullish Inverted Hammer
Bullish Island Reversal
Bullish Kicking
Bullish Ladder Bottom
Bullish Last Engulfing Bottom
Bullish Mat Hold
Bullish Matching Low
Bullish Meeting Line
Bullish Morning Doji Star
Bullish Morning Star
Bullish On Neck
Bullish One White Soldier
Bullish Piercing Line
Bullish Rising Three Methods
Bullish Rising Window
Bullish Separating Lines
Bullish Side by Side White Lines
Bullish Stick Sandwich
Bullish Takuri Line
Bullish Three Gap Downs
Bullish Three Inside Up
Bullish Three Line Strike
Bullish Three Outside Up
Bullish Three Stars in the South
Bullish Three White Soldiers
Bullish Thrusting Line During Uptrend
Bullish Tower Bottom
Bullish Tristar
Bullish Tweezers Bottom
Bullish Two Rabbits
Bullish Unique Three River Bottom
Bullish Upside Gap Three Methods
Bullish Upside Tasuki Gap
{Gunzo} Bulls Power vs. Bears PowerBulls Power vs. Bears Power is a unique tool that displays on each candle the balance between the bears (sellers) and the bulls (buyers).
OVERWIEW :
This indicator is mainly based on the popular indicator “Elder ray” made by Dr. Alexander Elder in 1989. This indicator has been developed in order to determine the strength of the competing groups of buyers and sellers in the markets.
CALCULATION :
To measure the competing power of bulls and bears, the indicator compares the current high (maximum power of the bulls) and current low (maximum power of the bears) to the average price using a exponential moving average.
Bull Power = Current High – EMA 13 (closing)
Bear Power = Current Low – EMA 13 (closing)
This Elder ray indicator can also tell us more information about market conditions :
If the current high and current low are above the EMA 13, the bulls are totally in control on the market
If the current high and current low are under the EMA 13, the bears are totally in control of the market
If the EMA 13 is in between of the current high and current low, there is strong fight about controlling the market, there is possible reversal in this configuration
SETTINGS :
Fast MA Period : Fast moving average period (only used for buy sell signal)
Slow MA Period : Slow moving average period (only used for buy sell signal)
Display candle labels : Show/hide candle labels on the chart
Display only bear labels above X : Exclude all top candle labels on the chart below the value specified.
Display only bull labels above X : Exclude all bottom candle labels on the chart below the value specified.
Display opposite values : Show all candle labels on top (bearish) and bottom (bullish) or only show the candle labels for the winning force on the candle.
Display box for last candle : Show/hide the dominance boxes (red and blue) after last candle showing the last bear and bull power.
Display box after X candles : How many candles in the future the dominance boxes should be displayed.
Display slow / fast crossover (o) : Display crossover signals (circles) between fast line and slow line.
Display bear / bull fighting (x) : Display fighting signals (crosses) between bull and bears.
VISUALIZATIONS :
This indicator has 3 possible complementary visualizations:
Candle labels : The labels on top are the percentage of the bears on the candle, while the labels on the bottom are the percentage of the bulls on the candle. When the bulls are winning the labels are blue, when the bears are winning the labels are red, silver otherwise.
Box after last candle : The blue and red boxes after the last candle are the percentage of bears and bulls on the last candle of the chart. That boxes can be disabled in the settings if you feel it is redundant with the labels.
Signals : The signals are displayed at the bottom of the main area of trading. The orange “x” represents an area where bulls and bears are fighting hard. The blue “o” represents a buy signal (fast line crosses over the slow line) and the red “o” represents a sell sinal (fast line crosses under the slow line).
USAGE :
The most important rule in the usage of this indicator is :
“The higher the current bull power is (or bear power), the higher the chances are the next candle will also be bullish (or bearish).”
When the prices is increasing, it is very interesting to follow the bull power to verify that it is either stable or increasing. If the bull power keeps decreasing candle after candle, there is chances that in the next candles there will be a reversal.
When there is orange crosses in the signal area (bottom of the screen), it means that there is a big fight between bulls and bears and that the current price of the asset is probably stable. During these fighting areas, reversals are more likely to happen.
When there is a blue circle in the signal area (or red signal), it can be considered as a buy signal (or sell signal). These signals are determined by the crossover of the fast and slow lines of the total power of the bulls plus the bears.
LIMITATIONS :
As Pine script only allows to display about 50 drawings on the chart, the labels on the candles can not be printed on all the historical candles. The option “Display opposites” could be useful to hide unnecessary labels and then be able to display more older labels.
As the Elder ray indicator uses an average price (EMA 13 of closing price), the indicator may be lagging in some situations, but most of the time it will help to filter the bad signals contrary to the indicators that are too reactive.

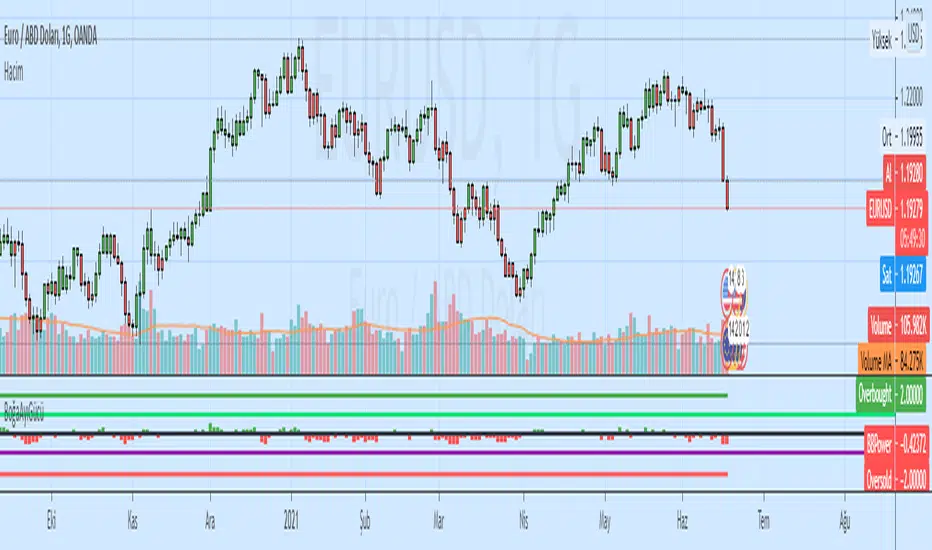
Bull Bear Power TrendDo you find it difficult to analyze trends?
This indicator will help you to have an objective analysis of the trend.
Let's start .....
In this indicator Bears and Bulls go their separate ways.
-The Bull line (bullish green) always goes above zero.
-The Bear line (bearish red) always goes below zero.
With a quick glance, you will know who is winning.
There are two zones of tendency force:
- Above 2 for bulls: when the Bull line crosses its + 2 level upwards, an uptrend begins to have strength.
- Below 2 for bears: when the Bear line crosses its -2 level down, a downward trend begins to gain strength.
Trend Confirmation:
- When a histrogram bar appears the trend is confirmed.
When a positive histogram appears, it indicates that the Bull line is above its + level and the Bear line is above its level -.
When it is a negative histogram that appears, it indicates that the Bear line is below its level - and the Bull line is below its + level.
The TREND line (in black) is the difference between the Bull line and the Bear line.
Its crosses above / below zero serve us to track the trend, as well as turning points where we could put a stop loss .
This indicator generates multiple signals as position management, I leave it to fall in love with it and find all that.
Thanks to Jose Callao for this great idea.
Thumbs up

Bull Flag DetectionThe FuturesGod bull flag indicator aims to identify the occurrence of bull flags.
Bull flags are a popular trading pattern that allows users to gauge long entries into a given market. Flags consist of a pole that is followed by either a downward or sideways consolidation period.
This script can be used on any market but was intended for futures (NQ, ES) trading on the intraday timeframe.
The script does the following:
1. Identifies the occurrence of a flag pole. This is based on a lookback period and percentage threshold decided by the user.
2. Marks the consolidation area after the pole occurrence using swing highs and swing lows.
3. Visually the above is represented by a shaded green area.
4. When a pole is detected, it is marked by a downward off-white triangle. Note that if the percentage threshold is reached several times on the same upward climb, the script will continue to identify points where the threshold for pole detection is met.
5. Also visualized are the 20, 50 and 200 period exponential moving averages. The area between the 20 and 50 EMAs are shaded to provide traders a visual of a possible support area.

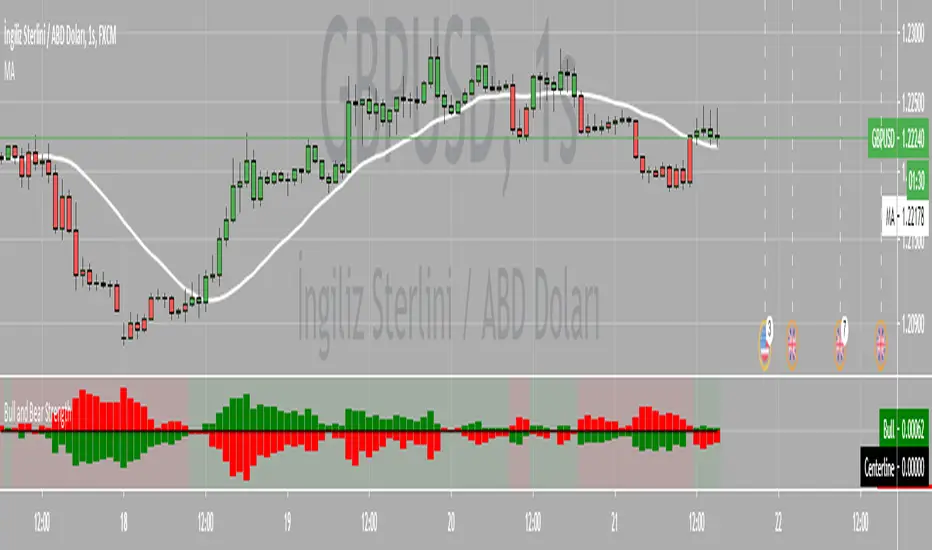
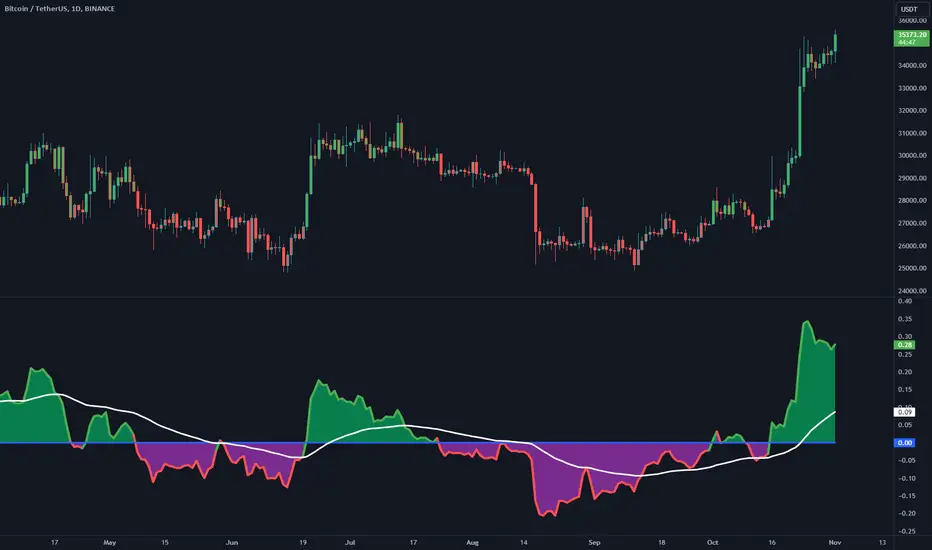
Bull Bear Power with Optional Normalization FunctionThis indicator is designed to provide traders with insights into market sentiment and potential trend reversals. This indicator enhances the traditional Bull Bear Power (BBP) by adding valuable visualizations and customization options to assist traders in making informed trading decisions.
Indicator Overview:
The NBBP indicator calculates Bull Bear Power, which measures the strength of bullish and bearish forces in the market. It does so by taking the difference between the high and the exponential moving average (EMA) of the closing price for a specified length. This raw BBP is represented on the chart as a line.
Key Features:
-- Zero Line : The NBBP indicator introduces a central reference line at zero. This line serves as a pivotal point for interpreting market sentiment. When the BBP line is above zero, it is colored green, indicating a predominance of bullish sentiment. Conversely, when the BBP line is below zero, it turns red, signaling a prevalence of bearish sentiment. This coloration helps traders quickly identify shifts in market sentiment.
-- OPTIONAL Normalization Function : One of the standout features of the NBBP indicator is its optional normalization function. When activated in the settings menu, this function scales the BBP values from -1 to +1. This means that BBP values are adjusted to fit within a standardized range, making it easier for traders to compare sentiment across different timeframes or assets. Normalization is particularly valuable for identifying extreme sentiment conditions and potential reversals.
-- Moving Average : To provide additional context and smooth out BBP fluctuations, the indicator includes an exponential moving average (EMA). The EMA of BBP is plotted on the chart as a white line. Traders can use this moving average to identify trends and potential trend reversals.
-- Fill Between Lines : The indicator visually enhances the BBP by filling the area between the BBP line and the zero line with a translucent color. This fill helps traders visualize the strength and duration of bullish or bearish sentiment.
Interpretation:
-- BBP Line : Traders can assess the raw BBP line for shifts in sentiment. When the line crosses above zero, it may suggest a shift from bearish to bullish sentiment, potentially indicating a buying opportunity. Conversely, when the line crosses below zero, it may signal a shift from bullish to bearish sentiment, suggesting a potential selling opportunity.
-- Normalization Function : The optional normalization function allows traders to gauge sentiment on a standardized scale. Values above 0 indicate bullish sentiment, while values below 0 suggest bearish sentiment. The closer the values are to their polar ends (-1 or +1), the stronger the sentiment.
-- Moving Average : The EMA of BBP helps identify trends. When BBP crosses above the EMA, it may indicate a strengthening bullish trend, while a crossover below the EMA may suggest a bearish trend.
Customization:
The NBBP indicator provides traders with flexibility through customizable settings. Users can adjust the BBP length, EMA length, and choose to activate or deactivate the normalization function based on their trading preferences and strategy.
Limitations:
The NBBP indicator is most effective when used in conjunction with other technical analysis tools and market context. Traders should consider multiple factors when making trading decisions.
Normalization function results may vary depending on the chosen length and market conditions. If the desired result is not achieved through default settings, try changing timeframes or toggling on/off the normalization function. Users should exercise caution and combine it with other indicators and analysis techniques.
In conclusion, the NBBP indicator is a versatile tool that empowers traders to assess market sentiment, identify potential reversals, and follow trends. Its intuitive visualizations, normalization function, and customizable settings make it a valuable addition to any trader's toolkit.
Bullflag Candlestick pattern
A bull flag is essentially a small consolidation near the top of an upthrust. If we picture it as a candlestick pattern, it should have a big green candlestick + a small body red/green candle near the top of the top big green candle.
This script essentially help you identify these.

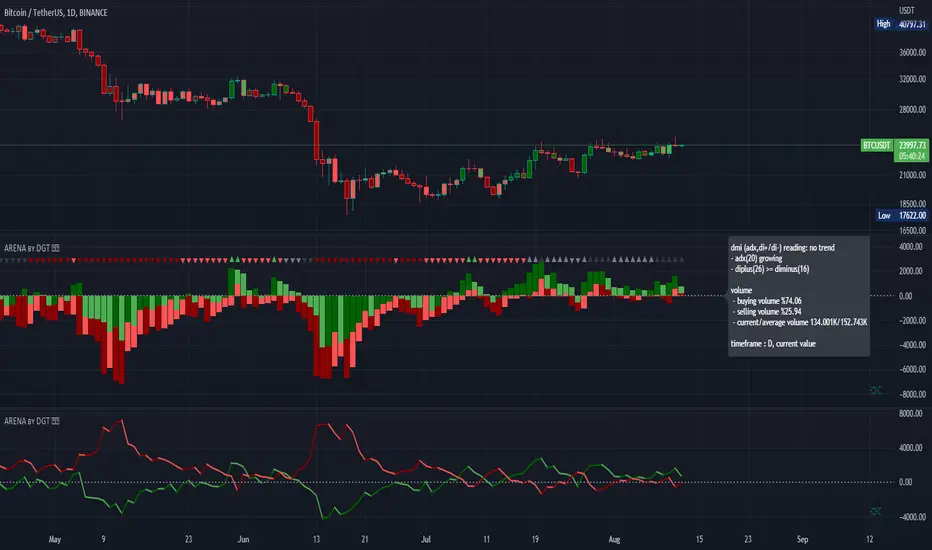
Bull vs Bear Power by DGTElder-Ray Bear and Bull Power
Dr. Alexander Elder cleverly named his first indicator Elder-Ray because of its function, which is designed to see through the market like an X-ray machine. Developed in 1989, the Elder-Ray indicator can be applied to the chart of any security and helps traders determine the strength of competing groups of bulls and bears by gazing under the surface of the markets for data that may not immediately be ascertainable from a superficial glance at prices
The Elder-Ray indicator is comprised by three elements – Bear Power, Bull Power and a 13-period Exponential Moving Average.
As the high price of any candle shows the maximum power of buyers and the low price of any candle shows the maximum power of sellers, Elder uses the 13-period EMA in order to present the average consensus of price value. Bull power shows whether buyers are capable of pushing prices above the average consensus of value. Bear power shows whether sellers are capable of pushing prices below the average consensus of value. Mathematically, Bull power is the result of subtracting the 13-period EMA from the high price of the day, and Bear power is the result of subtracting the 13-period EMA from the low price of the day.
What does this study implements
Attempts to customize interpretation of Alexander Elder's Elder-Ray Indicator (Bull and Bear Power) by
• adding additional insights to support/confirm Elder’s strategy with different indicators related with the Elder’s concept
• providing different options of visualization of the indicator
• providing smoothing capability
Other Indicators to support/confirm Elder-Ray Indicator:
Colored Directional Movement Index (CDMI) , a custom interpretation of J. Welles Wilder’s Directional Movement Index (DMI) , where :
DMI is a collection of three separate indicators ( ADX , +DI , -DI ) combined into one and measures the trend’s strength as well as its direction
CDMI is a custom interpretation of DMI which presents ( ADX , +DI , -DI ) with a color scale - representing the trend’s strength, color density - representing momentum/slope of the trend’s strength, and triangle up/down shapes - representing the trend’s direction. CDMI provides all the information in a single line with colored triangle shapes plotted on the top. DMI can provide quality information and even trading signals but it is not an easy indicator to master, whereus CDMI simplifies its usage.
Alexander Elder considers the slope of the EMA, which gives insight into the recent trend whether is up or down, and CDMI adds additional insight of verifying/confirming the trend as well as its strength
Note : educational content of how to read CDMI can be found in ideas section named as “Colored Directional Movement Index”
different usages of CDMI can be observed with studies “Candlestick Patterns in Context by DGT", “Ichimoku Colored SuperTrend + Colored DMI by DGT”, “Colored Directional Movement and Bollinger Band's Cloud by DGT”, and “Technical Analyst by DGT”
Price Convergence/Divergence , if we pay attention to mathematical formulations of bull power, bear power and price convergence/divergence (also can be expressed as price distance to its ma) we would clearly observe that price convergence/divergence is in fact the result of how the market performed based on the fact that we assume 13-period EMA is consensus of price value. Then, we may assume that the price convergence/divergence crosses of bull power, or bear power, or sum of bull and bear power could be considered as potential trading signals
Additionally, price convergence/divergence visualizes the belief that prices high above the moving average or low below it are likely to be remedied in the future by a reverse price movement
Alternatively, Least Squares Moving Average of Price Convergence/Divergence (also known as Linear Regression Curve) can be plotted instead of Price Convergence/Divergence which can be considered as a smoothed version of Price Convergence/Divergence
Note : different usages of Price Convergence/Divergence can be observed with studies “Trading Psychology - Fear & Greed Index by DGT”, “Price Distance to its MA by DGT”, “P-MACD by DGT”, where “Price Distance to its MA by DGT” can also be considered as educational content which includes an article of a research carried on the topic
Options of Visualization
Bull and Bear Power plotted as two separate
• histograms
• lines
• bands
Sum of Bull and Bear Power plotted as single
• histogram
• line
• band
Others
Price Convergence/Divergence displayed as Line
CDMI is displayed as single colored line of triangle shapes, where triangle shapes displays direction of the trend (triangle up represents bull and triangle down represent bear), colors of CDMI displays the strength of the trend (green – strong bullish, red – strong bearish, gray – no trend, yellow – week trend)
In general with this study, color densities also have a meaning and aims to displays if the value of the indicator is falling or growing, darker colors displays more intense move comparing to light one
Note : band's upper and lower levels are calculated by using standard deviation build-in function with multiply factor of 0.236 Fibonacci’s ratio (just a number for our case, no any meaning)
Smoothing
No smoothing is applied by default but the capability is added in case Price Convergence/Divergence Line is assumed to be used as a signal line it will be worth smoothing the bear, bull or sum of bear and bull power indicators
Interpreting Elder-Ray Indicator, according to Dr. Alexander Elder
Bull Power should remain positive in normal circumstances, while Bear Power should remain negative in normal circumstances. In case the Bull Power indicator enters into negative territory, this implies that sellers have overcome buyers and control the market. In case the Bear Power indicator enters into positive territory, this indicates that buyers have overcome sellers and control the market. A trader should not go long at times when the Bear Power indicator is positive and he/she should not go short at times when the Bull Power indicator is negative.
13-period EMAs slope can be used in order to identify the direction of the major trend. According to Elder, the most reliable buy signals are generated, when there is a bullish divergence between the Bear Power indicator and the price (Bear Power forms higher lows, while the market forms lower lows). The most reliable sell signals are generated, when there is a bearish divergence between the Bull Power indicator and the price (Bull Power forms lower highs, while the market forms higher highs).
There are four basic conditions, required to go long or short, with the use of the Elder-Ray method alone.
In order to go long:
1. The market is in a bull trend, as indicated by the 13-period EMA
2. Bear Power is in negative territory, but increasing
3. The most recent Bull Power top is higher than its prior top
4. Bear Power is going up from a bullish divergence
The last two conditions are optional that fine-tune the buying decision
In order to go short:
1. The market is in a bear trend, as indicated by the 13-period EMA
2. Bull Power is in positive territory, but falling
3. The most recent Bear Power bottom is lower than its prior bottom
4. Bull Power is falling from a bearish divergence
The last two conditions are optional, they provide a stronger signal for shorting but they are not absolutely essential
If a trader is willing to add to his/her position, he/she needs to:
1. add to his/her long position, when the Bear Power falls below zero and then climbs back into positive territory
2. add to his/her short position, when the Bull Power increases above zero and then drops back into negative territory.
note : terminology of the definitions used herein are as per TV dictionary
Trading success is all about following your trading strategy and the indicators should fit within your trading strategy, and not to be traded upon solely
Disclaimer : The script is for informational and educational purposes only. Use of the script does not constitute professional and/or financial advice. You alone have the sole responsibility of evaluating the script output and risks associated with the use of the script. In exchange for using the script, you agree not to hold dgtrd TradingView user liable for any possible claim for damages arising from any decision you make based on use of the script
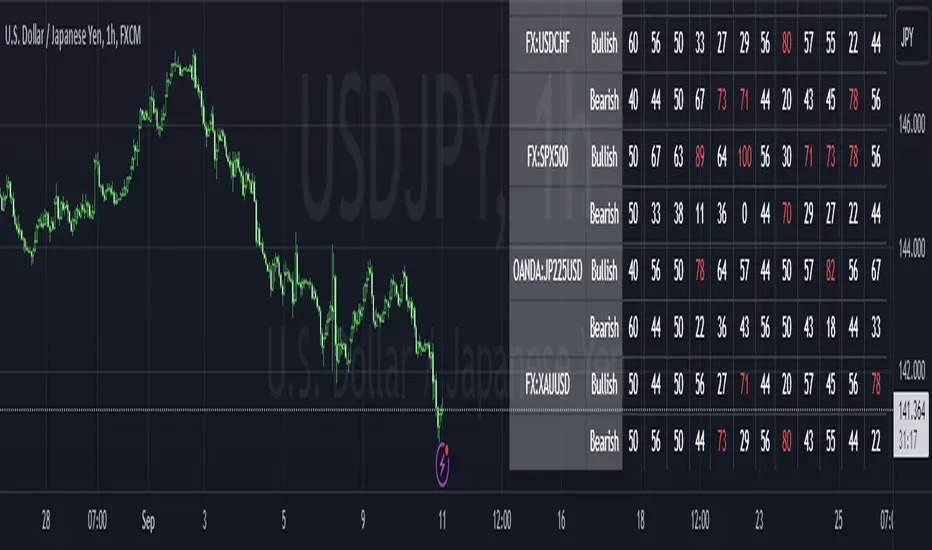
Bull/Bear Ratio By Month Table [MsF]Japanese below / 日本語説明は英文の後にあります。
-------------------------
This is an indicator that shows monthly bull-bear ratio in a table.
By specifying the start year and end year, the ratio will be calculated and showed based on the number of bullish and bearish lines in the monthly bar. It allows you to analyze the trend of each symbol and month (bullish / bearish). Up to 10 symbols can be specified.
You can take monthly bull-bear ratio for the past 10 or 20 years on the web, but with this indicator, you can narrow it down to the period in which you want to see the symbols you want to see. It is very convenient because you can take statistics at will.
Furthermore, if the specified ratio is exceeded, the font color can be changed to any color, making it very easy to read.
=== Parameter description ===
- From … Year of start of aggregation
- To … Year of end of aggregation
- Row Background Color … Row title background color
- Col Background Color … Column title background color
- Base Text Color … Text color
- Background Color … Background Color
- Border Color … Border Color
- Location … Location
- Text Size … Text Size
- Highlight Threshold … Ratio threshold, and color
- Display in counter? … Check if you want to show the number of times instead of the ratio
-------------------------
月別陰陽確率をテーブル表示するインジケータです。
開始年から終了年を指定することで、月足における陽線数および陰線数を元に確率を計算して表示します。
この機能により各シンボルおよび各月の特徴(買われやすい/売られやすい)を認識することができアノマリー分析が可能です。
シンボルは10個まで指定可能です。
過去10年、20年の月別陰陽確率は、Web上でよく見かけますが、このインジケータでは見たいシンボルを見たい期間に絞って、
自由自在に統計を取ることができるため大変便利です。
なお、指定した確率を上回った場合、文字色を任意の色に変更することができるため、大変見やすくなっています。
=== パラメータの説明 ===
- From … 集計開始年
- To … 集計終了年
- Row Background Color … 行タイトルの背景色
- Col Background Color … 列タイトルの背景色
- Base Text Color … テキストカラー
- Background Color … 背景色
- Border Color … 区切り線の色
- Location … 配置
- Text Size … テキストサイズ
- Highlight Threshold … 色変更する確率の閾値、および色
- Display in counter? … 確率ではなく回数表示する場合はチェックする
Bull/Bear Candle % Oscillator█ OVERVIEW
This script determines the proportion of bullish and bearish candles in a given sample size. It will produce an oscillator that fluctuates between 100 and -100, where values > 0 indicate more bullish candles in the sample and values < 0 indicate more bearish candles in the sample. Data produced by this oscillator is normalized around the 50% value, meaning that an even 50/50 split between bullish and bearish candles makes this oscillator produce 0; this oscillator indirectly represents the percent proportion of bullish and bearish candles in the sample (see HOW TO USE/INTERPRETATION OF DATA ).
It has two overarching settings: 'classic' and 'range'.
█ CONCEPTS
This script will cover concepts related to candlestick analysis, volumetric analysis, and lower timeframes.
Candlestick Analysis - The idea behind this script is to solely look at the candlesticks themselves and derive information from them in a given sample. It separates candles into two categories, bullish (close > open) and bearish (close < open).
If the indicator's setting is set to 'classic', the size of candles do not matter and all are assigned a value of 1 or 0.
If the indicator's setting is set to 'range', specific candle ranges modify the proportion of bullish/bearish values. Bullish candle values include all bullish candles in the set from their lows to the close, plus the lower wicks of all bearish candles. Bearish candle values include all bearish candles in the set from their highs to the close, plus the upper wicks of all bullish candles.
Volumetric Analysis - One of this script's features allows the user to modify the bullish and bearish candle proportions by its 'weight' determined by its volume compared to the sample set's total volume. Volumetric analysis for the 'range' setting are more complex than 'classic' as described below.
Lower Timeframes - For volumetric analysis to be done on candle wicks, there needed to be a way to determine how much volume had occurred in the wick by itself to find the weight of upper and lower wicks. To accomplish this, I employed PineScrypt's request.security_lower_tf function to grab OHLC values of lower timeframe candles (as well as volume) to determine how much volume had occurred in the wicks of the chart resolution's candle. The default OHLC values used here are the lows for upper wicks and highs for lower wicks. These OHLC values are then compared to the chart resolution candle's close to determine if the volume of that lower timeframe candle should be shifted to the wick weight or stay in the current weight of that candle. The reason 'low' and 'high' are used here is to guarantee that 100% of the volume of a lower timeframe candle had occurred in the wick of the candle at the current resolution (see LIMITATIONS ).
Bullish candles will exclude volume of all lower timeframe candles whose lows were greater than that candle's close. Bearish candles will exclude volume of all lower timeframe candles whose highs were less than that candle's close. These wick volumes are then divided by the volume of the sample set, and wick sizes are then multiplied by this weight before being added to their specific bullish/bearish sums (lower wicks to bullish and upper wicks to bearish).
█ FEATURES
There are 13 inputs for the user to modify the behavior/visual representation of this script.
Sample Length - This determines how many candles are in the sample set to find the proportion of bullish and bearish candles.
Colors and Invert Colors - There are three colors set by the user: a bullish color, neutral color, and bearish color. The oscillator plots two lines, one at 0 and another that represents the proportion of bullish or bearish candles in the sample set (we'll call this the 'signal line'). If the oscillator is above 0, bullish color is used, bearish otherwise. This script generates a gradient to color a filled area between the 0 line and the signal line based on the historical values of the oscillator itself and the signal line. For bullish values, the closer the signal line is to the max (or restricted max described below) that the oscillator has experienced, the more colored toward bullish color the shaded area will be, using the neutral color as a starting point. The same is applied to the bearish values using the bearish color.
There is an additional input to invert the colors so that the bearish color is associated with bullish values and vise-versa.
Calculation Type - This determines the overarching behavior of the oscillator and has two settings:
Classic - The weight of candles are either 1 if they occurred and 0 if not.
Range - The weight of candles is determined by the size of specific sections as described in CONCEPTS - Candlestick Analysis .
Volume Weighted - This enables modifying the weights of candles as described in CONCEPTS - Volumetric Analysis and Lower Timeframes based on which Calculation Type is used.
Wick Slice Resolution - This is the lower timeframe resolution that will be used to slice the chart resolution's candle when determining the volumetric weight of wicks. Lower timeframe resolutions like '1 minute' will yield more precise results as they will give more data points to go off of (see LIMITATIONS ).
Upper/Lower Wick Source - These two inputs allow the user to select which OHLC values to compare against the chart resolution's candle close when determining which lower timeframe candles will have their volumes associated with the wicks of candles being analyzed at the chart's resolution.
Restrict Min/Max Data and Restriction - This will restrict the maximum and minimum values that will be used for the signal line when comparing its value to previous oscillator values and change how the color gradient is generated for the indicator. Restriction is the number of candles back that will determine these maximum and minimum values.
Display Min/Max Guide - This will plot two lines that are colored the corresponding bullish and bearish colors which follow what the maximum and minimum values are currently for the oscillator.
█ HOW TO USE/INTERPRETATION OF DATA
As mentioned in the OVERVIEW section, this oscillator provides an indirect representation of the percent proportion of bullish or bearish candles in a given sample. If the oscillator reads 80, this does not mean that 80% of all candles in the sample were bullish . To find the percentage of candles that were bullish or bearish, the user needs to perform the following:
50% + ((|oscillator value| / 100) * 50)%
If the oscillator value is negative, the value from above will represent the percentage of bearish candles in the sample. If it is positive, this value represents the percentage of bullish candles in the sample.
Example 1 (oscillator value = 80):
50% + ((|80| / 100) * 50)%
50% + ((0.80) * 50)%
50% + 40% = 90%
90% of the candles in the sample were bullish.
Example 2 (oscillator value = -43):
50% + ((|-43| / 100) * 50)%
50% + ((0.43) * 50)%
50% + 21.5% = 71.5%
71.5% of the candles in the sample were bearish.
An example use of this indicator would be to put in a 'buy' order when its value shows a significant proportion of the sampled candles were bearish, and put in a 'sell' order when a significant proportion of candles were bullish. Potential divergences of this oscillator may also be used to plan trades accordingly such as bearish divergence - price continues higher as the oscillator decreases in value and vise-versa.*
* Nothing in this script constitutes any form of financial advice. The user is solely responsible for their trading decisions and I will not be held liable for any losses or gains incurred with the use of this script. Please proceed with caution when using this script to assist with trading decisions.
█ LIMITATIONS
Range Volumetric Weights :
Because of the conditions that must be met in order for volume to be considered part of wicks, it is possible that the default settings and their intended reasoning will not produce reliable results. If all lower timeframe candles have highs or lows that are within the body of the candle at the chart's resolution, the volume for the wicks will effectively be 0, which is not an accurate representation of those wicks. This is one of the reasons why I included the ability to change the source values used for these conditions as certain OHLC values may produce more reliable/intended results under these conditions.
Wick Slice Resolution :
PineScript restricts the number of intrabar references to 100,000 total. This script uses 3 separate request.security_lower_tf calls and has a default resolution of 1 minute. This means that if the user were to set the oscillator to the Range setting, enable volume weighted, and had the Wick Slice Resolution set to 1 minute, this script will exceed this 100,000 reference restriction within 24 days of data and will not produce any results beyond the previous 23.14 days.
Below are example uses of all the different settings of this script, these are done on the 1D chart of COINBASE:BTCUSD :
Default Settings:
Classic - Volume Weighted:
Range - no Volume Weight:
Range - Volume Weighted (1 min slices):
Range - Volume Weighted (1 hour slices):
Display Min/Max Guide - No Restriction:
Display Min/Max Guide - Restriction:
Invert Colors:

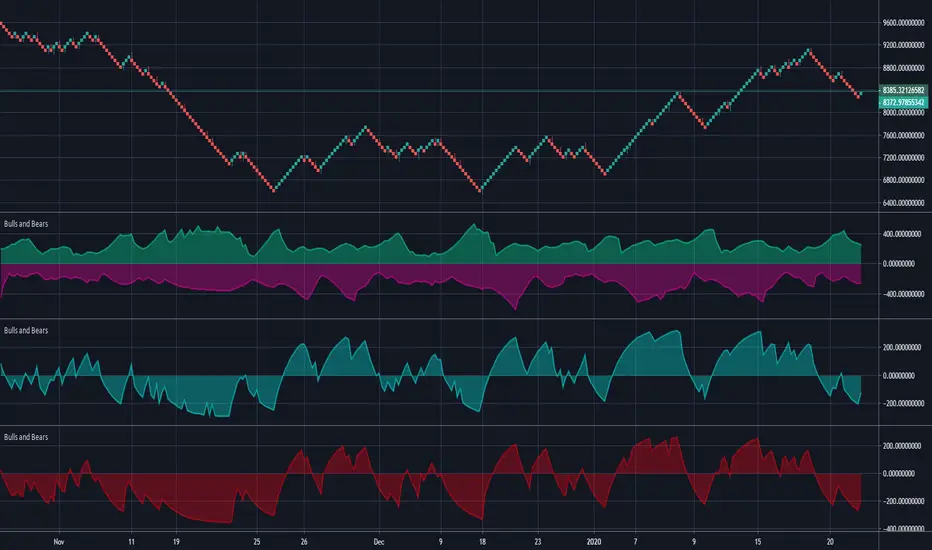
Bulls and BearsIntroduction to the Bulls and Bears Indicator
HAVE YOU EVER WANTED TO SEE VISUALLY WHO IS IN CONTROL, THE BULLS OR BEARS?
This indicator aspires to make it much easier for the trader to read the market in a clear and concise manner.
This is an easy to use Bulls and Bears indicator that works very simply:
If the closing price is greater than the 20, 50 or 200 moving average it indicates with a '+'.
If the closing price is less than the 20, 50 or 200 moving average it indicates with a '-'.
There are also some additional indicators that if all three above are flagged, then a 'B' symbol appears below the candle, to indicate it a highly Bullish.
If all three closing prices are below all of the moving averages a 'B' symbol appears above the candle to indicate high Bearish pressure.

Bull Bear Power1. Calculate
* Base on RSI status in the same period of price bar, "Bull Bear Power" is counting number of bars moved above 70 then return result to "bull power" series, and counting number of bars moved below 30 then return result to "bear power" series.
* By default RSI period is 2 and Bar period is 15.
2. Interface
* Bull power: green columns.
* Bear power: red columns.
* Info Line: show info of RSI and Bull Bear Power
- Bull Bear Power info: Period, Bull value, Bear value
- RSI info: RSI value, RSI status: overbought (>70), oversold(<30), crossunder 70, crossover 30.
3. Trade:
* Consider place Long oder when Bull power increase from below to above Bear power
* Consider place Short oder when Bear power increase from below to above Bull power

Bulls and BearsThis is a standard 'Bulls and Bears Power" Oscillator, how ever,...
There are two different formulas for calculating bulls and bears, the standard version, uses Highest and Lowest of prices in a given period, BUT, the version we have in meta trader platform, uses the current high and current low for each bar.
Within this indicator, you can use the standard version or the meta trader version, it will draw both bulls and bears and you can turn each one on and off in the style section.
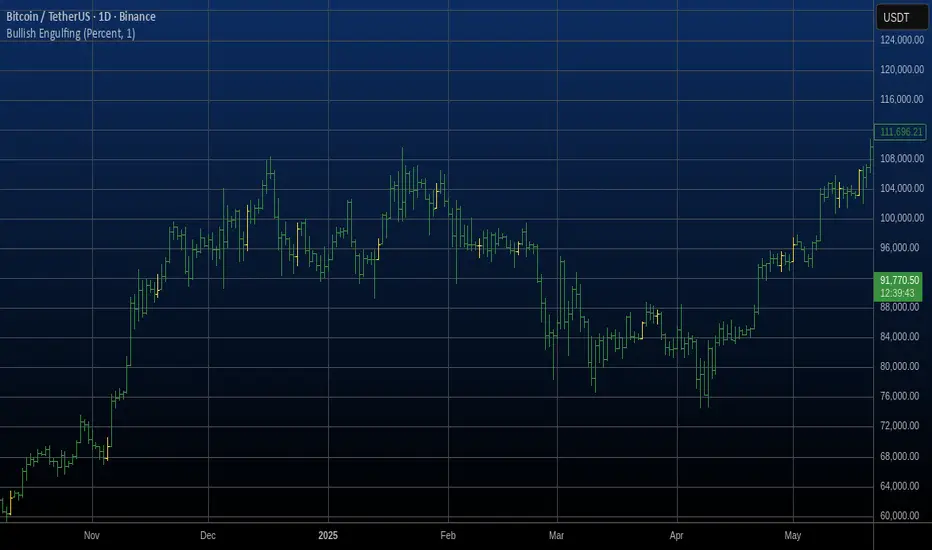
Bullish Engulfing Automatic Finding Script This is a bullish pattern formed by three candlesticks.
The pattern is based on the fact that the last candlestick must
completely engulf the previous two and be upward. The two preceding
candlesticks must also be downward. Candlestick wicks are not taken
into account.
Bull vs Bear CandlesThe Bull vs Bear Candles indicator helps you analyze market sentiment by counting and comparing bullish and bearish candles. It tracks the number of bullish candles and calculates their percentage, then does the same for bearish candles. Based on this data, the indicator determines whether bulls or bears are in control. Additionally, it counts the total number of candles within the selected range, giving you a clearer picture of price action. Use this tool to quickly assess market trends and make more informed trading decisions. 🚀

Bullish Candlestick Patterns With Filters [TradeDots]The "Bullish Candlestick Patterns With Filters" is a trading indicator that identifies 6 core bullish candlestick patterns. This is further enhanced by applying channel indicator as filters, designed to further increase the accuracy of the recognized patterns.
6 CANDLESTICK PATTERNS
Hammer
Inverted Hammer
Bullish Engulfing
The Piercing Line
The Morning Star
The 3 White Soldiers
SIGNAL FILTERING
The indicator incorporates with 2 primary methodologies aimed at filtering out lower accuracy signals.
Firstly, it comes with a "Lowest period" parameter that examines whether the trough of the bullish candlestick configuration signifies the lowest point within a specified retrospective bar length. The longer the period, the higher the probability that the price will rebound.
Secondly, the channel indicators, the Keltner Channels or Bollinger Bands. This indicator examines whether the lowest point of the bullish candlestick pattern breaches the lower band, indicating an oversold signal. Users have the flexibility to modify the length and band multiplier, enabling them to custom-tune signal sensitivity.
Without Filtering:
With Filtering
RISK DISCLAIMER
Trading entails substantial risk, and most day traders incur losses. All content, tools, scripts, articles, and education provided by TradeDots serve purely informational and educational purposes. Past performances are not definitive predictors of future results.
