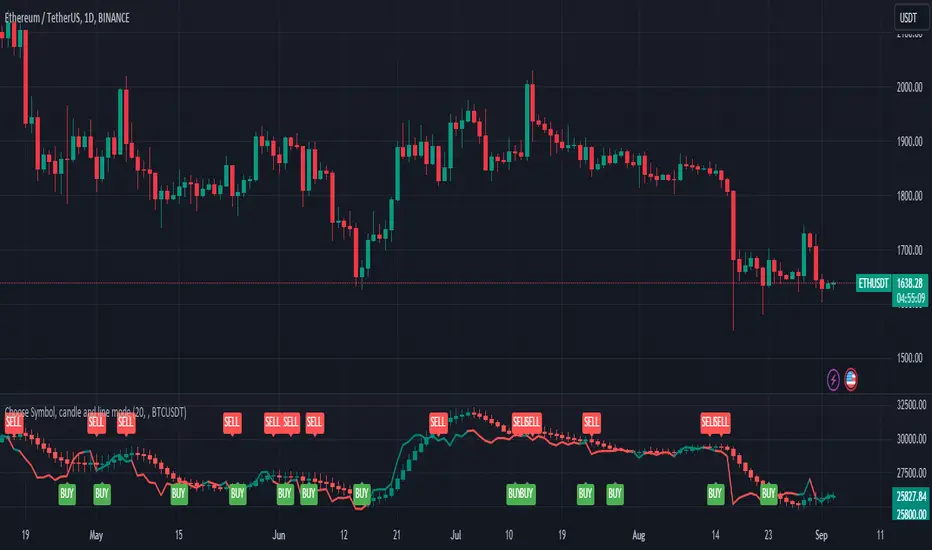
Choose Symbol, candle and line modeThis indicator plots candlesticks or line charts based on user-specified symbol and price data in the time frame. The user can also choose whether this indicator works in normal mode or Heikin-Ashi mode. Here are the features of this indicator:
1. **Trend and Normal Modes:** User can choose to operate the indicator in two different modes. In "Trend Mode" the indicator plots the moving average of the price based on the specified period length. In the "Normal Mode", it draws the opening, high, low and closing prices similar to the Heikin-Ashi candlesticks.
2. **Time Zone Selection:** User can select a different time zone to operate this indicator. By default, the current chart timeframe is used.
3. **Symbol Selection:** The indicator uses the price data from the specified symbol. The user can specify the symbol in the format "SYMBOL:PAIR".
4. **Buy-Sell Signals:** The indicator identifies buy and sell signals based on a certain period length. A buy signal occurs when the price goes above the line, while a sell signal occurs when the price goes below the line.
5. **Buy-Sell Alerts:** Alerts are sent to the user for buying and selling signals.
6. **Display on Chart:** The indicator draws candlesticks or line chart with specified modes and colors. It also marks the buying and selling points on the chart.
This indicator is used to analyze price movements in the specified symbol and time frame and to assist in buying and selling decisions. It has a user-friendly and customizable interface.
It is for idea purposes only, does not contain investment advice.
Cerca negli script per "Buy sell"
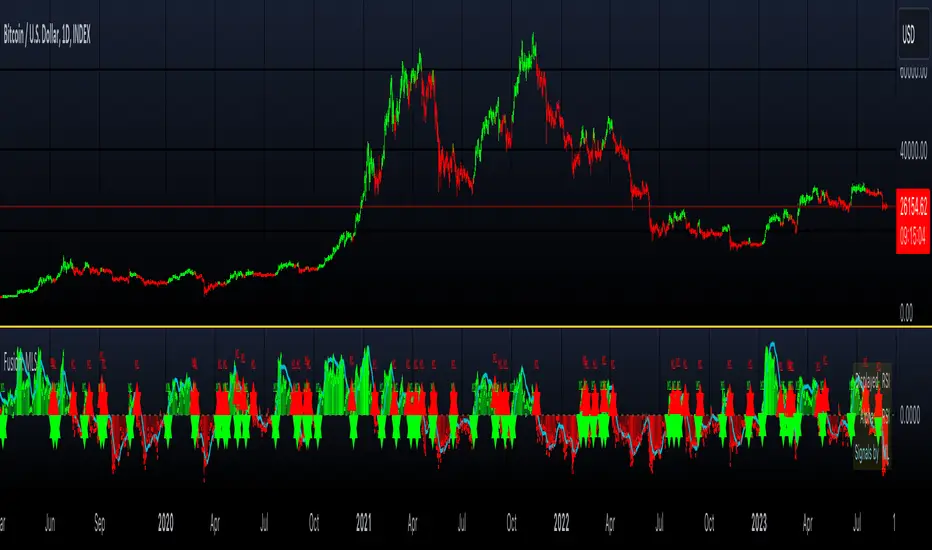
Fusion: Machine Learning SuiteThe Fusion: Machine Learning Suite combines multiple technical analysis dimensions and harnesses the predictive power of machine learning, seamlessly integrating a diverse array of classic and novel indicators to deliver precision, adaptability, and innovation.
Features and Capabilities
Multidimensional Analysis: Fusion: MLS integrates various technical analysis dimensions to offer a more comprehensive perspective.
Machine Learning Integration: Utilizing ML algorithms, Fusion: MLS offers adaptability to market changes.
Custom Indicators: Including dimensions like "Moon Lander", "Cap Line" and "Z-Pack" the indicator expands the scope of traditional technical analysis methods.
Tailored Customization: With customization options, Fusion: MLS allows traders to configure the tool to suit their specific strategies and market focus.
In the following sections, we'll explore the features and settings of Fusion: MLS in detail, providing insights into how it can be utilized.
Major Features and Settings
The indicator consists of several core components and settings, each designed to provide specific functionalities and insights. Here's an in-depth look:
Machine Learning Component
Distance Classifier: A Strategic Approach to Market Analysis
In the world of trading and investment, the ability to classify and predict price movements is paramount. Machine learning offers powerful tools for this purpose.
The Fusion: MLS indicator among others incorporates an Approximate Nearest Neighbors (ANN)* algorithm, a machine learning classification technique, and allows the selection of various distance functions .
This flexibility sets Fusion: MLS apart from existing solutions. The available distance functions include:
Euclidean: Standard distance metric, commonly used as a default.
Chebyshev: Also known as maximum value distance.
Manhattan: Sum of absolute differences.
Minkowski: Generalized metric that includes Euclidean and Manhattan as special cases.
Mahalanobis: Measures distance between points in a correlated space.
Lorentzian: Known for its robustness to outliers and noise.
*For a deeper understanding of the Approximate Nearest Neighbors (ANN) algorithm, traders are encouraged to refer to the relevant articles that can be found in the public domain.
Alternative scoring system
Fusion: MLS also includes a custom scoring alternative based on directional price action.
"Combined: Directional" and "Alpha: Directional" scoring types represent our own directional change algorithm, simple yet effective in displaying trend direction changes early on. They are visualized by color changes when scoring becomes below or above zero.
Changes in scoring quickly reflect shifts in buyer and seller sentiment.
Traders may choose signals by Color Change in the indicator settings to get alerts when scoring color shifts, not waiting until the histogram crosses the zero level.
Application in Trading
Machine learning classification has become an integral part of modern trading, offering innovative ways to analyze and interpret financial data.
Many algorithmic trading systems leverage ML classification to automate trading decisions. By continuously learning from real-time data, these systems can adapt to changing market conditions and execute trades with increased efficiency and accuracy.
ML classification allows for the development of tailored trading strategies as traders can select specific algorithms, dimensions, and filters that align with their trading style, goals, and the particular market they are operating.
We have integrated ML classification with traditional trading tools, such as moving averages and technical indicators. This fusion creates a more robust analysis framework, combining the strengths of classical techniques with the adaptability of machine learning.
Whether used independently or in conjunction with other tools, ML classification represents a significant advancement in trading technology, opening new avenues for exploration, innovation, and success in the financial world.
ML: Weighting System
The Fusion: MLS indicator introduces a unique weighting system that allows traders to customize the influence of various technical indicators in the machine learning process. This feature is not only innovative but also provides a level of control and adaptability that sets it apart from other indicators.
Customizable Weights
The weighting system allows users to assign specific weights to different indicators such as Moon Lander, RSI, MACD, Money Flow, Bollinger Bands, Cap Line, Z-Pack, Squeeze Momentum*, and MA Crossover. These weights can be adjusted manually, providing the ability to emphasize or de-emphasize specific indicators based on the trader's strategy or market conditions.
*Note, we determined via testing that the popular "Squeeze" indicator can actually be well replicated by simply using inputs of 15 & 199 in the bedrock indicator - MACD ; while we employed the standard "Squeeze" formula (developed by J. Carter ) in Fusion: MLS, traders are hereby made aware of our research findings regarding such.
The weighting system's importance lies in its ability to provide a more nuanced and personalized analysis. By adjusting the weights of different indicators a trader focusing on momentum strategies might assign higher weights to the Squeeze Momentum and MA Crossover indicators, while a trader looking for volatility might emphasize RSI and Bollinger Bands.
The ability to customize weights adds a layer of complexity and adaptability that is rare in standard machine-learning indicators.
Custom Indicators: Moon Lander
The "Moon Lander" is not just a catchy name; it's a robust feature inspired by principles from aerospace engineering and offers a unique perspective on trading analysis. Here's a conceptual overview:
Fast EMA and Kalman Matrix
"Moon Lander" incorporates both a Fast Exponential Moving Average (EMA) and a Kalman Matrix in its design. These two elements are combined to create a histogram, providing a specific approach to data analysis.
The Kalman Matrix, or Kalman Filter, is a mathematical concept used for estimating variables that can be measured indirectly and contain noise or uncertainty. It's a standard tool in machine learning and control systems, known for its ability to provide optimal estimates based on observed data.
Kalman Filter: A Navigational Tool
The Kalman filter, an essential part of "Moon Lander," is a mathematical concept known for its applications in navigation and control systems used by NASA in the apollo program :
Guidance in Uncertainty: Just as the Kalman filter helped guide complex aerospace missions through uncertain paths, it assists traders in navigating the often unpredictable financial markets.
Filtering Noise: In trading, the Kalman filter serves to filter out market noise, allowing traders to focus on the underlying trends.
Predictive Capabilities: Its ability to predict future states makes it a valuable tool for forecasting market movements and trend directions.
Custom Indicators: Cap Line and Z-Pack
Fusion: MLS integrates our additional proprietary custom indicators that have been published on TradingView earlier:
Cap Line: Delve into the specific functionalities and applications of our proprietary "Cap Line" indicator in the published description on TradingView.
Z-Pack: Explore the analytical perspectives, focused on the z-score methodology, and custom "Z-Pack" indicator by reviewing the published description on TradingView.
Buy/Sell Signal Generation Algorithms
Fusion: MLS offers various options for generating buy/sell signals, tailored to different trading strategies and perspectives:
Fusion: Allows traders to select any number of dimensions to receive buy/sell signals from, offering customized signal generation.
ML: Utilizes the machine learning ANN distance for signal generation.
Color Change: Generates signals by selected scoring type color change.
Displayed Dimension, Alpha Dimension: Generate signals based on specific selected dimensions.
These algorithms provide flexibility in determining buy/sell signals, catering to different trading styles and market conditions.
Filters
Filters are used to refine and selectively include or exclude signals based on specific criteria. Rather than generating signals, these filters act as gatekeepers, ensuring that only the signals meeting certain conditions are considered. Here's an overview of the filters used:
Dynamic State Predictor (DSP)
The DSP employs the Kalman Matrix to evaluate existing signals by comparing the fast and slow-moving averages, both processed through the Kalman Matrix. Based on the relationship between these averages, the DSP may exclude specific signals, depending on whether they align with upward or downward trends.
Average Directional Index (ADX)
The ADX filter evaluates the strength of existing trends and filters out signals that do not meet the specified ADX threshold and length, focusing on significant market movements.
Feature Engineering: RSI
Applies a filter to the existing signals, clearing out those that do not meet the criteria for RSI overbought or oversold threshold condition.
Feature Engineering: MACD
Assesses existing signals to identify changes in the strength, direction, momentum, and duration of a trend, filtering out those that do not align with MACD trend direction.
The Visual Component
The machine learning component is an internal component. However, the indicator also offers an equally important and useful visual component. It is a graphical representation of the multiple technical analysis dimensions, that can be combined in various ways (where the name "Fusion" comes from), allowing traders to visualize the underlying data and its analysis.
Displayed Dimension: Visualization and Normalization
The Fusion: MLS indicator offers a "Displayed Dimension" feature that visualizes various dimensions as a histogram. These dimensions may include RSI, MAs, BBs, MACD, etc.
RSI Dimension on the image + ML signals
Normalization: Each dimension is normalized. If any dimension has extreme values, a Fisher transformation is applied to bring them within a reasonable range.
Combined Dimension: When selecting the "Combined" option , the normalized values of the selected dimensions are combined using techniques such as standardization, normalization, or winsorization. This flexibility enables tailored visualization and analysis.
Alpha Dimension: Enhancing Analysis
The "Alpha Dimension" feature allows traders to select an additional dimension alongside the Displayed Dimension. This facilitates a combined analysis, enhancing the depth of insights.
Theme Selection
Fusion: MLS offers various themes such as "Sailfish", "Iceberg", "Moon", "Perl", "Candy" and "Monochrome" Traders can select a theme that resonates with their preference, enhancing visual appeal. There is also a "Custom" theme available that allows the user to choose the colors of the theme.
Customizing Fusion: MLS for Various Markets and Strategies
Fusion: MLS is designed with customization in mind. Traders can tailor the indicator to suit various markets and trading strategies. Selecting specific dimensions allows it to align with individual trading goals.
Selecting Dimensions: Choose the dimensions that resonate with your trading approach, whether focusing on trend-following, momentum, or other strategies.
Adjusting Parameters: Fine-tune the parameters of each dimension, including custom ones like "Moon Lander," to suit specific market conditions.
Theme Customization: Select a theme that aligns with your visual preferences, enhancing your chart's readability and appeal.
Utilizing Research: Leverage the underlying algorithms and research, such as machine learning classification by ANN and the Kalman filter, to deepen your understanding and application of Fusion: MLS.
Alerts
The indicator includes an alerting system that notifies traders when new buy or sell signals are detected.
Disclaimer
The information provided herein is intended for informational purposes only and should not be construed as investment advice, endorsement, nor a recommendation to buy or sell any financial instruments. Fusion: MLS is a technical analysis tool, and like all tools, it should be used with caution and in conjunction with other forms of analysis.
Traders and investors are encouraged to consult with a licensed financial professional and conduct their own research before making any trading or investment decisions. Past performance of the Fusion: MLS indicator or any trading strategy does not guarantee future results, and all trading involves risk. Users of Fusion: MLS should understand the underlying algorithms and assumptions and consider their individual risk tolerance and investment goals when using this tool.
Volume Delta Methods (Chart) [LuxAlgo]The Volume Delta Methods (Chart) aims at highlighting the relationship between Buying or Selling Pressure and Price by presenting Volume Delta , and multiple derivatives of volume delta such as Cumulative Volume Delta (CVD) , Buy/Sell Volume , Total Volume , etc on top of the Main Price Chart .
The script uses two different intrabar (chart bars at a lower timeframe than the chart's) analyses to achieve the most approximate calculation of the volume delta and offers fully customizable visualization features using various types of charts such as line, area, baseline, candles, and histograms.
The script allows traders to see "within" the price bar, provides more transparency over a traditional volume histogram, and also allows users to monitor price and volume activity together.
🔶 USAGE
Volume delta is the difference between the buying volume and the selling volume, in other words, it is the net demand at a given bar allowing traders a more detailed insight when analyzing the market sentiment. A volume delta greater than 0 indicates more buying than selling pressure, whereas a volume delta less than 0 indicates more selling than buying pressure.
Volume delta plus total volume (regular volume) adds additional insight, where the total volume represents all the recorded trades for security that occurs in a given time interval. It is a measurement of the participation, enthusiasm, and interest in a given security.
Divergences occur when the polarity of the volume delta does not match the polarity of the price bar.
The users can enable the display of the numerical values of the volume delta.
Cumulative Volume Delta (CVD) is a way of using Volume Delta to measure an asset’s mid-to-long-term buy and sell pressure. It compares buying and selling volume over time and offers insights into market behavior at specific price points. Cumulative Volume Delta is effectively a continuation of the principles of Volume Delta but involves longer time periods and offers different trading signals.
Like the Volume Delta, the Cumulative Volume Delta (CVD) indicator measures the relationship between buy and sell pressure but does not focus on one specific candle in particular. Rather, the Cumulative Volume Delta takes the relative differences and combines them all over an extended time period.
Users have the ability Cumulative Volume Delta in various types of charts along with an optional smoothing line.
Placed above price bars options.
Interacting with price bar options helps to better identify CVD Divergences.
CVD Divergences
CVD reveals buying and selling trends that may or may not complement the price trend of the asset itself. Sometimes, price trends can run in contrast to trading behavior — sell volume can be dominant while the spot price is rising, and vice versa.
🔶 DETAILS
Theoretically, volume delta is calculated by taking the difference between the volume that traded at the ask price and the volume that traded at the bid price. The most precise calculation method uses tick data but requires huge amounts of data on historical bars, which usually limits the historical depth of charts. This indicator uses two different intrabar analysis methods for the volume delta calculation, where intrabars are chart bars at a lower timeframe than the chart's timeframe:
The logic used to assign intrabar volume to the "up" or "down".
- Buying/Selling pressure of the intrabar option (default)
(close - low) > (high - close) => UP
(close - low) < (high - close) => DOWN
(close - low) = (high - close) => close - previous close is used
- Polarity of the intrabar option
close > open => UP
close < open => DOWN
close = open => close - previous close is used
🔶 SETTINGS
The script takes into account user-defined parameters and performs calculations and presentations based on them, where detailed usage for each user-defined input parameter in indicator settings is provided with the related input's tooltip.
🔹 Calculation Settings
Calculation Method: Calculation method selection, available options 'Intrabar Buying/Selling Pressure' or 'Intrabar Polarity'.
Lower Timeframe Precision: Sets indicator precision, default option is 'Auto'.
🔹 Presentation Settings
Volume Delta: Toggles the visibility of the Volume Delta
Cumulative Volume Delta: Toggles the visibility of the Cumulative Volume Delta
Volume Delta/Price Bar Divergences: Toggles the visibility of the Volume Delta Divergences
Volume Delta Numerical Values: Toggles the visibility of the Volume Delta Numerical Values
🔹 Other Features
Volume MA: Toggles the visibility of the Volume Moving Average
CVD Smoothing: Toggles the visibility of the Cumulative Volume Delta's Smoothing Line
🔹 Volume Delta, Others
Volume Delta: Positive, Negative: Volume Delta color customization options
Volume Histogram: Growing, Falling: Volume Histogram color customization options
Display Length: Length of the visual objects presented with this indicator
Volume Delta Height: Volume delta height customization options
Volume Histogram Height: Volume histogram height customization options
Vertical Offset: Volume delta and histogram vertical positioning customization options
🔹 Cumulative Volume Delta, Others
CVD Line, Width, and Color: Cumulative Volume Delta - Line Width and Color customization options
CVD Area/Baseline, Gradient Coloring: Cumulative Volume Delta - Area and Baseline background gradient coloring customization options
CVD Candles Color, Positive, and Negative: Cumulative Volume Delta - Candles coloring customization options
CVD/Smoothing Background: Highlights and adjusts the transparency of the area between the Cumulative Volume Delta Line and it's Smoothing Line
🔶 RELATED SCRIPTS
Liquidity-Sentiment-Profile
EquiVolume
Volume-Footprint

Volume-Weighted Trend Filter CloudThe Volume-Weighted Trend Filter Cloud is a powerful technical analysis tool designed to identify trend directions and potential buy/sell signals in a trading instrument. The indicator combines volume-weighted moving averages, average true range (ATR), and cloud plotting techniques to provide a comprehensive view of the market trend.
Inputs:
Length: Specifies the length of Algo used for trend analysis. Default value is 14.
Multiplier: Adjusts the width of the trend filter bands based on the ATR. Default value is 2.0.
Tenkan-sen Period: Defines the period for calculating the Tenkan-sen line. Default value is 200.
Kijun-sen Period: Sets the period for calculating the Kijun-sen line. Default value is 400.
Senkou Span Period: Determines the period for calculating the Senkou Span A and Senkou Span B lines. Default value is 600.
Calculation:
Average True Range (ATR): The indicator calculates the ATR based on the specified moving average length.
Trend Filter Bands: The basic upper and lower bands are calculated using the highest high and lowest low values, respectively, along with the multiplier and ATR. These bands are then adjusted to create the final upper and lower bands, taking into account the previous values.
Trend Direction: The indicator determines the trend direction by comparing the close price with the lower and upper bands. If the close price is above the lower band, it indicates an upward trend (trendUp = 1). If the close price is below the upper band, it indicates a downward trend (trendDown = 1).
Volume-Weighted Z-Score: The indicator calculates the volume-weighted Z-Score by determining the mean and standard deviation of the close price with volume weighting. The Z-Score represents the deviation of the close price from the mean in terms of standard deviations.
Tenkan-sen, Kijun-sen, Senkou Span A, and Senkou Span B: These lines are calculated using the respective periods and the average of the high and low prices.
Sigmoid Transformation: The indicator applies the sigmoid function to the Z-Score values to obtain sigmoid-transformed values for open, high, low, and close prices. These transformed values help in visualizing the trend strength.
Plotting:
Trend Filter: The trend filter is plotted as a line that changes color based on the trend direction. The lower band is displayed for an upward trend, while the upper band is displayed for a downward trend.
Trend Cloud: The cloud plot represents the Senkou Span A and Senkou Span B lines. The cloud color changes based on the trend direction, providing a visual representation of the market trend.
Buy and Sell Signals: The indicator generates buy and sell signals based on the crossover of fast and slow moving averages, Z-Score values, trend direction, and other conditions. These signals are labeled on the chart, indicating potential entry points for traders.
The indicator generates buy and sell signals based on specific conditions, including the intersection of fast and slow moving averages, Z-Score values, trend direction, and more.
Buy signals are described as a "buy signal" on the chart, which indicates potential entry points for buy trades.
Sell signals are described as a "sell signal", which indicates potential entry points for sell trades. The signals in light color represent that they are signals in the opposite direction of the cloud that can be considered as exit points

Engulfing Pattern BUY and SELL SystemThis indicator is based on multiple parameters such as the Open, High, Low, and Close of candles. We add confluences such as SMMA crossovers, engulfing candles, and the number of pips that it has moved from it.
The main parameter is the DFS (Distance from SMMA). This will adjust the number of signals you'll get. This parameter is calculated based on the Open price of the signal bar and the 50 SMMA price. If the difference between these two values is greater than the input value, it will not be considered a signal.
The buy/sell signal consists of the following conditions:
1. Engulfing Candle based on conditions
2. SMMA crossover (21 and 50 periods)
3. For BUYS, the RSI value is greater than 49. For SELLS, the RSI value is less than 51.
4. Open price of the signal bar is less/greater than the 50 SMMA for SELLS/BUYS respectively.
5. DFS value is less than or equal to the input value
We recommend backtesting this on FX Pairs, and metals such as Gold. It is not well suited for Crypto or Indices.
RSI-Instant-TA 3.69 by SimpsTAHow can this indicator benefit you?
Are you familiar with the RSI (Relative Strength Index), which is a commonly used indicator? Let me explain how it works in simpler terms. When the RSI is below 30 (considered oversold), it may be a signal to buy, and when it's above 70 (considered overbought), it may be a signal to sell. To confirm these signals, you can look for the RSI line crossing a moving average line while forming a higher high or lower low. I usually use a 1-hour timeframe (TF) for analysis but also glance at lower timeframes for better market understanding.
This indicator combines different averages of the RSI line, including the most important one, which is the RSI line averaged from 7 different timeframes. This averaging helps you gain a clearer understanding of what's happening across those timeframes.
To ensure you don't miss important market moments, you can set up predefined alerts using this indicator. However, it's always important to visually verify these alerts before taking any action.
What is what?
What do the different parts of the indicator represent and where does the data for plotting the lines come from?
1) THICK RED/GREEN OSCILLATING RSI LINE:
This line is a visual representation of the RSI (Relative Strength Index) calculated by averaging the RSI values from 7 different timeframes. It moves between the oversold and overbought regions while intersecting other simplified averaged RSI lines. The data used for plotting these line is derived from the RSI values calculated based on price movements across different timeframes.
2) THICK WHITE RSI LINE:
The thick white line is a slightly smoothed average of the regular RSI line (thin white line). It helps reduce the noise and volatility of the RSI line, making it easier to interpret.
3) TWO OSCILLATING RED/GREEN LINES WITH RED/GREEN BACKGROUND FILL:
These lines are further averages of the normal RSI line, providing a smoother oscillating baseline. When the thick white line or thick red/green line crosses this baseline, it typically indicates a change in direction.
4) BIG TRIANGLE WITH RED/GREEN VERTICAL BG LINE:
This element is used to create an alert. It serves as a visual signal when the market is likely to change direction. Many users find this feature particularly useful. (I pretty much use just this one)
5) SMALL TRIANGLE AND SMALL CIRCLE WITH RED/GREEN VERTICAL BG LINE:
These elements, although visually distinct, serve a similar purpose. They are used when a good entry opportunity has been missed, but there is still a desire to enter the position. They can also be helpful for re-entries into a position.
6) YELLOW HORIZONTAL LINE:
The yellow horizontal line represents the middle RSI line with a value of 50. It acts as a reference point for determining whether the RSI is in the overbought or oversold region.
7) TWO WHITE HORIZONTAL LINES:
These white horizontal lines represent the top and bottom RSI lines with values of 30 and 70, respectively. They serve as thresholds for identifying oversold (below 30) and overbought (above 70) conditions.
How to use this indicator effectively:
SETTING ALARMS:
To begin, familiarize yourself with setting alerts in TradingView. Here's how I usually set mine:
a) Choose the indicator name from the dropdown menu.
b) Select either a BUY or SELL TRIANGLE as the alert marker.
c) Set a value greater than 0 (this is necessary for the alert to trigger).
d) Opt for the alert to occur once per bar.
e) Write a description that you will recognize.
f) Choose the type of notification you prefer.
g) You're all set!
HOW TO READ THE LINES:
a) The baseline consists of two oscillating red/green lines (3) with a background fill.
b) When the thick red/green line (1) or the thick white line (2) is above the baseline, it indicates a BUY signal. If they are below the baseline, it signifies a SELL signal.
c) Confirm the signal by observing whether the thick red/green line (1) or the thick white line (2) form a Lower High (LH) as a SELL signal or a Higher Low (HL) as a BUY signal. It can occur before crossing baseline (3), so consider having ALERTS that support this.
d) Additionally, consider the vertical background colors from alerts as supplementary confirmation.
e) When the lines appear messy and there is no clear indication due to excessive zig-zagging through the baseline, it typically suggests that the market will continue its previous movement without any significant changes.
MY PREFERRED WORKFRAME:
I recommend using a 5-frame window, which includes the following timeframes:
3-minute TF (fine tuned entry)
13-minute TF (to understand 3minTF better)
30-minute TF (to understand 1h TF better)
1-hour TF (the most important one - looking for HL/LH on (1) or (2) and/or their crossings the baseline (3))
1-day TF (for a broader perspective on the market - you certainly wont do LONGS if market broke certain support)
Buy/Sell examples
To provide you with a better understanding, let's consider some examples of BUY and SELL signals using this indicator.
1st TRADING EXAMPLE:
This example is for those who want to take advantage of every market turn to maximize their gains. Please remember to rest and sleep; this approach may not be suitable for everyone.
Initially, the data might seem overwhelming, but as you become familiar with the meaning behind specific situations, it becomes less daunting. Let me guide you through what you see in the picture:
The UPPER WINDOW shows a BTC chart with marked positions and the gains you would have achieved by following the indicator's signals.
The LOWER WINDOW displays this indicator with my comments, explaining what is happening in the marked areas (circles).
You can view the example here:
To implement this approach, you need to set alerts on the 1-hour timeframe (TF) using the following options: BUY/SELL TRIANGLE, BUY/SELL triangle, and BUY/SELL circle. These alerts will send you notifications every few hours. When you receive a notification, visually assess the situation (consider going long, short, or exiting) based on the detailed criteria explained earlier.
2nd TRADING EXAMPLE:
This example is for those who prefer to have more free time and only react when there is an obvious market change, with more than a day or two between actions (going long, short, or exiting).
Here's what you see in the picture:
The UPPER WINDOW displays a BTC chart with marked positions and the gains you would have achieved by following the indicator's signals. As you can see, these positions are open for several days leaving you lots of time to rest.
The LOWER WINDOW shows this indicator with circles, highlighting the situations that prompted the actions. By now, you should be familiar with the rules.
You can view the example here:
To implement this approach, set alerts on the 1-hour timeframe (TF) for when the RSI AVG crosses the Slowest Line (select it from the dropdown menu). When you receive a notification, don't take immediate action; instead, turn on another alert (BUY/SELL triangle ALERT). If the RSI AVG is below the Slowest Line, choose the SELL triangle; if it's above, select the BUY triangle. Wait for the RSI AVG to return close to the Slowest Line for confirmation.
This approach will result in two to three notifications per day, allowing you to relax in the meantime.
******
PRO TIP!
Try not to constantly stare at the charts and this indicator. Instead, look and react only when the alerts are triggered. Remember, the market won't change direction without triggering those alerts (provided they are set correctly). This will save you a significant amount of time and stress.

Oscillator Toolkit (Expo)█ Overview
The Oscillators Toolkit stands at the forefront of technical trading tools, offering a comprehensive suite of sophisticated, adaptive, and unique oscillators. This toolkit has been thoughtfully designed to cater to all trading styles, ensuring versatility and utility for every trader. The toolkit features our flagship oscillators, including the WaveTrend Momentum, Leading RSI, Momentum Oscillator, and Bellcurves. Furthermore, it offers many great features such as trend recognition, market impulses, and trend changes; all consolidated into a single, easy-to-use indicator.
Access to these high-quality oscillators and tools can elevate your trading strategy, providing you with insightful market analysis and potential trading opportunities. In addition, these tools help traders and investors to identify and interpret various market trends, momentum, and volatility patterns more efficiently.
The Oscillator toolkit works in any market and timeframe for discretionary analysis and includes many oscillators and features:
█ Oscillators
WaveTrend Momentum
The WaveTrend Momentum oscillator is a significant component of the toolkit. It factors in both the direction and the momentum of market trends. The waves within this system are both quick and responsive, operating independently to offer the most pertinent insights at the most opportune moments. Their rapid response time ensures that traders receive timely information, which is essential in the fast-paced, dynamic world of trading.
Example of how to use the WaveTrend Momentum Oscialltor
The WaveTrend Momentum is proficient at identifying trend reversals and pullbacks, allowing traders to enter or exit trades at optimal moments.
Leading RSI
The Leading Relative Strength Index (RSI) is a type of momentum oscillator that is commonly used in technical analysis to predict price movements. As the name suggests, it is an advanced form of the traditional Relative Strength Index (RSI), and it provides traders with more timely signals for market entries and exits.
The Leading RSI works on similar principles but is designed to provide signals ahead of the traditional RSI. This is achieved through more advanced mathematical modeling and calculations, which aim to identify shifts in market momentum before they happen. It takes into account not only the current price action but also considers historical data in a way that can foresee changes in trend directions.
Example of how to use the Leading RSI
The Leading RSI is an enhanced version of the traditional Relative Strength Index, offering more timely indications of divergences and overbought or oversold market conditions.
Momentum Oscillator
This oscillator measures the amount that a security's price has changed over a given time span. It is an excellent tool for understanding the strength of a trend and its potential endurance. When the momentum oscillator rises, it suggests that the price is moving upwards and vice versa.
The Momentum Oscillator is an advanced technical analysis tool that helps traders identify the rate of change or the momentum of the market. It is typically used to determine the strength or speed at which the price of an asset increases or decreases for a set of returns. This oscillator is considered 'fast-moving' and 'sensitive' because it responds quickly to changes in price momentum. The fast-moving nature of this oscillator helps traders to get early signals for potential market entry or exit points.
The Momentum Oscillator analyzes the current price compared to the previous price and adds two additional layers of analysis: 'Buy & Sell moves' and 'Extremes.'
Buy & Sell Moves: This layer of the oscillator helps identify the buying and selling pressure in the market. This can provide traders with valuable information about the possible direction of future price moves. When there is high buying pressure (demand), the price tends to rise, and when there is high selling pressure (supply), the price tends to fall.
Extremes: This layer helps to identify extreme overbought or oversold conditions. When the oscillator enters the overbought territory, it could indicate that the price is at a high and could potentially reverse. Conversely, if the oscillator enters the oversold territory, it could suggest that the price is at a low and could potentially rebound.
Example of how to use the Momentum Oscillator
The Momentum Oscillator is a sensitive and fast-moving oscillator that adapts quickly to price changes while keeping track of the long-term momentum, making it easier to spot buying or selling opportunities in trends.
Bellcurves
The Bellcurves indicator is a powerful tool for traders that uses statistical analysis to help identify potential market reversals and key support and resistance levels by leveraging the principles of statistical analysis to measure market impulses. The concept behind this tool is the normal distribution, also known as the bell curve, which is a fundamental statistical concept signifying that data tends to cluster around the average or mean value. The "impulses" in the market context refer to significant price movements driven by a high volume of trading activity. These are typically sharp and swift moves either upwards (bullish impulse) or downwards (bearish impulse). These impulses often signify a strong sentiment in the market and can result at the beginning of a new trend or the continuation of an existing one.
In effect, the Bellcurve indicator is designed to filter out minor price fluctuations or 'noise,' allowing traders to focus solely on significant market impulses. This makes it easier for traders to identify key market movements.
Example of how to use the Bellcurve
The Bellcurves uses the principles of statistical analysis to identify significant market impulses and potential market reversals.
█ Why is this Oscillator Toolkit Needed?
The Oscillator Toolkit is a vital asset for traders for several reasons:
Insight into Market Trends: The Oscillator Toolkit provides valuable insight into current market trends. This includes understanding whether the market is bullish (rising) or bearish (falling), as well as identifying potential future price movements.
Identification of Overbought or Oversold Conditions: Oscillators like those in the toolkit can help traders identify when an asset is overbought (potentially overvalued) or oversold (potentially undervalued). This can signal potential market reversals.
Confirmation of Price Patterns: The oscillators in the toolkit can confirm price patterns and trends. For example, if a price pattern suggests a bullish trend, an oscillator can help confirm this by showing rising momentum.
Versatility Across Markets and Timeframes: The Oscillator Toolkit is designed to work across a variety of markets, including stocks, forex, commodities, and cryptocurrencies. It's also effective across different timeframes, from short-term day trading to longer-term investment strategies.
Timely Trade Signals: By providing real-time insights into market conditions and price momentum, the Oscillator Toolkit offers timely signals for trade entries and exits.
Enhancing Trading Strategy: Every trader has a unique approach to the market. The Oscillator Toolkit, with its suite of different oscillators, provides a robust set of tools that can be customized to enhance any trading strategy, whether it's a trend following, swing trading, scalping, or any other approach.
█ Any Alert Function Call
This function allows traders to combine any feature and create customized alerts. These alerts can be set for various conditions and customized according to the trader's strategy or preferences.
█ How are the Oscillators calculated? - Overview
The Toolkit combines many of our existing premium indicators and new technical analysis algorithms to analyze the market. This overview covers how the main features are calculated.
WaveTrend Momentum
The WaveTrend Momentum oscillator operates at its core by comparing the current price to previous prices. If the current price is higher than the previous price, the oscillator value will rise, indicating an uptrend. Conversely, if the current price is lower than the previous price, the oscillator value will fall, indicating a downtrend. To make it unique and useful normalized weighting functions are added.
Leading RSI
The Leading RSI is based on the traditional Relative Strength Index, with an added exploration function that takes into account historical price movements.
Momentum Oscillator
The Momentum oscillator measures how quickly the price is changing, on average, over a certain period, relative to the variability of the price over that same period. It gives higher values when the price is changing rapidly in one direction and lower values when the price is fluctuating or changing more slowly. In addition, other functions, such as market extremes and buying/selling pressure, are factored in.
Bellcurves
The Bellcurves assume that some common historical price data is normally distributed, and once these patterns or moves are found the in the price data, a Bellcurve is formed.
█ In conclusion , the Oscillator Toolkit is an advanced, versatile, and indispensable asset for traders across various markets and timeframes. This innovative collection includes different oscillators, including the WaveTrend Momentum, Leading RSI, Momentum Oscillator, and the Bellcurves Indicator, each serving a unique function in providing valuable insights into the market's behavior.
-----------------
Disclaimer
The information contained in my Scripts/Indicators/Ideas/Algos/Systems does not constitute financial advice or a solicitation to buy or sell any securities of any type. I will not accept liability for any loss or damage, including without limitation any loss of profit, which may arise directly or indirectly from the use of or reliance on such information.
All investments involve risk, and the past performance of a security, industry, sector, market, financial product, trading strategy, backtest, or individual's trading does not guarantee future results or returns. Investors are fully responsible for any investment decisions they make. Such decisions should be based solely on an evaluation of their financial circumstances, investment objectives, risk tolerance, and liquidity needs.
My Scripts/Indicators/Ideas/Algos/Systems are only for educational purposes!
Script a pagamento

Precision Trader Indicator, v1.01Overview:
The PTI is a custom indicator designed to provide buy and sell signals based on price movements and volatility. It uses the Average True Range (ATR) to calculate stop levels and identifies potential trend changes.
Parameters:
The indicator has several customizable parameters that you can adjust according to your preferences. These parameters include:
- ATR Period (length): Determines the lookback period for calculating the ATR.
- ATR Multiplier (mult): Specifies the multiplier applied to the ATR to determine the stop levels.
- Show Buy/Sell Labels (showLabels): Allows you to choose whether to display buy/sell labels on the chart.
- Use Close Price for Extremums (useClose): Determines whether the indicator considers the close price for calculating extremums.
- Highlight State (highlightState): Enables highlighting of the long and short state on the chart.
Calculation:
1. ATR Calculation: The indicator calculates the Average True Range (ATR) using the specified length parameter and multiplies it by the ATR Multiplier (mult) to obtain the ATR value.
2. Long Stop Calculation: The long stop level is calculated based on the highest price over the specified length period (using either the high or close price, depending on the useClose parameter) minus the ATR value. It ensures that the long stop is below the recent highest point.
3. Short Stop Calculation: The short stop level is calculated based on the lowest price over the specified length period (using either the low or close price) plus the ATR value. It ensures that the short stop is above the recent lowest point.
4. Direction Calculation: The indicator determines the current direction based on the close price compared to the previous long stop and short stop levels. If the close price is above the previous long stop, the direction is set to 1 (indicating a bullish trend). If the close price is below the previous short stop, the direction is set to -1 (indicating a bearish trend). Otherwise, the direction remains unchanged.
Plotting:
The indicator plots several visual elements on the chart:
- Long Stop: Draws a line representing the long stop level.
- Long Stop Start: Plots a small circle marker indicating the start of a long stop (buy signal).
- Buy Label: Displays a "Buy" label near the long stop start marker.
- Short Stop: Draws a line representing the short stop level.
- Short Stop Start: Plots a small circle marker indicating the start of a short stop (sell signal).
- Sell Label: Displays a "Sell" label near the short stop start marker.
- Long State Filling: Fills the area between the mid price and the long stop line with a color (optional).
- Short State Filling: Fills the area between the mid price and the short stop line with a color (optional).
Alerts:
The indicator includes three types of alerts:
- PTI Direction Change: Triggers an alert when the PTI direction changes (from bullish to bearish or vice versa).
- PTI Buy: Triggers an alert when a buy signal occurs (long stop start).
- PTI Sell: Triggers an alert when a sell signal occurs (short stop start).
By using the PTI indicator, traders can monitor potential trend changes and receive alerts when buy or sell signals are generated based on price and volatility dynamics.
Please note that the interpretation and effectiveness of this indicator should be evaluated through rigorous backtesting and analysis before making any trading decisions.

5EMA BollingerBand Nifty Stock Scanner
What ?
We all heard about (well: over-heard) 5-EMA strategy. Which falls into the broader category of mean reversal type of trading setup.
What is mean reversal?
Price (or any time series, in fact) tries to follow a mean . Whenever price diverges from the mean it tries to meet it back.
It is empirically observed by some traders (I honestly don't know who first time observed it) that in Indian context specially, 5 Exponential Moving Average (5-EMA) works pretty good as that mean.
So whenever price moves away from that 5-EMA, it ultimately comes back and attain total nirvana :) Means: if price moved way higher than the 5EMA without touching it, then price will correct to meet it's 5-EMA and if price moved way lower, it will be uplifted to meet it's 5-EMA. Funny - but it works !
Now there are already enough social media coverage on this 5-EMA strategy/setup. Even TradingView has some excellent work done on these setups. Kudos to all those great souls.
So when we came to know about this, we were thinking what we should do for the community. Because it is well cover topic (specially in Indian context). Also, there are public indicators.
Then we thought why not come up with a scanner which will scan all the Nifty-50 constituent stocks and find out on the fly, real-time which all stocks are matching this 5-EMA setup and causing a Buy/Sell trade recommendation.
Hence here we are with the first version of our first scanner on the 5EMA setup (well it has some more masala than merely a 5-EMA setup).
Why?
Parts of why is already covered up.
Now instead of blindly following 5-EMA setup, we added the Bollinger band as well. Again: it's also not new. There are enough coverage in social media about the 5-EMA+BB strategy/setup. We mercilessly borrowed from all of these.
Suppose you have an indicator.
Now you apply the indicator in your chart. And then you need to (rock) and roll through your watchlist of Nifty-50 stocks (note: TradingView has no default watchlist of Nifty-50 stock by default - you have to create one custom watchlist to list all manually) to find out which all are matching the setup, need to take a note about the trade recomendations (entry, SL, target) and other stuffs like VWAP, Volume, volatility (Bollinger Band Width).
Not any more.
This scanner will track all the Nifty-50 stocks (technically: 40 stocks other than Banking stocks) and provide which one to Buy or Sell (if any), what's the entry, SL, target, where is the VWAP of the day, what's the picture in volume (high, low, rising, falling) and the implied volatility (using Bolling band width). Also it has a naive alerting mechanism as well.
In fact the code is there to monitor the (Future) OI also and all the OI drama (OI vs price and all the 4 stuffs like long build up, long unwinding, short covering, short buildup). But unfortunately, due to some limitations of the TradingView (that one can not monitor more than 40 `ta.security` call) we have to comment out the code. If you wish you can monitor only 20 stocks and enable the OI monitoring also (20 for stocks + 20 for their OI monitoring .. total 40 `ta.security` call).
How?
To know the divergence from 5-EMA we just check if the high of the candle (on closing) is below the 5-EMA. Then we check if the closing is inside the Bollinger Band (BB). That's a Buy signal. SL: low of the candle, T: middle and higher BB.
Just opposite for selling. 5-EMA low should be above 5-EMA and closing should be inside BB (lesser than BB higher level). That's a Sell signal. SL: high of the candle, T: middle and lower BB.
Along with we compare the current bar's volume with the last-20 bar VWMA (volume weighted moving average) to determine if the volume is high or low.
Present bar's volume is compared with the previous bar's volume to know if it's rising or falling.
VWAP is also determined using `ta.vwap` built-in support of TradingView.
The Bolling Band width is also notified, along with whether it is rising or falling (comparing with previous candle).
Simple, but effective.
Customization
As usual the EMA setup (5 default), the BB setup (20 SMA with 1.5 standard deviation), we provided option wherther to include or exclude BB role in the 5-EMA setup (as we found out there are two schools of thought .. some people use BB some don't. Lets make all happy :))
We also provide options to choose other symbols using Settings if they wish so. We have the default 40 non banking Nifty stocks (why non-banking? - Bank Nifty is in ATH :) .. enough :)). But if user wishes can monitor others too (provided the symbol is there in TradingView).
Although we strongly recommend the timeframe as 30 minutes , you can choose what's fit you most.
The output of the scanner is a table. By default the table is placed in the right-bottom (as we are most comfortable with that). However you can change per your wish. We have the option to choose that.
What is unique in it ?
This is more of an indicator. This is a scanner (of Nifty-50 stocks). So you can apply (our recommendation is in 30m timeframe) it to any chart (does not matter which chart it is) and it will show every 30 mins (which is also configurable) which all stocks (along with trade levels) to Buy and Sell according to the setup.
It will ease your trading activity.
You can concentrate only on the execution, the filtering you can leave it to this one.
Limitations
There is a build in limitation of the TradingView platform is that one can call only upto 40 securities API. Not beyond that. So naturally we are constraint by that. Otherwise we could monitor 190 Nifty F&O stocks itself.
30m is the recommended timeframe. In very lower (say 5m) this script tends to go out of heap (out of memory). Please note that also.
How to trade using this?
Put any chart in 30m (recommended) timeframe.
Apply this screener from Indicators (shortcut to launch indicators is just type / in your keyboard).
This will provide the Buy (shown in green color) or Sell (shown in red color) recommendations in a table, at every 30m candle closing.
Note the volume and BB width as well.
Wait for at least 2 5-minutes candles to close above/below the recommended level .
Take the trade with the SL and target mentioned.
Mentions
@QuantNomad. The whole implementation concept we mercilessly borrowed from him, even some of his code snippet we took it (after asking him through one of his videos comment section and seeking explicit permission which he readily granted within an hour). Thank You sir @QuantNomad. Indebted to you.
Monika (Rawat) ji: for reviewing, correcting, providing real time examples during live market hours, often compromising her own trading activities, about the effectiveness and usefulness of this setup. Thank You madam ji. Indebted to you.
There are innumerable contents in social media about this. Don't even know whom all we checked. Thanks to all of them.
Happy Trading (in stocks - isn't enough of Indices already?)
Disclaimer
This piece of software does not come up with any warrantee or any rights of not changing it over the future course of time.
We are not responsible for any trading/investment decision you are taking out of the outcome of this indicator.

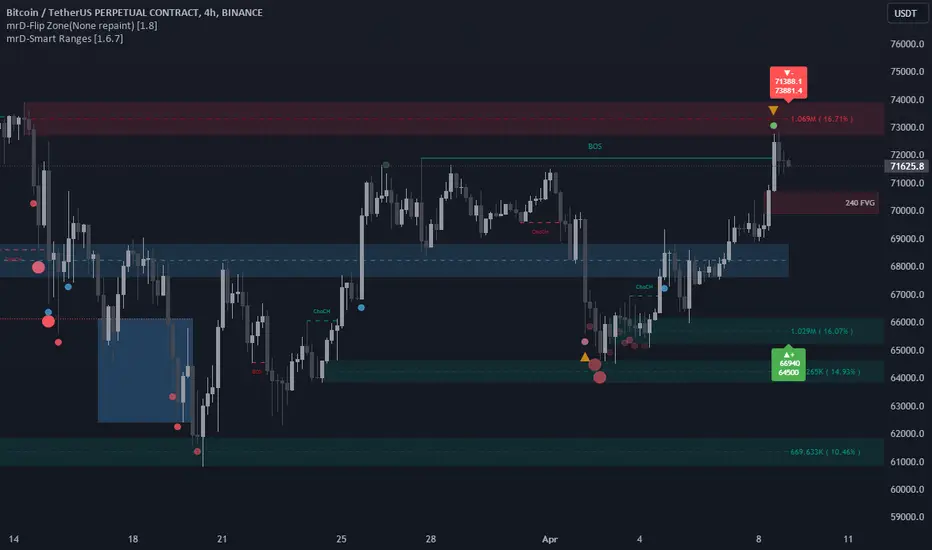
mrD-Smart RangesmrD-Smart Ranges aims to offer a complete strategy based on Order Blocks. Ranges signals based on order volume are highlighted, from which smart ranges are suggested to provide potential entries.
This script also includes warnings for each signal marked.
🔶 SETTINGS
Pair Strategy: Select the desired from the list. Change the chart to the one specified in the Strategy.
Current TF Order Blocks: Allows the user to select how many most recent Internal Order Blocks appear in the current time frame on the chart.
Order Block Filter: Allows the user to select how the script mitigates an Order Block.
Hide Overlap: Allows the user to display overlapping Order Blocks.
Show Metrics: Allows the user to display volume % metrics within the Order Blocks.
Show Volume Box: Allows the user to display buy/sell activity within Order Blocks.
High Timeframe: Allows the user to choose a higher or lower timeframe to find the Signals.
Show Failed Buy Sell: Allows the user to display the Signals.
Show HTF Box: Allows the user to display a higher or lower timeframe Order Blocks.
🔶 DETAILS
Order blocks are formed after a slight bearish order block, these can provide an opportunity to change polarity, thus acting as a potential support/resistance level.
A retest/retrace on the order block, combined with order volume between the current timeframe and from the higher timeframe will establish the conditions for smart ranges are suggested to provide potential entries.
🔶 USAGE
mrD-Smart Ranges aims to provide users with a minimalistic screen next to the optimal ranges to keep in mind to find trading setups as shown below.
Here we can see a suggested Sell range and display a label to confirm this range
Signal(s) that can be used for potential entries only during range retest are order blocks.
Users can search for more potential entry ranges based on larger timeframes in the settings: High Timeframe
In the image above, we can see that the price has generated potential orange and bearish entry signals. A confirmation signal with a red label is displayed on the chart when the price retests the Sell range.
Note: While range retests can still work well if they occur later in price action, it's best to look for signals only when price retests the range at the outset rather than retesting it. second price.
The logic of generating signal ranges using different rules is described below:
- Define order blocks in the current timeframe.
- Define the order blocks with the largest volume in the current timeframe.
- Define order blocks in larger timeframes in High Timeframe settings
- Define order blocks with the largest volume in larger timeframes in High Timeframe settings
Entry Range: The combination of the highest volume order blocks in the current timeframe and the highest volume order blocks in the larger timeframe.
🔶General disclaimer:
Trading stocks, futures, forex, options, ETFs, cryptocurrency, or any other financial instrument has huge potential rewards and risks.
You must be aware of the risks and willing to accept them to invest in stocks, futures, forex, options, ETFs, or cryptocurrencies.
Don't trade with money you can't afford to lose.
This is not an offer or an offer to Buy/Sell stocks, futures, Forex, options, ETFs, cryptocurrencies, or any other financial instrument.
Do not represent that any account will or is likely to achieve profit or loss of any kind.
The past performance of any trading system or method is not necessarily indicative of future results.
My Scripts/Indicators/Ideas/Algos/Systems are only for educational purposes!
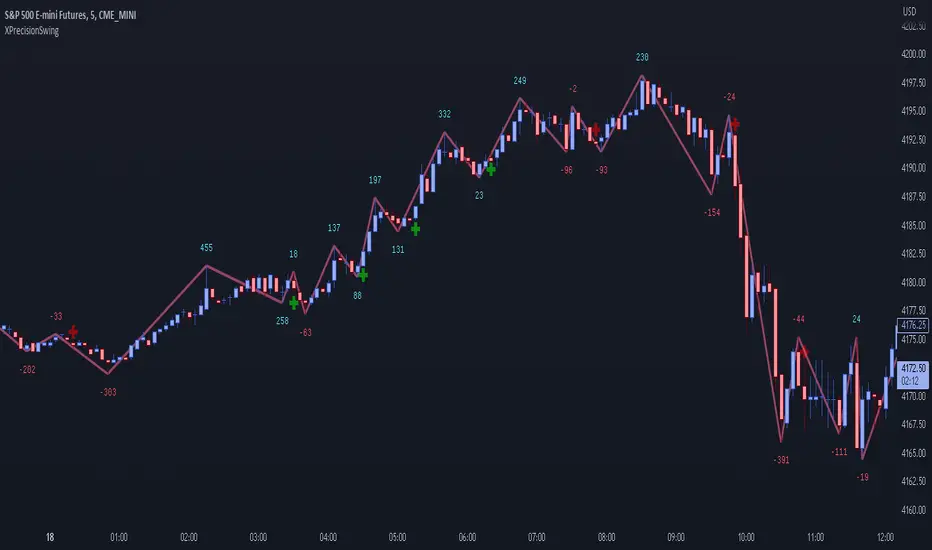
XPrecisionSwing (XPS)* XPrecisionSwing (XPS) Indicator *
Is a visual representation of the Forces of Supply / Demand in the markets in the form of UP and DOWN waves. The Supply / Demand (denoted by a number on top or below the wave line) is computed using the *MBox Precision Supply / Demand* algorithm. These numbers diligently show the forces of Supply and Demand moving price in the markets. The algorithm for computing the numbers on the top and bottom of the wave lines measures the strength of the Supply / Demand. It is this algorithm that makes this indicator unique as it gives an accurate representation of the forces pulling the market up and down. When forces oppose each other, meaning when the direction of price does not agree with the direction of the Supply or Demand it creates a divergence and an opportunity in the markets. These situations are called BUY / SELL Imbalances. Explanation about this below.
* WHAT THE SCRIPT DOES *
The XPrecisionSwing indicator draws swing waves lines going up and down. These waves lines are representative of Supply and Demand. Waves going up are Demand, while waves going down are Supply. The strength of the Supply / Demand corresponds to the number drawn either on top of the wave line or below it. The numbers drawn on the chart are powered by the *MBox Precision Supply / Demand* algorithm, which are representative of the Forces of Supply / Demand in the markets. This is not just volume added up like in a regular zig zag indicator, since volume alone does not show Supply / Demand, and regular volume will not show BUY / SELL Imbalances as depicted by XPrecisionSwing. Volume summated will not show both positive and negative numbers on the chart. Having Supply / Demand split into both positive and negative numbers allows us to see BUY / SELL Imbalances, which can be a very powerful divergence. Information on how these numbers are computed are in the "HOW IT WORKS" section.
The numbers drawn on the chart can be either negative or positive. Positive relates to Demand, while negative relates to Supply. In this manner the strength of Supply and Demand can be gauged in each wave. If the price goes up but the number is negative (More Supply) it is a divergence and called a SELL Imbalance. This means there was more Supply even though price went up. It is important to pay attention to these scenarios, as often it can be indicative of NO DEMAND. Conversely. if the price goes down but the number is positive (No Demand) it is a divergence and is called a BUY Imbalance. This means there was more Demand even though price went down. This is indicative of NO SUPPLY. As such, it now becomes possible to know when there is a sign of Supply, Demand, No Supply, No Demand, Supply Exhaustion, and Demand exhaustion. Supply occurs when the negative numbers on the charts begin to increase (more negatively). Demand occurs when the positive numbers on the chart begin to increase (more positively). A Supply Exhaustion pattern happens when the price is starting to move down more slowly, while Supply is decreasing, and Demand is increasing. This means that the behavior of the market is changing and also a signal to look to reverse positions. A Demand Exhaustion pattern happens when the price is starting to move up more slowly, while Demand is decreasing, and Supply is increasing. The behavior of the market here is also changing.
* HOW IT WORKS *
- Technical Details for the Numbers on the Swing -
The numbers on the chart represent Supply / Demand. Supply or Demand is determined by analyzing the movement of price and quantity of volume.
When price goes up and is combined with an increase in volume it is Expansion of Demand.
(Positive Numbers get larger)
However if price goes up and is combined with a decrease in volume it is Contraction of Demand.
(Positive Numbers get smaller)
When price goes down and is combined with an increase in volume it is Expansion of Supply.
(Negative Numbers get larger)
However if price goes down and is combined with a decrease in volume it is Contraction of Supply.
(Negative Numbers get smaller)
- Technical Details for the Swing -
The way XPrecisionSwing draws the swings is fractal in nature, which make it very convenient and easier to use over the traditional zig zag indicator. The traditional zig zag indicator uses a tick reversal which needs to be adjusted every time you change time frames. However, with XPrecisionSwing you do not have to change any settings every time you load a different time frame since it will adjust to any time frame you are loading. How the swing is drawn is explained below.
XPrecisionSwing uses 3 bars (by default) to define a swing
This parameter can be adjusted. Can be 1, 2, 4 bars, etc...
Swings are always drawn using High / Low of the bar
- Rules -
To start upswing, bar high needs to be higher than previous 3 candle highs
To start downswing, bar low needs to be lower than previous 3 candle lows
If in upswing, a higher high will continue the upswing
if in downswing, a lower low will continue the downswing
- Exceptions -
If outside bar (both high and low exceeds previous 3 bars) swing will continue in current direction
- Swing Confirmation -
Swing wave line in progress (unconfirmed) is denoted by a brown box around the swing number
Once the brown box disappears, that swing wave and number is confirmed
* HOW TO USE IT *
As the numbers on the down waves increase (negatively), this shows that the bears have taken control of the markets. Conversely, as the numbers on the up waves increase (positively), this shows the bulls have taken control of the markets. Whoever is in control is the direction you generally want to place your trades in. When you see an increase in Supply (numbers on down wave) accompanied with a decrease in Demand (numbers on up wave) this shows a Supply + Demand Exhaustion Pattern. This is stronger than if you only see an increase in Supply without a decrease in Demand.
- The Buy / Sell Imbalances -
If you see a positive blue number on the bottom of a DOWN Wave, this means that there was more buying than selling even though price moved down.
If you see a negative red number on the top of an UP Wave, this means that there was more selling than buying even though price moved up.
Both of these cases signify and imbalance and a divergence.
* EXAMPLE AND USE CASES *
- Sell Imbalance Example -
If you see a large negative number with a lower low on a down wave, and then the next up wave is a lower high also with a negative number it shows that there is only Supply flooding the market and no sign of Demand. This is a very powerful combo.
- Buy Imbalance Example -
If you see a large positive number with a higher high on an up wave, and then the next down wave is a higher low also with a positive number it shows that there is only Demand flooding the market and no sign of Supply. This is a very powerful combo.
- Supply Exhaustion example -
If you see price movement struggling to make newer lows and the Supply numbers on the down waves are decreasing, while the Demand numbers on the up waves are increasing this is indicative of a *Change of Behavior*, and that the market is showing signs of reversal.
- Break out on Demand example -
If you see price has been ranging and now the numbers on the UP waves begin to increase while breaking out of a previous area of resistance, it is a good sign that the movement is backed by the strength coming from the Demand.
* BUY / SELL IMBALANCE ALERTS *
The Green / Red crosses on the chart show exactly where the Buy / Sell Imbalance Alerts trigger.
These will NEVER repaint! The crosses can be hidden in Styles if you wish to.
Alerts can be set very easily with the instructions below.
1. Right Click Chart -> Add Alert...
(Ignore Caution Warning. These alerts will *ONLY* trigger on Confirmed BUY / SELL Imbalances and will NOT repaint)
2. Select Condition to be "XPrecisionSwing"
3. Select "Buy Imbalance" or "Sell Imbalance"
4. Select "Greater Than" with Value = 0
5. Options set "Once Per Bar"
6. Customize Any other Alert Options you want
* WHAT MAKES IT ORIGINAL *
XPrecisionSwing gives an inside look into the markets by showing price movements as a series of waves going up and down with their corresponding Supply / Demand numbers associated with each wave. Reading the numbers shows the strength of Supply / Demand. The bigger the number the stronger the Supply / Demand is. The smaller the number the weaker the Supply / Demand is. It becomes possible to see where Supply / Demand comes in, along with Exhaustion of Supply / Demand to spot opportunities to place trades. The Buy / Sell Imbalances show imbalances where price movement and the direction of the Supply / Demand diverge to create potential opportunities as well.
* AUTHOR *
This script is published by MBoxWave LLC
RiverFlow ADX ScreenerRiverFlow ADX Screener, Scans ADX and Donchian Trend values across various Timeframes. This screener provides support to the Riverflow indicator. Riverflow concept is based on Two indicators. Donchian Channel and ADX or DMI.
How to implement?
1.Donchian Channel with period 20
2. ADX / DMI 14,14 threshold 20
Entry / Exit:
1. Buy/Sell Signal from ADX Crossovers.
2. Trend Confirmation Donchian Channel.
3. Major Trend EMA 200
Buy/Sell:
After a buy/sell is generated by ADX Crossover, Check for Donchian Trend. it has to be in same direction as trend. for FTT trades take 2x limit. for Forex and Stocks take 1:1.5, SL must be placed below recent swing. One can use Riverflow indicator for better results.
ADX Indicator is plotted with
Plus: Green line
Minus: Red Line
ADX strength: plotted as Background area.
TREND: Trend is represented by Green and Red Area around Threshold line
Table:
red indicates down trend
green indicates up trend
grey indicates sideways
Weak ADX levels are treated sideways and a channel is plotted on ADX and PLUS and MINUS lines . NO TRADES are to be TAKEN on within the SIDEWAYS region.
Settings are not required as it purely works on Default settings. However Donchian Length can be changed from settings.
Timeframes below 1Day are screened. Riverflow strategy works on timeframe 5M and above timeframe. so option is not provided for lower timeframes.
Best suits for INTRADAY and LONG TERM Trading

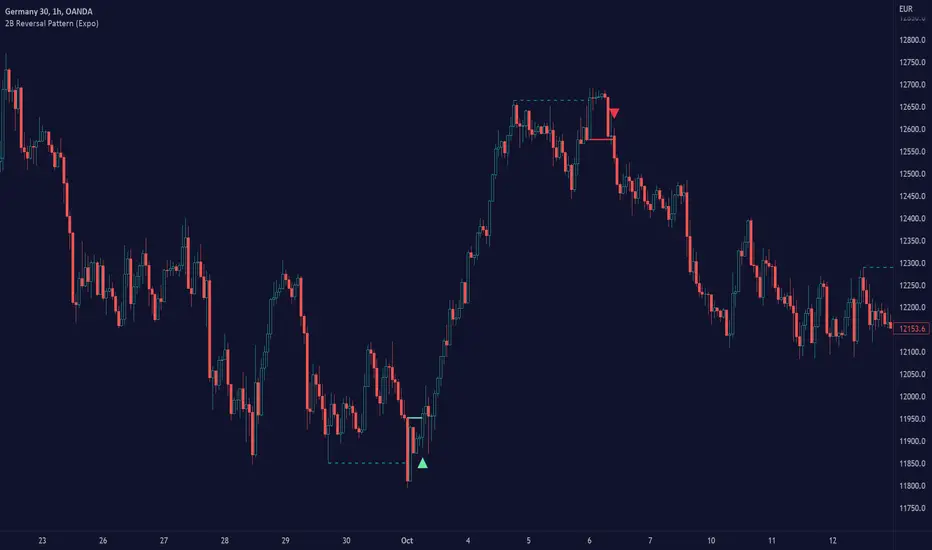
2B Reversal Pattern (Expo)█ Overview
The 2B reversal pattern , also called the "spring pattern", is a popular chart pattern professional traders use to identify potential trend reversals. It occurs when the price appears to be breaking down or up and then suddenly bounces back up/down, forming a "spring" or "false breakout" pattern. This pattern indicates that the trend is losing momentum and that a reversal is coming.
In a bearish market , the "spring pattern" occurs when the price of an asset breaks below a support level, causing many traders to sell their positions and causing the price to drop even further. However, the selling pressure eases at some point, and the price begins to rebound, "springing" back above the support level. This rebound creates a long opportunity for traders who can enter the market at a lower price.
In a bullish market , the "spring pattern" occurs when the price of an asset breaks above a resistance level, causing many traders to buy into the asset and drive the price up even further. However, the buying pressure eases at some point, and the price begins to decline, "springing" below the resistance level. This decline creates a selling opportunity for traders who can short the market at a higher price.
█ What are the benefits of using the 2B Reversal Pattern?
The benefits of using the 2B Reversal pattern as a trader include identifying potential buying or selling opportunities with reduced risk. By waiting for the price to "spring back" to the initial breakout level, traders can avoid entering the market too soon and minimize the risk of potential losses.
█ How to use
Traders can use the 2B reversal pattern to identify reversals. If the pattern occurs after an uptrend, traders may sell their long positions or enter a short position, anticipating a reversal to a downtrend. If the pattern occurs after a downtrend, traders may sell their short positions or enter a long position, anticipating a reversal to an uptrend.
█ Consolidation Strategy
First, traders should identify a period of price consolidation or a trading range where the price has been trading sideways for some time. The key feature of the "spring pattern" is a sudden, sharp move downward/upwards through the lower/upper boundary of this trading range, often accompanied by high volume.
However, instead of continuing to move lower/higher, the price then quickly recovers and moves back into the trading range, often on low volume. This quick recovery is the "spring" part of the pattern and suggests that the market has rejected the lower/higher price and that buying/selling pressure is building.
Traders may use the "spring pattern" as a signal to buy/sell the asset, suggesting strong demand/supply for the stock at the lower/higher price level. However, as with all trading strategies, it is important to use other indicators and to manage risk to minimize potential losses carefully.
-----------------
Disclaimer
The information contained in my Scripts/Indicators/Ideas/Algos/Systems does not constitute financial advice or a solicitation to buy or sell any securities of any type. I will not accept liability for any loss or damage, including without limitation any loss of profit, which may arise directly or indirectly from the use of or reliance on such information.
All investments involve risk, and the past performance of a security, industry, sector, market, financial product, trading strategy, backtest, or individual's trading does not guarantee future results or returns. Investors are fully responsible for any investment decisions they make. Such decisions should be based solely on an evaluation of their financial circumstances, investment objectives, risk tolerance, and liquidity needs.
My Scripts/Indicators/Ideas/Algos/Systems are only for educational purposes!
Volume composition / quantifytools— Overview
While net volume is useful information, it can be a blunt data point. Volume composition breaks down the content of volume, allowing a more detailed look inside each volume node. Volume composition consists of the following information:
Total volume (buy and sell). By default gray node.
Dominating volume (buy or sell). By default dark green/dark red node.
Dominating active volume (buy or sell). By default light green/light red node.
Dominating volume as percentage of total volume.
Dominating active volume as percentage of total active volume.
Buy and sell volume is defined by volume associated with lower timeframe up/down moves. This classification is further broken down to passive/active, standing for decreasing/increasing volume, e.g. a move up with volume higher than previous bar volume = active buy volume, a move up with volume lower than previous bar volume = passive buy volume.
Volume data is fetched from a lower timeframe that is automatically adjusted to fit the timeframe you're using. By default, the following settings are applied:
Charts <= 30 min: 1 minute timeframe
Charts > 30 min & <= 3 hours : 5 minute timeframe
Charts > 3 hours & <= 8 hours : 15 minute timeframe
Charts > 8 hours & <= 1D: 1 hour timeframe
Charts > 1D & <= 3D : 2 hour timeframe
Charts > 3D: 4 hour timeframe
Timeframe settings can be changed via input menu. The lower the timeframe, the more precision you get but with the cost of less historical data and slower loading time. Users can also choose which source to use for determining buy/sell volume, e.g. using close as source, a close that is higher than previous close would be considered as buy volume. This could be replaced with OHLC4 for example, resulting in a volume direction based on OHLC average.
Volume composition of current chart can also be replaced with any other chart volume composition:
— Visuals
Breakdown of visual elements:
1. Symbol and timeframe used for volume composition calculations. By default the chart that is viewed and automatically selected lower timeframe.
2. Dominating volume threshold exceeded. Can be defined via input menu, 70% of total volume by default.
3. Dominating volume as percentage of total volume. Plotted below volume nodes, without % symbol.
4. Dominating active volume, + or - symbol, standing for buy and sell. Plotted below dominating volume percentage. When dominating volume and dominating active volume sides are in a disagreement (e.g. dominating volume is on buy side while dominating active volume is on sell side) this symbol will appear inside brackets, (+) or (-).
5. Dominating active volume as percentage of total active volume. Plotted below +/- symbol.
6. Dominating active volume threshold exceeded. Can be defined via input menu, 70% by default.
Dominating volume & active volume percentages can be rounded to single numbers to avoid clutter caused by overlapping values. The percentage values will be rounded to closest single number value, e.g. dominating volume percentage at 54% = 5, dominating volume percentage at 55% = 6.
Volume anomalies can be highlighted on the chart with a color for studying the events and their past implications in greater detail. Available anomalies for highlights are the following:
Buy volume threshold exceeded
Sell volume threshold exceeded
Active buy volume threshold exceeded
Active sell volume threshold exceeded
Volume & active volume divergence
— Practical guide
Volume is arguably one of the most important data points as it directly relates to liquidity. High volume can be an indication of strength (price likely to continue moving) or absorption (price likely to halt/turn). Same applies to active volume, but with an element of aggression. High active volume serves as an indication of exuberance or otherwise forceful transacting, like stop losses triggering. With these principles in mind, the composition of volume allows distinguishing potentially important events.
Example #1 : Identifying areas of trapped market participants
Often when volume spikes distinctively, we can make the case that price has found sufficient liquidity to halt/turn. Since we know which side was absorbed, in what quantity and type (passive/active), we can identify areas of trapped market participants. In such scenarios, the higher the dominant active volume and volume spike itself, the better.
Example #2 : Identifying a healthy trend
A healthy trend is one that has an active and consistent bid driving it. When this is the case, it can be seen in consistently supportive active volume.
Example #3 : Identifying inflection points
When dominant side of volume and dominant side of active volume diverge, something is up. A divergence often marks an area of indecision, hinting an imminent move one way or the other.

Volume CVD and Open Interest HeatmapTaking Volume and Open Interest data to the next level of visualization I created a 'heatmap'. The indicator uses a colour gradient and plots boxes from the source candle to the current candle with one of the following data sources:
- Volume - the total volume of transactions, buys and sells
- Up Volume - the total volume from buys only
- Down Volume - the total volume from sells only
- Up/Down Volume (Net) - the difference in the Buy Volume and Sell Volume
- Cumulative Delta - the sum of the up/down volume for the previous 14 bars
- Cumulative Delta EMA - a smoothed average of the sum of the up/down volume for the previous 14 bars, over a 14 period EMA
- Open Interest - a user defined ticker, whose value is added to the plot, while this is designed to be used with Open Interest tickers, you can actually choose any ticker you want, perhaps you want to see DXY while charting Bitcoin!
You can define the lookback period, though you should make sure your timeframe for volume source data, is high enough to accommodate the lookback. TradingView will only fetch 5000 candles worth of data, so at 1 min volume data, you can only lookback 83 hours.
While similar, Volume and Open Interest are not the same. To me the simplest explanation is Volume shows the trades that have been executed and the buy/sell direction, while Open Interest shows the value of open trades that are yet to be completed.
Volume shows strength, sentiment and volatility .
Open Interest does not show direction, but does indicate momentum and liquidity in the market.
With this novel way of visualizing these, you can also now determine where all that liquidity and positions came from and therefore might have resting liquidity below.

Volume CVD and Open InterestVolume, Cumulative Delta Volume and Open Interest are great indications of strength and sentiment in the market. Until now they have required separate indicators, but this indicator can show them all.
With a clean and aesthetic plot, this indicator has the option to choose the data source:
- Volume - the total volume of transactions, buys and sells
- Up Volume - the total volume from buys only
- Down Volume - the total volume from sells only
- Up/Down Volume (Net) - the difference in the Buy Volume and Sell Volume
- Cumulative Delta - the sum of the up/down volume for the previous 14 bars
- Cumulative Delta EMA - a smoothed average of the sum of the up/down volume for the previous 14 bars, over a 14 period EMA
- Open Interest - a user defined ticker, whose value is added to the plot, while this is designed to be used with Open Interest tickers, you can actually choose any ticker you want, perhaps you want to see DXY while charting Bitcoin!
There are several customization features for the colour of the plot, with a nice gradient colouring from high to low. You can choose the lookback which defines only the highest and lowest values for the colour gradient. There is also an option for how the Open Interest value is determined, based on Close, Open or differences between previous values.
While similar, Volume and Open Interest are not the same. To me the simplest explanation is Volume shows the trades that have been executed and the buy/sell direction, while Open Interest shows the value of open trades that are yet to be completed.
Volume shows strength, sentiment and volatility.
Open Interest does not show direction, but does indicate momentum and liquidity in the market.
