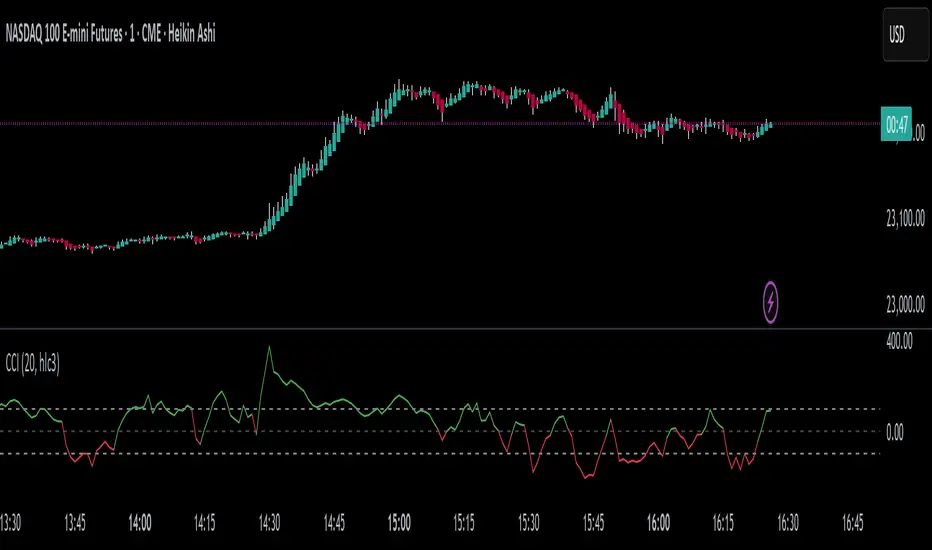
Multi. Exchange CCIBasic CCI script that takes the average close price data across popular crypto exchanges.
Cerca negli script per "CCI"
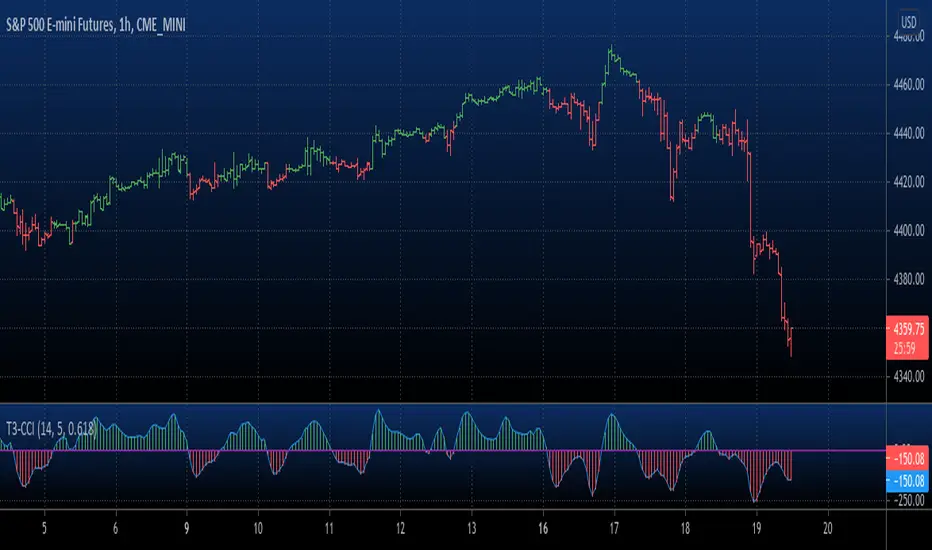
FX Sniper: T3-CCI Strategy With Alerts This simple indicator gives you a lot of useful information - when to enter, when to exit
and how to reduce risks by entering a trade on a double confirmed signal.
You can use in the xPrice any series: Open, High, Low, Close, HL2, HLC3, OHLC4 and ect...
Added Alerts when signal changes.
FX Sniper: T3-CCI Strategy Backtest This simple indicator gives you a lot of useful information - when to enter, when to exit
and how to reduce risks by entering a trade on a double confirmed signal.
You can use in the xPrice any series: Open, High, Low, Close, HL2, HLC3, OHLC4 and ect...
You can change long to short in the Input Settings
Please, use it only for learning or paper trading. Do not for real trading.

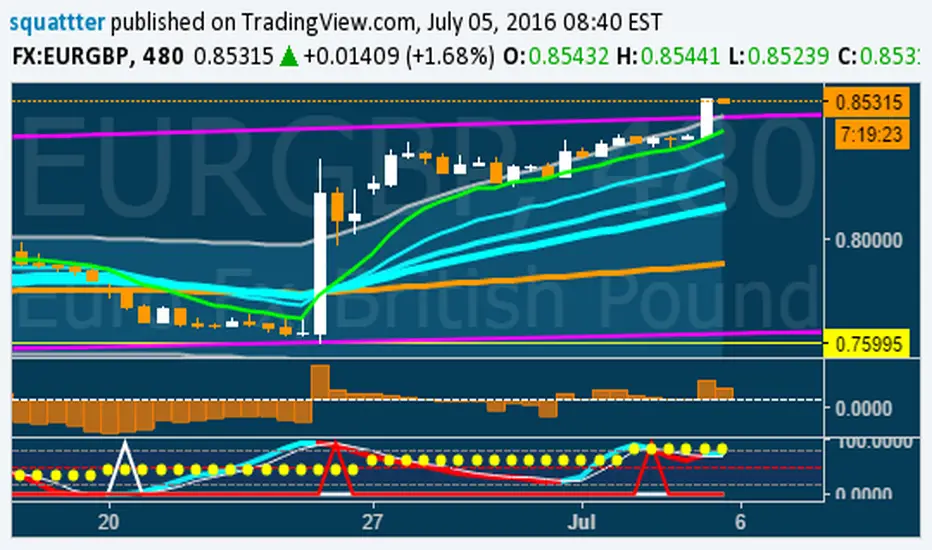
Stochastic CCI MTF w/ UP/DOWN colours - squattterStoch CCI has a nicer divergence than Stoch RSI.
Enjoy!
Stochastic CCI MTF w/ UP/DOWN colours - squattterStoch CCI has nicer divergences than Stoch RSI.
Enjoy.

Volume CCIHere simply calculate the CCI of the volume, this will use to measure the strength of the trend of the volume
Background:
I think the volume as the price could be represented by candles or other graphic to use indicators and strengthen their analysis, due to lack of registration of this it is first necessary to calculate a volume graph, if the candle traditionally negative price brand then the total volume is taken as negative for the period. An example of this is in the On Balance Volume indicator, the problem is that there is no way to analyze the volume using other methods. An approximate volume of the spread could be the use of the price spread to make a synthetic behavior
As traditionally is observed if Open> Close then the candle and the volume will be negative and vice versa; the next step, is estimate the amounts of the candle necessary to calculate the ratio to use for the volume and thus idealize their spread within the candle:
VLOW = Volume x Low
vHigh = x High Volume
VOpen = vClose
vClose = Volume x Close
This graph can show a stable synthetic form of fluctuations in the volume trend affected by price.
ideas, comments and suggestions (or corrections).They are always welcome


FX Sniper: T3-CCI Copy Strategy This simple indicator gives you a lot of useful information - when to enter, when to exit
and how to reduce risks by entering a trade on a double confirmed signal.
You can use in the xPrice any series: Open, High, Low, Close, HL2, HLC3, OHLC4 and ect...
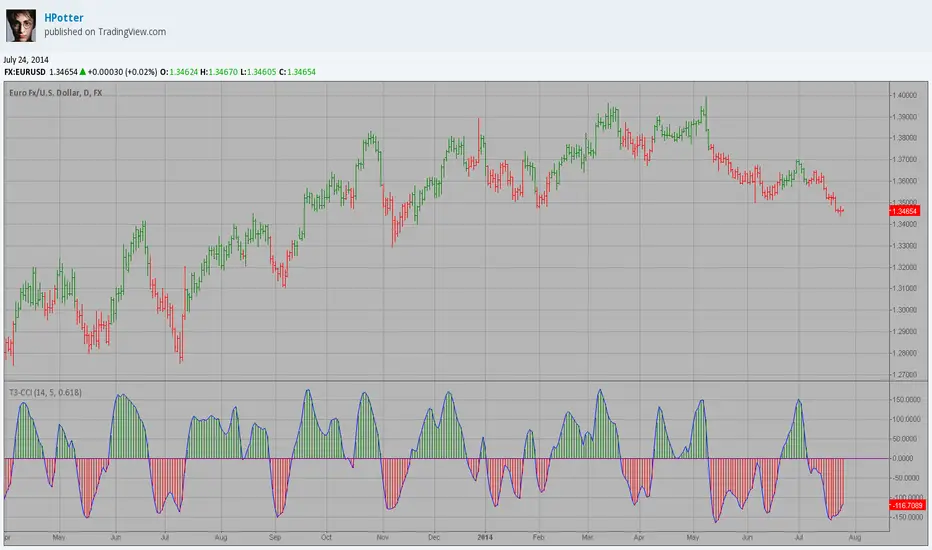
FX Sniper: T3-CCIThis simple indicator gives you a lot of useful information - when to enter, when to exit
and how to reduce risks by entering a trade on a double confirmed signal.
You can use in the xPrice any series: Open, High, Low, Close, HL2, HLC3, OHLC4 and ect...

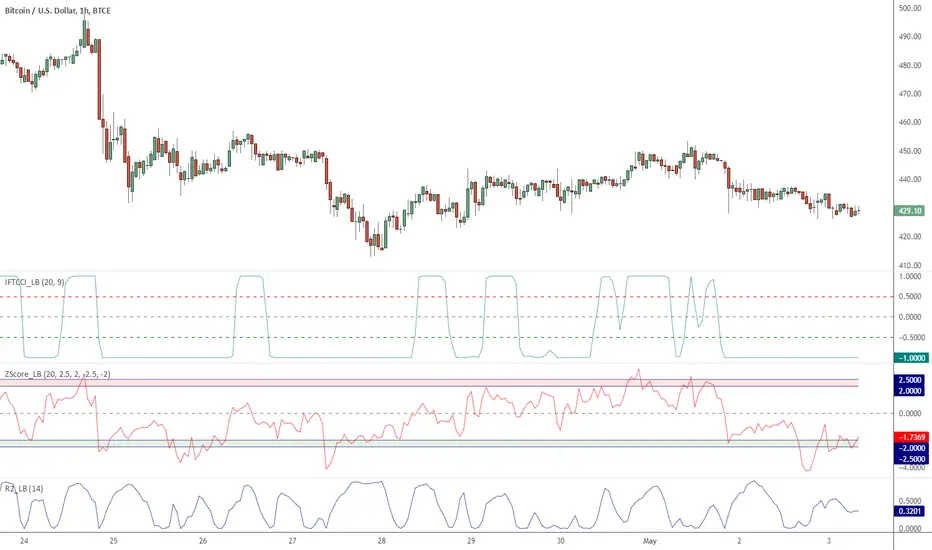
Indicators: Three included :: IFT on CCI, Z-Score and R-Squared*** Full description in the comment below ******
This chart has 3 indicators:
- Chande's R2
- Zscore
- Inverse Fisher Transform on CCI
Feel free to "make mine" (click on the SHARE button) and use these indicators in your charts.

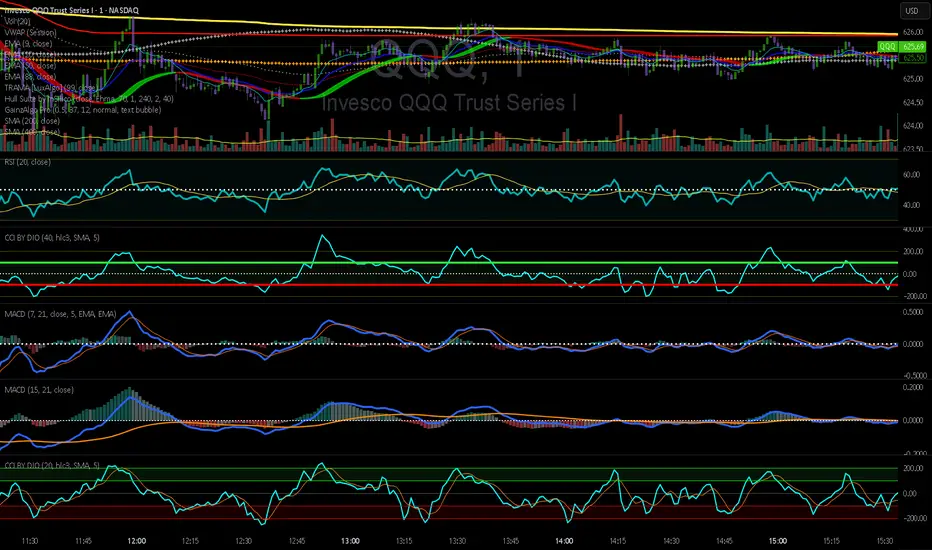
CCI by DioAdded background color to entry points of the channel for easy observation to levels I am looking at.
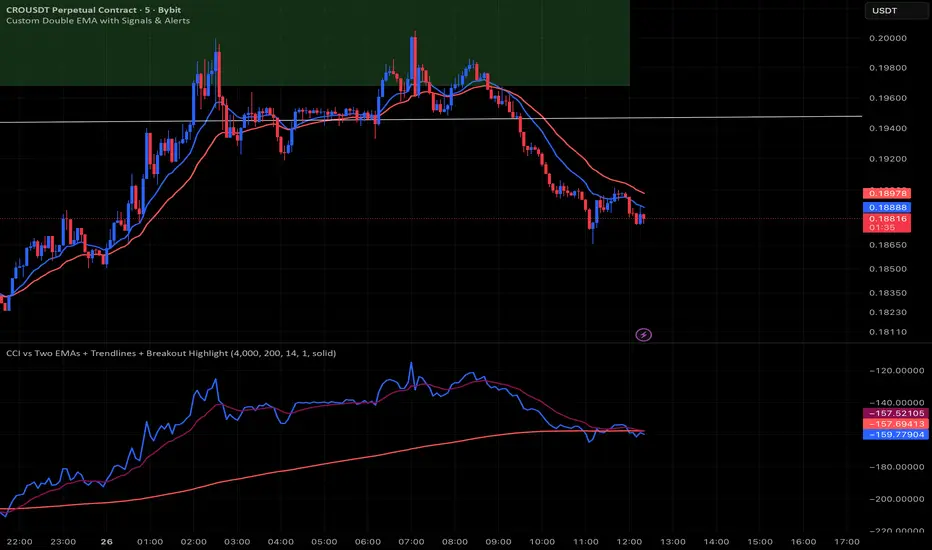
CCI vs Two EMAs + Trendlines + Breakout HighlightPerfect indicator which analyzes the cci4000 & 2 EMAS.
CCI Bearish BullishCommodities Channel Index and Bearish Harami, Bearish Engulfing, Bullish Harami, Bullish Engulfing.

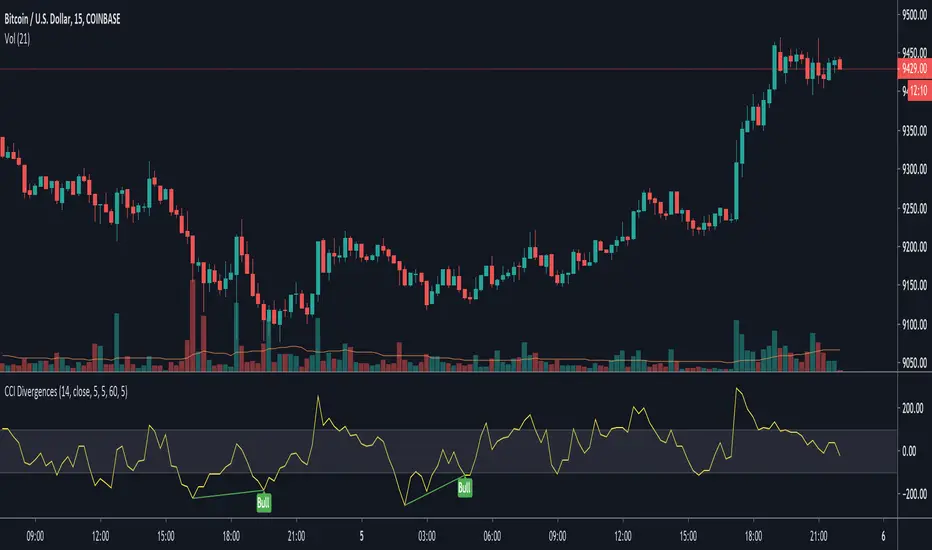
CCI DivergencesEasily identify divergences. Modified from Tradingview's Divergence Indicator script. Alerts are available.
Commodity Channel Indexcci in trading view is based on close price but the real formula Developed by Donald Lambert is based on typical price so I modified a formula little bit , and the result now are little smoothed


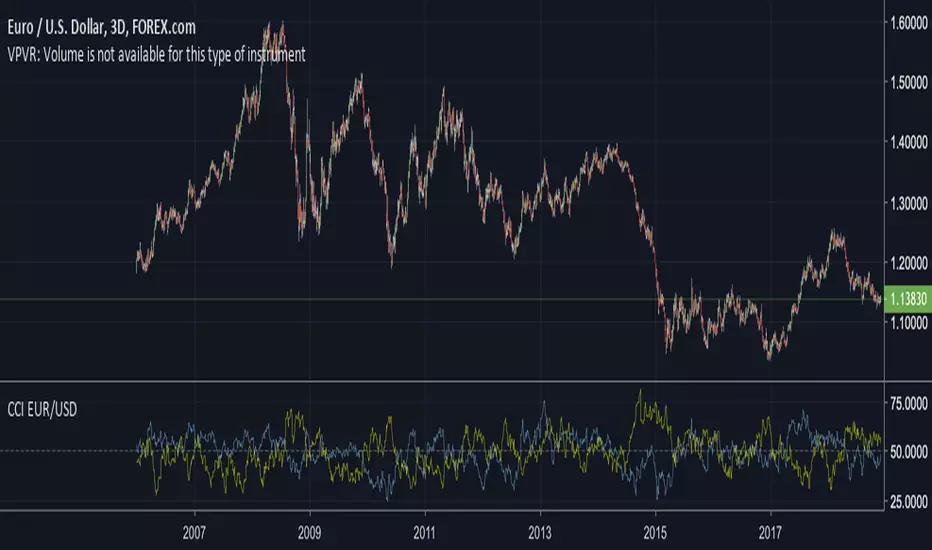
CCY Relative Strength [USD]This script provides an indication of the USD relative strength against other major currencies.
The strength is denoted by sma(roc(close, p1), p2). The USD value is always 0.
p1: SMA Period
p2: ROC Period
If you set the SMA Period to 1, it simply functions as the ROC.

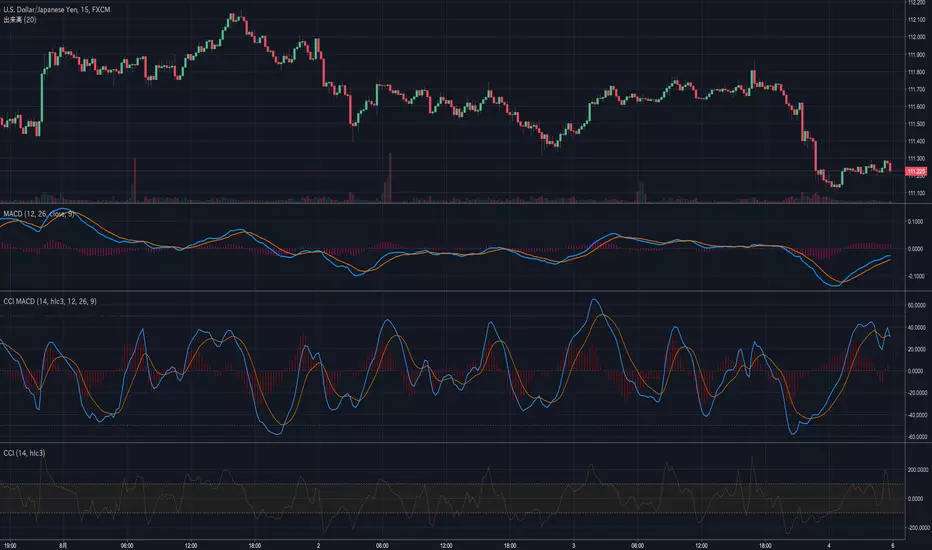
CCI MACDWe usually use closing prices for MACD calculations.
However, this indicator is calculated using CCI.
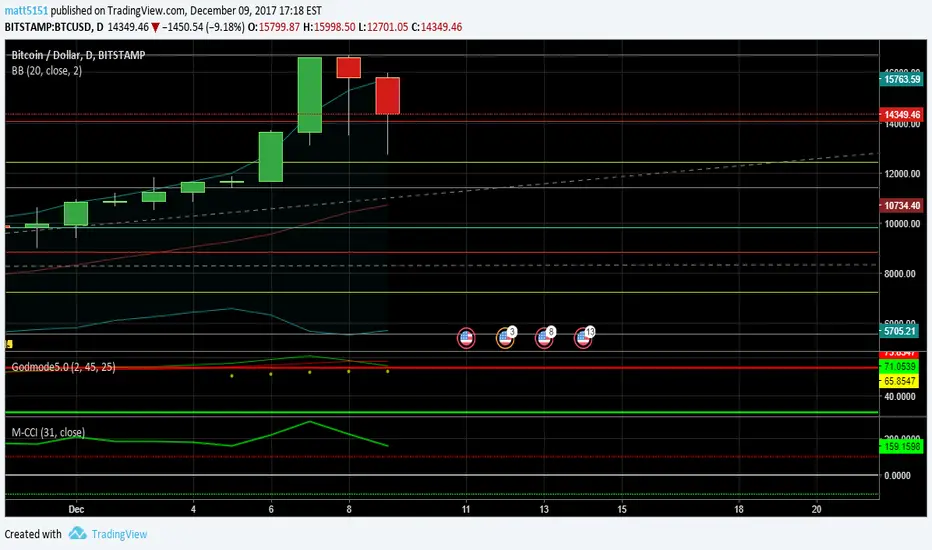
CCI Secret Sauce 1hr strategy by CryptoLloydChanged the CCI_Period to 30 and T3_Period to 1
Giving us a much clear indication of when to go long or short when used with RSI and MACD.
Rules:
LONG - RSI above 50, MACD Bullish cross - Use common sense, price action, horizontal support/resistance, 55 and 150 EMA's
SHORT - Inverse rule set - Use common sense, price action, horizontal support/resistance, 55 and 150 EMA's
