EconomicCalendarLibrary "EconomicCalendar"
This library is a data provider for important dates and times from the Economic Calendar.
events()
Returns the list of dates supported by this library as a string array.
Returns: array : Names of events supported by this library
fomcMeetings()
Gets the FOMC Meeting Dates. The FOMC meets eight times a year to determine the course of monetary policy. The FOMC announces its decision on the federal funds rate at the conclusion of each meeting and also issues a statement that provides information on the economic outlook and the Committee's assessment of the risks to the outlook.
Returns: array : FOMC Meeting Dates as timestamps
fomcMinutes()
Gets the FOMC Meeting Minutes Dates. The FOMC Minutes are released three weeks after each FOMC meeting. The Minutes provide information on the Committee's deliberations and decisions at the meeting.
Returns: array : FOMC Meeting Minutes Dates as timestamps
ppiReleases()
Gets the Producer Price Index (PPI) Dates. The Producer Price Index (PPI) measures the average change over time in the selling prices received by domestic producers for their output. The PPI is a leading indicator of CPI, and CPI is a leading indicator of inflation.
Returns: array : PPI Dates as timestamps
cpiReleases()
Gets the Consumer Price Index (CPI) Rekease Dates. The Consumer Price Index (CPI) measures changes in the price level of a market basket of consumer goods and services purchased by households. The CPI is a leading indicator of inflation.
Returns: array : CPI Dates as timestamps
csiReleases()
Gets the CSI release dates. The Consumer Sentiment Index (CSI) is a survey of consumer attitudes about the economy and their personal finances. The CSI is a leading indicator of consumer spending.
Returns: array : CSI Dates as timestamps
cciReleases()
Gets the CCI release dates. The Conference Board's Consumer Confidence Index (CCI) is a survey of consumer attitudes about the economy and their personal finances. The CCI is a leading indicator of consumer spending.
Returns: array : CCI Dates as timestamps
nfpReleases()
Gets the NFP release dates. Nonfarm payrolls is an employment report released monthly by the Bureau of Labor Statistics (BLS) that measures the change in the number of employed people in the United States.
Returns: array : NFP Dates as timestamps
Cerca negli script per "CCI"

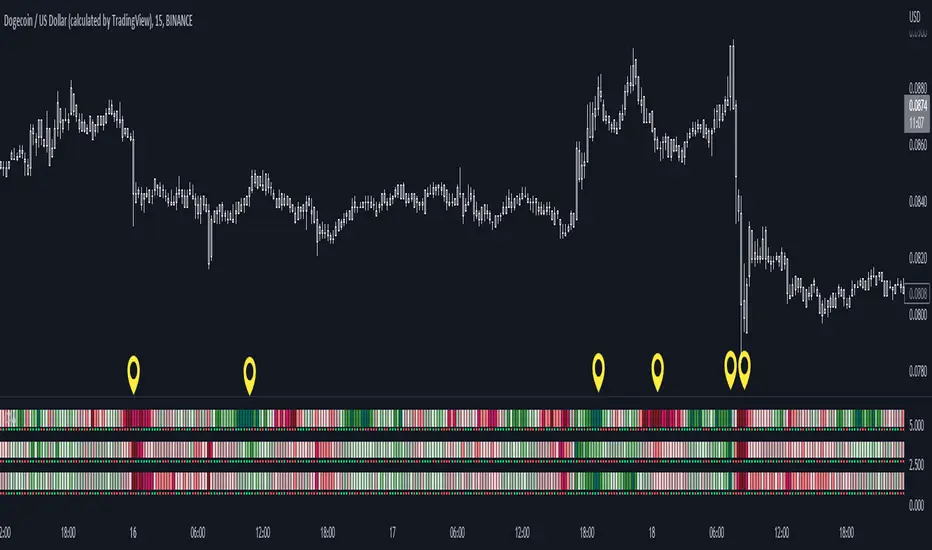
Buy / Sell alert indicator [Crypto_BCT]Hello everyone!
I bring to your attention a indicator to determine the point of buy and sell purchase.
It is based on oscillators and a moving average.
It can be used to work with bots, for example 3COMMAS DCA bot.
Signal Condition Settings:
ATR
The current candle is larger than the ATR for this period
EMA
The signal is necessarily below (for buy) and above (for sell) the EMA of the specified period
(Buy) RSI low
The RSI index is below this value
(Sell) RSI High
The RSI index is higher than this value
(Buy) MFI low
The MFI index is below this value
(Sell) MFI High
The MFI index is higher than this value
(Buy) CCI low
CCI index is below this value
(Sell) CCI High
The CCI index is higher than this value
(Buy) Lowest bar from
The closing of the current bar is lower than the closing of the bars back in this range
(Sell) Highest bar from
The closing of the current bar is higher than the closing of bars in this range
(Buy) Lowest EMA bar ago
During a given distance back, the EMA value only decreased
(Sell) Highest EMA bar ago
At a given distance back, the EMA value only increased
I hope it will be useful!

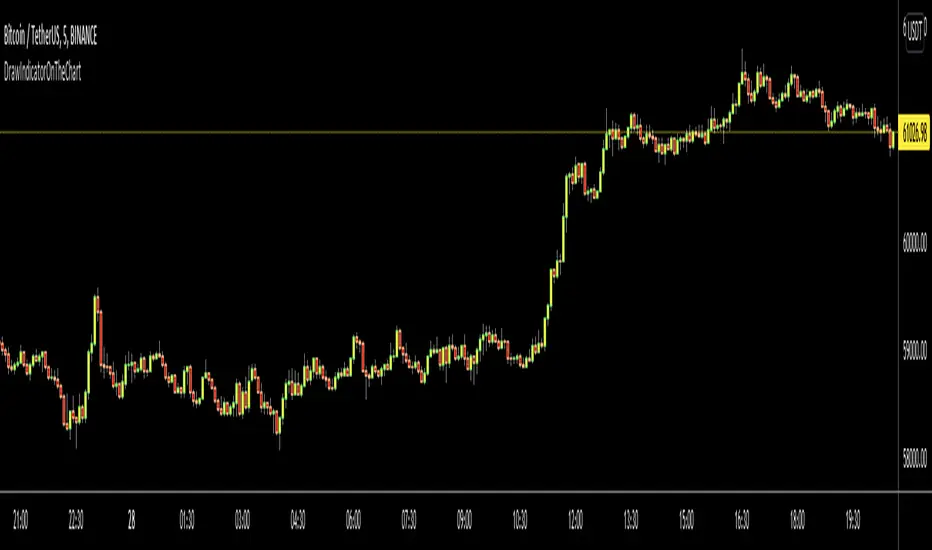
DrawIndicatorOnTheChartLibrary "DrawIndicatorOnTheChart"
this library is used to show an indicator (such RSI, CCI, MOM etc) on the main chart with indicator's horizontal lines in a window. Location of the window is calculated dynamically by last price movemements
drawIndicator(indicatorName, indicator, indicatorcolor, period, indimax_, indimin_, levels, precision, xlocation) draws the related indicator on the chart
Parameters:
indicatorName : is the indicator name as string such "RSI", "CCI" etc
indicator : is the indicator you want to show, such rsi(close, 14), mom(close, 10) etc
indicatorcolor : is the color of indicator line
period : is the length of the window to show
indimax_ : is the maximum value of the indicator, for example for RSI it's 100.0, if the indicator (such CCI, MOM etc) doesn't have maximum value then use "na"
indimin_ : is the minimum value of the indicator, for example for RSI it's 0.0, if the indicator (such CCI, MOM etc)doesn't have maximum value then use "na"
levels : is the levels of the array for the horizontal lines. for example if you want horizontal lines at 30.0, and 70.0 then use array.from(30.0, 70.0). if no horizontal lines then use array.from(na)
precision : is the precision/number of decimals that is used to show indicator values, for example for RSI set it 2
xlocation : is end location of the indicator window, for example if xlocation = 0 window is created on the index of the last bar/candle
Returns: none
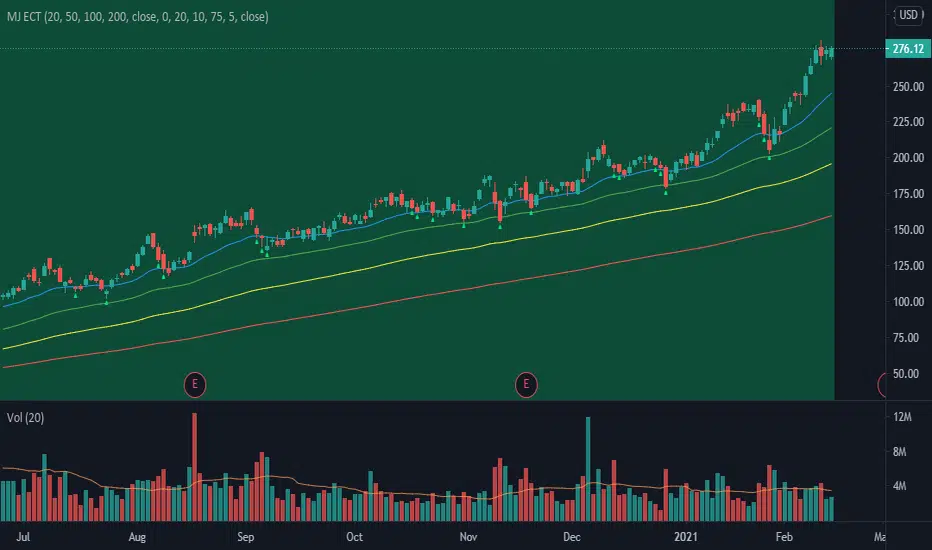
MJ ECT== One Line Introduction ==
ECT is a multi-level, trend focused technical indicator based on a three-step hierarchical approach - comprising the tide, wave, and ripple - to trend identification.
== Indicator Philosophy ==
The author believes that market trends can be understood in a three-step hierarchy, with tide at the top, wave in the middle, and ripple at the bottom, corresponding to long-, middle-, and short-term momentum in the stock price. This indicator therefore comprises three technical indicators which aims to reflect the abovementioned features of a trend. These three components are True Strength Index (TSI), Exponential Moving Averages ( EMA ), and Commodity Channel Index ( CCI ).
== Indicator Components and Breakdown ==
True Strength Index (TSI) -> Tide
A 20-period TSI is used to visualize the bullish or bearish sentiment surrounding the stock. Crossovers above the zero line are interpreted as bullish while crossovers below the zero line are interpreted as bearish . This is painted into the background where green represents bullish and red represents bearish . While the background is red ( bearish ), no bullish positions should be taken. Hence, the TSI painted background acts as a directional bias filter and going against the bias is not recommended. After understanding the directional bias, the user can delve further into the areas of value for the stock in the Wave.
Exponential Moving Averages ( EMA ) -> Wave
Four EMA are used (20, 50, 100, 200) to identify the dynamic support and resistance waves in a trending market. Stock price pullbacks into any of these EMA represent areas of value where the user can consider taking positions. The correct EMA to use depends on individual stock's behavior, with multiple bounces on a specified EMA being the priority. After understanding which wave best reflects the area of value of a stock, the user can move on to the Ripple to time their entries.
Commodity Channel Index ( CCI ) -> Ripple
A 5-period CCI is used to identify short-term oversold conditions where prices are on discount. Discount is defined by the 5-period CCI crossing below -100 as it reflects a weekly oversold condition. The indicator will display a small triangle below the candle when this condition is met.
== Ready To Deploy Field Manual ==
When background is painted red, do nothing.
When background is painted green, begin thinking of bullish opportunities.
Look for the specific EMA that has the most bounces of stock price in recent months, this is the area of value to look for buying opportunity.
For the candles that intersect the EMA you identified above, watch for the appearance of a small triangle below the candle that tells you the entry timing.
When the entry timing signal triangle appears, remember the High of that candle and buy your position when the subsequent candle breaks above this High.
If the High is not broken above in the next immediate candle, remember the newer High of the newer candle (basically follow / trail the latest High until a break above is hit).
If the background turns from green to red, stop following the High and do not enter because the market sentiment has changed to bearish .
If you are holding an existing position and the background turns red, consider exiting the position. You may consider remembering the Low of the candle and exit your position if this Low is broken below on a subsequent candle.
== Best Wishes ==
The author wishes the best success for all users of this technical indicator.
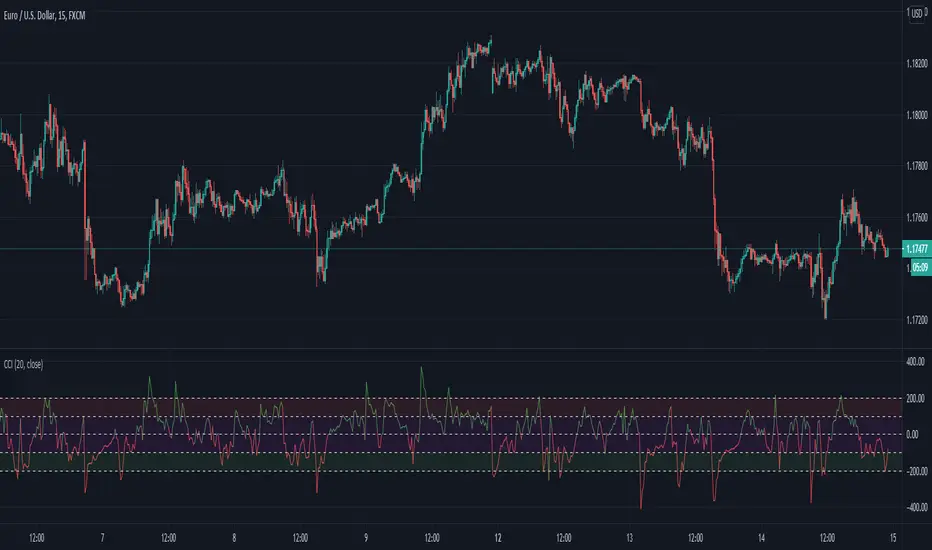
Improved Commodity Channel IndexI took the normal CCI version and I made it better and more pleasantly visual.
At the same time now the CCI changes color based on the direction is going to take
We also have more levels, to define even better the current situation.
Details are simple :
green color cci = uptrend - > buy
red color cci = downtrend - > sell
Inverse Fisher Transform COMBOThis indicator is the one scripted and published by KIVANCfr3762 (fr3762 @twitter), only difference is the IFT Stochastic Momentum line to be added and also included for average IFT line calculation. Both IFT CCI and IFT CCI V2 lines are included within this script. With the options/settings menu, the lines can be added/removed for displaying on the chart up to preferences.
İndikatör , Kıvanç ( KIVANCfr3762 (fr3762 @twitter) ) hocamızın daha önceden yayınladığı indikatördür, Buna, IFT Stochastic Momentumu ekledim, ve tabi bu hesaplamayı ortalama IFT çizgisi hesabına da dahil ettim. IFT CCI ve IFT CCI V2 iki çizgi de ayrı ayrı indikatörün içinde bulunmaktadır. İstenilenler ayarlar kısmındaki kutucuklardan işaretlenerek/kaldırılarak grafiğin üzerinde gösterimi sağlanabilir.

Resampling Reverse Engineering Bands XRREB X: Visual Oscillator Projection Bands
Based on the innovative "Resampling Reverse Engineering" concept pioneered by Donovan Wall, this enhanced script fixes the core mathematical symmetry and provides anchored, non-repainting bands for reliable analysis.
This indicator transforms any RSI, Stochastic, or CCI calculation directly onto your price chart as dynamic support/resistance bands. Instead of watching an oscillator below your chart, you see its overbought/oversold levels projected as price levels the market must reach.
RREB X reverses standard oscillator formulas to answer one question: "What price must the market reach for my chosen oscillator to hit an extreme level like RSI=70, Stoch=80, or CCI=100?" It then plots these levels as actionable bands.
Key Improvements
Adjustable Oscillator Values - While the original was hard coded the reverse engineered oscillator length which limited its usefulness, this script finally allows you to visualize any length oscillator as dynamic OB/OS regions directly on the chart.
Dynamic OB/OS levels: This version also lets you dynamically adjust the OB/OS levels location, making bands tighter or wider as your strategy demands.
Mathematical Symmetry: Outer bands are perfect mirrors, providing reliable projected levels.
Fixed Anchoring: Bands don't repaint historically, offering stable reference lines.
Direct Price Translation: Oscillator overbought/oversold conditions are visualized as clear price levels.
The Band Calculation Type switch lets you project different oscillator logics, each with unique characteristics for different market conditions.
RRSI - General trend & momentum. Change RSI Period (e.g., 7 for fast, 21 for slow). Adjust OB/OS (e.g., 80/20 for strong trends). The bands show the price needed to push your custom RSI into overbought/oversold territory.
RStoch - Ranging markets & short-term reversals. Focus on the Stochastic Period. The projected bands are highly sensitive to recent highs/lows. Excellent for spotting reversals at the edges of a range.
RCCI - Strong trends & volatile markets. Use a higher Outer Bands Multiplier. CCI's lack of upper/lower bounds means bands reflect extreme momentum shifts. Great for identifying explosive breakout or breakdown levels in trends.
Use Middle Band as Filter: Price above the white middle band suggests a bullish bias for long setups; below suggests bearish for shorts. Same as the 50 midline on the RSI or Stochastic or 0 for CCI.
Customizing the Calculation:
The power lies in changing the oscillator lengths that the bands reflect. Adjust these in the settings:
Change from 14 to 7 for faster, more reactive bands, or to 21 for slower, smoother bands.
Overbought/Oversold: Change from 70/30 to 80/20 for stronger-trend filters, or to 60/40 for more frequent signals.
Trading the Bands:
Bands as Dynamic S/R: The solid cyan (Upper 100) and magenta (Lower 0) bands act as dynamic support and resistance. A touch and reversal can signal a trade.
Gradient as Momentum: The colored fills between bands visually represent the "pressure" needed to reach the next oscillator level.
Middle Band as Trend Filter: Price above the white middle band suggests a bullish bias for long setups; below suggests bearish for short setups.
Static K-means Clustering | InvestorUnknownStatic K-Means Clustering is a machine-learning-driven market regime classifier designed for traders who want a data-driven structure instead of subjective indicators or manually drawn zones.
This script performs offline (static) K-means training on your chosen historical window. Using four engineered features:
RSI (Momentum)
CCI (Price deviation / Mean reversion)
CMF (Money flow / Strength)
MACD Histogram (Trend acceleration)
It groups past market conditions into K distinct clusters (regimes). After training, every new bar is assigned to the nearest cluster via Euclidean distance in 4-dimensional standardized feature space.
This allows you to create models like:
Regime-based long/short filters
Volatility phase detectors
Trend vs. chop separation
Mean-reversion vs. breakout classification
Volume-enhanced money-flow regime shifts
Full machine-learning trading systems based solely on regimes
Note:
This script is not a universal ML strategy out of the box.
The user must engineer the feature set to match their trading style and target market.
K-means is a tool, not a ready made system, this script provides the framework.
Core Idea
K-means clustering takes raw, unlabeled market observations and attempts to discover structure by grouping similar bars together.
// STEP 1 — DATA POINTS ON A COORDINATE PLANE
// We start with raw, unlabeled data scattered in 2D space (x/y).
// At this point, nothing is grouped—these are just observations.
// K-means will try to discover structure by grouping nearby points.
//
// y ↑
// |
// 12 | •
// | •
// 10 | •
// | •
// 8 | • •
// |
// 6 | •
// |
// 4 | •
// |
// 2 |______________________________________________→ x
// 2 4 6 8 10 12 14
//
//
//
// STEP 2 — RANDOMLY PLACE INITIAL CENTROIDS
// The algorithm begins by placing K centroids at random positions.
// These centroids act as the temporary “representatives” of clusters.
// Their starting positions heavily influence the first assignment step.
//
// y ↑
// |
// 12 | •
// | •
// 10 | • C2 ×
// | •
// 8 | • •
// |
// 6 | C1 × •
// |
// 4 | •
// |
// 2 |______________________________________________→ x
// 2 4 6 8 10 12 14
//
//
//
// STEP 3 — ASSIGN POINTS TO NEAREST CENTROID
// Each point is compared to all centroids.
// Using simple Euclidean distance, each point joins the cluster
// of the centroid it is closest to.
// This creates a temporary grouping of the data.
//
// (Coloring concept shown using labels)
//
// - Points closer to C1 → Cluster 1
// - Points closer to C2 → Cluster 2
//
// y ↑
// |
// 12 | 2
// | 1
// 10 | 1 C2 ×
// | 2
// 8 | 1 2
// |
// 6 | C1 × 2
// |
// 4 | 1
// |
// 2 |______________________________________________→ x
// 2 4 6 8 10 12 14
//
// (1 = assigned to Cluster 1, 2 = assigned to Cluster 2)
// At this stage, clusters are formed purely by distance.
Your chosen historical window becomes the static training dataset , and after fitting, the centroids never change again.
This makes the model:
Predictable
Repeatable
Consistent across backtests
Fast for live use (no recalculation of centroids every bar)
Static Training Window
You select a period with:
Training Start
Training End
Only bars inside this range are used to fit the K-means model. This window defines:
the market regime examples
the statistical distributions (means/std) for each feature
how the centroids will be positioned post-trainin
Bars before training = fully transparent
Training bars = gray
Post-training bars = full colored regimes
Feature Engineering (4D Input Vector)
Every bar during training becomes a 4-dimensional point:
This combination balances: momentum, volatility, mean-reversion, trend acceleration giving the algorithm a richer "market fingerprint" per bar.
Standardization
To prevent any feature from dominating due to scale differences (e.g., CMF near zero vs CCI ±200), all features are standardized:
standardize(value, mean, std) =>
(value - mean) / std
Centroid Initialization
Centroids start at diverse coordinates using various curves:
linear
sinusoidal
sign-preserving quadratic
tanh compression
init_centroids() =>
// Spread centroids across using different shapes per feature
for c = 0 to k_clusters - 1
frac = k_clusters == 1 ? 0.0 : c / (k_clusters - 1.0) // 0 → 1
v = frac * 2 - 1 // -1 → +1
array.set(cent_rsi, c, v) // linear
array.set(cent_cci, c, math.sin(v)) // sinusoidal
array.set(cent_cmf, c, v * v * (v < 0 ? -1 : 1)) // quadratic sign-preserving
array.set(cent_mac, c, tanh(v)) // compressed
This makes initial cluster spread “random” even though true randomness is hardly achieved in pinescript.
K-Means Iterative Refinement
The algorithm repeats these steps:
(A) Assignment Step, Each bar is assigned to the nearest centroid via Euclidean distance in 4D:
distance = sqrt(dx² + dy² + dz² + dw²)
(B) Update Step, Centroids update to the mean of points assigned to them. This repeats iterations times (configurable).
LIVE REGIME CLASSIFICATION
After training, each new bar is:
Standardized using the training mean/std
Compared to all centroids
Assigned to the nearest cluster
Bar color updates based on cluster
No re-training occurs. This ensures:
No lookahead bias
Clean historical testing
Stable regimes over time
CLUSTER BEHAVIOR & TRADING LOGIC
Clusters (0, 1, 2, 3…) hold no inherent meaning. The user defines what each cluster does.
Example of custom actions:
Cluster 0 → Cash
Cluster 1 → Long
Cluster 2 → Short
Cluster 3+ → Cash (noise regime)
This flexibility means:
One trader might have cluster 0 as consolidation.
Another might repurpose it as a breakout-loading zone.
A third might ignore 3 clusters entirely.
Example on ETHUSD
Important Note:
Any change of parameters or chart timeframe or ticker can cause the “order” of clusters to change
The script does NOT assume any cluster equals any actionable bias, user decides.
PERFORMANCE METRICS & ROC TABLE
The indicator computes average 1-bar ROC for each cluster in:
Training set
Test (live) set
This helps measure:
Cluster profitability consistency
Regime forward predictability
Whether a regime is noise, trend, or reversion-biased
EQUITY SIMULATION & FEES
Designed for close-to-close realistic backtesting.
Position = cluster of previous bar
Fees applied only on regime switches. Meaning:
Staying long → no fee
Switching long→short → fee applied
Switching any→cash → fee applied
Fee input is percentage, but script already converts internally.
Disclaimers
⚠️ This indicator uses machine-learning but does not predict the future. It classifies similarity to past regimes, nothing more.
⚠️ Backtest results are not indicative of future performance.
⚠️ Clusters have no inherent “bullish” or “bearish” meaning. You must interpret them based on your testing and your own feature engineering.

Delta Zones Buy/Sell Pressure UT Plus Delta Zones Buy/Sell Pressure: All-in-One Smart Trading Indicator
💡 Summary: This Indicator is designed as a powerful All-in-One analysis tool, consolidating 4 crucial trading strategies: Delta Zones (Extreme Pressure), Orderblocks & Breaker Blocks (Market Structure), Multi-Indicator Signals (RSI/CCI/Stoch), and UT Bot Alerts (Trend Signals). It provides a comprehensive trading setup on a single chart.
🔎 Key Features:
Delta Zones (Extreme Buy/Sell Pressure): Utilizes Standard Deviation to spot candles with abnormal Buy/Sell Pressure, often indicating institutional activity or stop hunts.
Orderblocks & Breaker Blocks: Automatically analyzes Market Structure Shifts (MSS) to draw Orderblocks and convert them into Breaker Blocks, serving as key support/resistance zones.
Multi-Indicator Signals (RSI/CCI/Stoch): Provides confirmed Buy/Sell signals when RSI, CCI, and Stochastic are in Oversold/Overbought conditions and show reversal action (Users can select the combination).
UT Bot Alerts: Includes a ATR-based Trailing Stop system and secondary Buy/Sell signals for trend confirmation.
🚀 How to Use:
Use the "BUY/SELL" signals from the Multi-Indicator section as the primary trigger.
Use the Delta Zones or Orderblocks/Breaker Blocks as high-confidence confirmation zones for entry/exit, and as precise Stop Loss placement areas.
⚠️ Note on Performance: This Indicator uses complex logic (especially Array and Box drawing functions) and may be resource-intensive on lower timeframes.

The Ultimate Price Action & SMC Toolkit: Delta Zones, MTF IndicaThis is an All-in-One Pine Script indicator that seamlessly combines three advanced trading concepts:
Delta Zones (Wick Pressure): Uses Standard Deviation to identify extreme buying/selling pressure within the candlestick wicks, signaling potential stop hunts or liquidity absorption. These are plotted as critical Buy/Sell Boxes.
Multi-Timeframe (MTF) Indicators: Confirms signals using popular indicators (RSI, CCI, Stochastic) calculated from a separate, user-selected Timeframe or the current chart timeframe. This adds a crucial layer of context and momentum confirmation.
Smart Money Concepts (SMC): Automatically detects and plots Orderblocks (OBs) and Breaker Blocks based on confirmed Market Structure Breaks (MSB). This helps locate high-probability Supply and Demand zones.
Key Features:
Integrated plotting for combined indicator signals.
Flexible MTF selection for all standard oscillators.
Automatic Swing High/Low detection for SMC analysis.
Comprehensive Alert system for Delta Pressure, Orderblocks, and Breaker Zones.
Option 2: Focusing on SMC and Flow (Concise)
Title: "SMC Delta Flow: Advanced Orderblock, Breaker, and Wick Reversal Zones with MTF Filter."
Description:
An essential tool for sophisticated SMC traders. This indicator provides high-precision zones:
Smart Money Blocks: Plots Orderblocks and Breaker Blocks following Market Structure Shifts (MSS). Includes a "Chop Control" feature to invalidate re-used or weak Breakers.
Delta Reversal Zones: Pinpoints candles showing extreme high-deviation wick pressure. Use these zones to confirm reversals and identify precise entry points where liquidity was captured.
MTF Confirmation: Incorporates configurable Multi-Timeframe (MTF) RSI, CCI, and Stochastic indicators to act as a momentum filter or confirmation tool.
Add this indicator to unify your analysis of Liquidity, Market Structure, and Momentum on a single chart!
SMC, SmartMoneyConcepts, Orderblock, BreakerBlock, MTF, MultiTimeframe, Delta, Wick, Liquidity, PriceAction, RSI, Stochastic, CCI

TrendMaster V2TrendMaster V2 is a comprehensive Pine Script indicator designed for TradingView. It combines multiple technical indicators and an advanced scoring logic to provide actionable trading signals. The script is highly customizable, allowing users to adjust trading modes, color themes, and signal filters according to their preferences and risk tolerance.
Key Features
Composite Scoring System:
The script calculates a composite score based on trend, momentum, pattern recognition, volume, volatility, divergence, Pearson correlation, and the CCI index. This score helps identify the best buy or sell opportunities.
Customizable Parameters:
Users can choose between “Aggressive,” “Balanced,” or “Conservative” trading modes, adjust indicator periods, and customize the color scheme of all visual elements.
Confluence Analysis:
The script evaluates the number of matching bullish or bearish signals, providing a confluence summary for higher-confidence trades.
Visual Signals:
Clear visual cues (triangles, circles, crosses) are displayed on the chart for strong buy/sell signals, confluences, and divergences.
Information Panels:
Two panels display real-time data such as score, RSI, volume, volatility, Pearson, CCI, trend, signal, and mode, along with the confluence status for quick reference.
Alert Conditions:
The script supports alerts for strong buy/sell signals, confluences, and divergences.
How It Works
Main Configuration:
Users select a trading mode (Aggressive, Balanced, or Conservative) and a color theme (Dark or Light).
Custom colors can also be set for bullish, bearish, strong, neutral, and signal elements.
Technical Indicators
Moving Averages (SMA/EMA) for trend analysis.
RSI to assess momentum and overbought/oversold conditions.
MACD for trend confirmation.
Volume and Volatility (ATR) for market activity evaluation.
Advanced Indicators
Pearson Correlation to measure trend strength.
CCI for cyclic momentum analysis.
Pattern Recognition
The script identifies common bullish and bearish reversal patterns (e.g., engulfing, hammer, morning/evening star) and continuation patterns (e.g., three white soldiers/black crows).
Composite Score
Each indicator contributes to a composite score, weighted according to the selected trading mode.
The score determines the strength of buy/sell signals.
Confluence Analysis
The script counts the number of matching bullish or bearish signals, providing a confluence summary for higher-confidence trades.
Visual Signals and Alerts
Strong buy/sell signals: triangles
Confluence signals: circles
Divergences: crosses
Alerts are triggered for strong buy/sell signals, confluences, and divergences.
Usage Instructions
Add the script to your TradingView chart.
Adjust the settings in the configuration panel to match your trading style.
Monitor the information panels and visual signals to spot trading opportunities.
Set up alerts for your preferred signal types.

Composite Momentum System⚙️ Composite Momentum System — RSI + CCI + Momentum + MFI + (DI·ADX) × MACD² (4-Color Smoothed Signal)
This advanced indicator fuses multiple momentum, volume, and trend components into one unified oscillator, dynamically visualized around a zero line. It helps traders identify powerful directional moves, trend reversals, and momentum exhaustion far earlier than traditional MACD or RSI alone.
🧩 Core Formula
Composite = ((RSI + CCI + Momentum + MFI) + (((DI− × −1) + DI+) × ADX)) × (MACD²)
RSI – captures relative strength and short-term momentum
CCI – measures deviation from price mean (volatility & cycles)
Momentum – shows raw velocity of price change
MFI – volume-weighted momentum, adds money flow confirmation
DI / ADX – directional strength and market trend intensity
MACD² – amplifies strong momentum moves and filters weak noise
🌈 Visual Design & Features
Zero-Centered Histogram:
Green = Bullish momentum, Red = Bearish momentum
MACD Signal Line (4 Colors):
🟢 Positive & Rising → strong up momentum
🟡 Positive & Falling → weakening uptrend
🔴 Negative & Falling → strong downtrend
🟠 Negative & Rising → possible bearish fade or reversal
Adjustable Signal Smoothing:
Choose MA type (SMA, EMA, RMA, WMA, VWMA) and custom smoothing length for cleaner visualization.
ATR Normalization:
Optional setting to keep MACD and composite values consistent across instruments.
Centering Options:
RSI and MFI can be centered (−50/+50) to balance oscillation around zero.
🎯 How to Use
Above 0: Bullish composite energy → favor long setups.
Below 0: Bearish composite energy → favor short setups.
Signal line color changes highlight momentum acceleration or slowdown.
Crosses through zero often precede major shifts or breakout moments.
⚡ Best Practice
Use this indicator as a momentum strength filter in confluence with price action or volume patterns.
Combine it with VWAP, higher-timeframe trend, or support/resistance zones for high-probability entries.

Adaptive Trend CatcherAdaptive Trend Catcher is an original indicator that combines Hull Moving Average smoothing, ATR-based volatility bands, and a CCI filter within an adaptive logic framework. It’s built to react intelligently to changing market conditions rather than applying fixed parameters.
The system uses hysteresis to confirm trend flips only after several consistent signals, minimizing noise and false reversals. During strong momentum bursts, it automatically tightens its internal deadzone and step size to stay responsive while maintaining stability in quieter periods.
The result is a dynamic trend engine that plots a color-shifting adaptive line — green for bullish, red for bearish — that adjusts smoothly with volatility. Optional upper/lower ATR bands can be displayed for added context.
How to use: Watch for confirmed trend color flips with supporting momentum. Bullish flips occur when price regains the lower band and CCI turns positive; bearish flips when price falls below the upper band and CCI turns negative.
Includes alert conditions for both reversals.
For educational purposes only. Not financial advice.

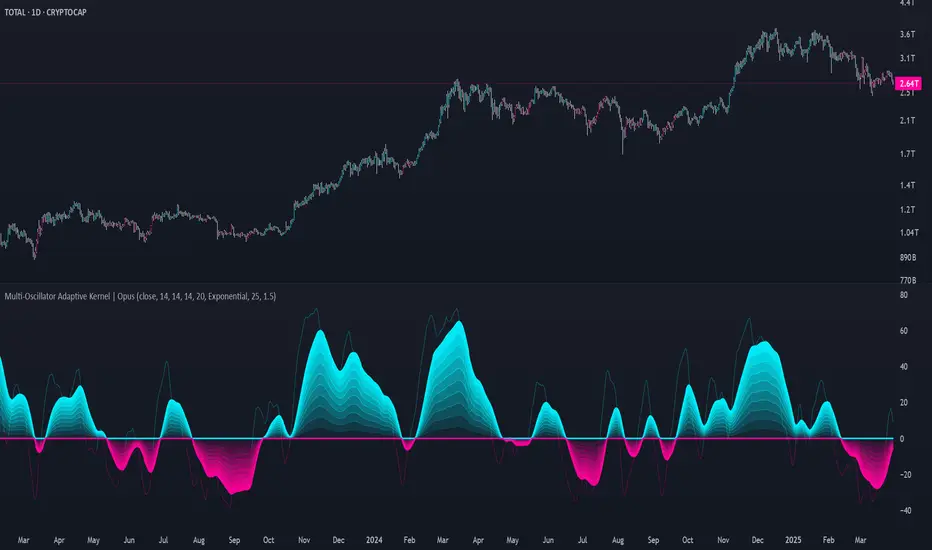
Multi-Oscillator Adaptive Kernel | AlphaAlgosMulti-Oscillator Adaptive Kernel | AlphaAlgos
Overview
The Multi-Oscillator Adaptive Kernel (MOAK) is an advanced technical analysis tool that combines multiple oscillators through sophisticated kernel-based smoothing algorithms. This indicator is designed to provide clearer trend signals while filtering out market noise, offering traders a comprehensive view of market momentum across multiple timeframes.
Key Features
• Fusion of multiple technical oscillators (RSI, Stochastic, MFI, CCI)
• Advanced kernel smoothing technology with three distinct mathematical models
• Customizable sensitivity and lookback periods
• Clear visual signals for trend shifts and reversals
• Overbought/oversold zones for precise entry and exit timing
• Adaptive signal that responds to varying market conditions
Technical Components
The MOAK indicator utilizes a multi-layer approach to signal generation:
1. Oscillator Fusion
The core of the indicator combines normalized readings from up to four popular oscillators:
• RSI (Relative Strength Index) - Measures the speed and change of price movements
• Stochastic - Compares the closing price to the price range over a specific period
• MFI (Money Flow Index) - Volume-weighted RSI that includes trading volume
• CCI (Commodity Channel Index) - Measures current price level relative to an average price
2. Kernel Smoothing
The combined oscillator data is processed through one of three kernel functions:
• Exponential Kernel - Provides stronger weighting to recent data with exponential decay
• Linear Kernel - Applies a linear weighting from most recent to oldest data points
• Gaussian Kernel - Uses a bell curve distribution that helps filter out extreme values
3. Dual Signal Lines
• Fast Signal Line - Responds quickly to price changes
• Slow Signal Line - Provides confirmation and shows the underlying trend direction
Configuration Options
Oscillator Selection:
• Enable/disable each oscillator (RSI, Stochastic, MFI, CCI)
• Customize individual lookback periods for each oscillator
Kernel Settings:
• Kernel Type - Choose between Exponential, Linear, or Gaussian mathematical models
• Kernel Length - Adjust the smoothing period (higher values = smoother line)
• Sensitivity - Fine-tune the indicator's responsiveness (higher values = more responsive)
Display Options:
• Color Bars - Toggle price bar coloring based on indicator direction
How to Interpret the Indicator
Signal Line Direction:
• Upward movement (teal) indicates bullish momentum
• Downward movement (magenta) indicates bearish momentum
Trend Shifts:
• Small circles mark the beginning of new uptrends
• X-marks indicate the start of new downtrends
Overbought/Oversold Conditions:
• Values above +50 suggest overbought conditions (potential reversal or pullback)
• Values below -50 suggest oversold conditions (potential reversal or bounce)
Trading Strategies
Trend Following:
• Enter long positions when the signal line turns teal and shows an uptrend
• Enter short positions when the signal line turns magenta and shows a downtrend
• Use the slow signal line (area fill) as confirmation of the underlying trend
Counter-Trend Trading:
• Look for divergences between price and the indicator
• Consider profit-taking when the indicator reaches overbought/oversold areas
• Wait for trend shift signals before entering counter-trend positions
Multiple Timeframe Analysis:
• Use the indicator across different timeframes for confirmation
• Higher timeframe signals carry more weight than lower timeframe signals
Best Practices
• Experiment with different kernel types for various market conditions
• Gaussian kernels often work well in ranging markets
• Exponential kernels can provide earlier signals in trending markets
• Combine with volume analysis for higher probability trades
• Use appropriate stop-loss levels as the indicator does not guarantee price movements
This indicator is provided as-is with no guarantees of profit. Always use proper risk management when trading with any technical indicator. Nothing is financial advise.
Multi-Timeframe RPM Gauges with Custom Timeframes by DiGetIntroducing the **Multi-Timeframe RPM Gauges with Custom Timeframes + RSI Combos (mod) by DiGet** – a cutting-edge TradingView indicator meticulously crafted to revolutionize your market analysis.
Imagine having a dynamic dashboard right on your chart that consolidates the power of nine essential technical indicators—RSI, CCI, Stochastic, Williams %R, EMA crossover, Bollinger Bands, ATR, MACD, and Ichimoku Cloud—across multiple timeframes. This indicator not only displays each indicator’s score through an intuitive gauge system but also computes a combined metric to provide you with an at-a-glance understanding of market momentum and potential trend shifts.
**Key Features:**
- **Multi-Timeframe Insight:**
Configure up to four custom timeframes (e.g., 1, 5, 15, 60 minutes) to capture both short-term fluctuations and long-term trends, ensuring you never miss critical market moves.
- **Comprehensive Signal Suite:**
Benefit from a harmonious blend of signals. Whether you rely on momentum indicators like RSI and CCI, volatility measures like Bollinger Bands and ATR, or trend confirmations via EMA, MACD, and Ichimoku, every metric is normalized into actionable percentages.
- **Dynamic, Color-Coded Gauge Display:**
A built-in table presents all your data in a clear, color-coded format—green for bullish, red for bearish, and gray for neutral conditions. This visual representation allows you to quickly gauge market sentiment without sifting through complex charts.
- **Customizable Layout:**
Tailor your experience by toggling individual table columns. Whether you want to focus solely on RSI or dive deep into combined metrics like RSI & CCI or RSI & MACD, the choice is yours.
- **Optimized Utility Functions:**
Proprietary functions standardize indicator values into percentage scores, making it simpler than ever to compare different signals and spot opportunities in real time.
- **User-Friendly Interface:**
Designed for both beginners and seasoned traders, the straightforward input settings let you easily adjust technical parameters and timeframes to suit your personal trading strategy.
This indicator is not just a tool—it’s your new trading companion. It equips you with a multi-dimensional view of the market, enabling faster, more informed decision-making. Whether you’re scanning across various assets or drilling down on a single chart, the Multi-Timeframe RPM Gauges empower you to interpret market data with unprecedented clarity.
Add this indicator to your TradingView chart today and experience a smarter, more efficient way to navigate the markets. Join the community of traders who have elevated their analysis—and be ready to receive countless thanks as you transform your trading strategy!

AI Adaptive Oscillator [PhenLabs]📊 Algorithmic Adaptive Oscillator
Version: PineScript™ v6
📌 Description
The AI Adaptive Oscillator is a sophisticated technical indicator that employs ensemble learning and adaptive weighting techniques to analyze market conditions. This innovative oscillator combines multiple traditional technical indicators through an AI-driven approach that continuously evaluates and adjusts component weights based on historical performance. By integrating statistical modeling with machine learning principles, the indicator adapts to changing market dynamics, providing traders with a responsive and reliable tool for market analysis.
🚀 Points of Innovation:
Ensemble learning framework with adaptive component weighting
Performance-based scoring system using directional accuracy
Dynamic volatility-adjusted smoothing mechanism
Intelligent signal filtering with cooldown and magnitude requirements
Signal confidence levels based on multi-factor analysis
🔧 Core Components
Ensemble Framework : Combines up to five technical indicators with performance-weighted integration
Adaptive Weighting : Continuous performance evaluation with automated weight adjustment
Volatility-Based Smoothing : Adapts sensitivity based on current market volatility
Pattern Recognition : Identifies potential reversal patterns with signal qualification criteria
Dynamic Visualization : Professional color schemes with gradient intensity representation
Signal Confidence : Three-tiered confidence assessment for trading signals
🔥 Key Features
The indicator provides comprehensive market analysis through:
Multi-Component Ensemble : Integrates RSI, CCI, Stochastic, MACD, and Volume-weighted momentum
Performance Scoring : Evaluates each component based on directional prediction accuracy
Adaptive Smoothing : Automatically adjusts based on market volatility
Pattern Detection : Identifies potential reversal patterns in overbought/oversold conditions
Signal Filtering : Prevents excessive signals through cooldown periods and minimum change requirements
Confidence Assessment : Displays signal strength through intuitive confidence indicators (average, above average, excellent)
🎨 Visualization
Gradient-Filled Oscillator : Color intensity reflects strength of market movement
Clear Signal Markers : Distinct bullish and bearish pattern signals with confidence indicators
Range Visualization : Clean representation of oscillator values from -6 to 6
Zero Line : Clear demarcation between bullish and bearish territory
Customizable Colors : Color schemes that can be adjusted to match your chart style
Confidence Symbols : Intuitive display of signal confidence (no symbol, +, or ++) alongside direction markers
📖 Usage Guidelines
⚙️ Settings Guide
Color Settings
Bullish Color
Default: #2b62fa (Blue)
This setting controls the color representation for bullish movements in the oscillator. The color appears when the oscillator value is positive (above zero), with intensity indicating the strength of the bullish momentum. A brighter shade indicates stronger bullish pressure.
Bearish Color
Default: #ce9851 (Amber)
This setting determines the color representation for bearish movements in the oscillator. The color appears when the oscillator value is negative (below zero), with intensity reflecting the strength of the bearish momentum. A more saturated shade indicates stronger bearish pressure.
Signal Settings
Signal Cooldown (bars)
Default: 10
Range: 1-50
This parameter sets the minimum number of bars that must pass before a new signal of the same type can be generated. Higher values reduce signal frequency and help prevent overtrading during choppy market conditions. Lower values increase signal sensitivity but may generate more false positives.
Min Change For New Signal
Default: 1.5
Range: 0.5-3.0
This setting defines the minimum required change in oscillator value between consecutive signals of the same type. It ensures that new signals represent meaningful changes in market conditions rather than minor fluctuations. Higher values produce fewer but potentially higher-quality signals, while lower values increase signal frequency.
AI Core Settings
Base Length
Default: 14
Minimum: 2
This fundamental setting determines the primary calculation period for all technical components in the ensemble (RSI, CCI, Stochastic, etc.). It represents the lookback window for each component’s base calculation. Shorter periods create a more responsive but potentially noisier oscillator, while longer periods produce smoother signals with potential lag.
Adaptive Speed
Default: 0.1
Range: 0.01-0.3
Controls how quickly the oscillator adapts to new market conditions through its volatility-adjusted smoothing mechanism. Higher values make the oscillator more responsive to recent price action but potentially more erratic. Lower values create smoother transitions but may lag during rapid market changes. This parameter directly influences the indicator’s adaptiveness to market volatility.
Learning Lookback Period
Default: 150
Minimum: 10
Determines the historical data range used to evaluate each ensemble component’s performance and calculate adaptive weights. This setting controls how far back the AI “learns” from past performance to optimize current signals. Longer periods provide more stable weight distribution but may be slower to adapt to regime changes. Shorter periods adapt more quickly but may overreact to recent anomalies.
Ensemble Size
Default: 5
Range: 2-5
Specifies how many technical components to include in the ensemble calculation.
Understanding The Interaction Between Settings
Base Length and Learning Lookback : The base length determines the reactivity of individual components, while the lookback period determines how their weights are adjusted. These should be balanced according to your timeframe - shorter timeframes benefit from shorter base lengths, while the lookback should generally be 10-15 times the base length for optimal learning.
Adaptive Speed and Signal Cooldown : These settings control sensitivity from different angles. Increasing adaptive speed makes the oscillator more responsive, while reducing signal cooldown increases signal frequency. For conservative trading, keep adaptive speed low and cooldown high; for aggressive trading, do the opposite.
Ensemble Size and Min Change : Larger ensembles provide more stable signals, allowing for a lower minimum change threshold. Smaller ensembles might benefit from a higher threshold to filter out noise.
Understanding Signal Confidence Levels
The indicator provides three distinct confidence levels for both bullish and bearish signals:
Average Confidence (▲ or ▼) : Basic signal that meets the minimum pattern and filtering criteria. These signals indicate potential reversals but with moderate confidence in the prediction. Consider using these as initial alerts that may require additional confirmation.
Above Average Confidence (▲+ or ▼+) : Higher reliability signal with stronger underlying metrics. These signals demonstrate greater consensus among the ensemble components and/or stronger historical performance. They offer increased probability of successful reversals and can be traded with less additional confirmation.
Excellent Confidence (▲++ or ▼++) : Highest quality signals with exceptional underlying metrics. These signals show strong agreement across oscillator components, excellent historical performance, and optimal signal strength. These represent the indicator’s highest conviction trade opportunities and can be prioritized in your trading decisions.
Confidence assessment is calculated through a multi-factor analysis including:
Historical performance of ensemble components
Degree of agreement between different oscillator components
Relative strength of the signal compared to historical thresholds
✅ Best Use Cases:
Identify potential market reversals through oscillator extremes
Filter trade signals based on AI-evaluated component weights
Monitor changing market conditions through oscillator direction and intensity
Confirm trade signals from other indicators with adaptive ensemble validation
Detect early momentum shifts through pattern recognition
Prioritize trading opportunities based on signal confidence levels
Adjust position sizing according to signal confidence (larger for ++ signals, smaller for standard signals)
⚠️ Limitations
Requires sufficient historical data for accurate performance scoring
Ensemble weights may lag during dramatic market condition changes
Higher ensemble sizes require more computational resources
Performance evaluation quality depends on the learning lookback period length
Even high confidence signals should be considered within broader market context
💡 What Makes This Unique
Adaptive Intelligence : Continuously adjusts component weights based on actual performance
Ensemble Methodology : Combines strength of multiple indicators while minimizing individual weaknesses
Volatility-Adjusted Smoothing : Provides appropriate sensitivity across different market conditions
Performance-Based Learning : Utilizes historical accuracy to improve future predictions
Intelligent Signal Filtering : Reduces noise and false signals through sophisticated filtering criteria
Multi-Level Confidence Assessment : Delivers nuanced signal quality information for optimized trading decisions
🔬 How It Works
The indicator processes market data through five main components:
Ensemble Component Calculation :
Normalizes traditional indicators to consistent scale
Includes RSI, CCI, Stochastic, MACD, and volume components
Adapts based on the selected ensemble size
Performance Evaluation :
Analyzes directional accuracy of each component
Calculates continuous performance scores
Determines adaptive component weights
Oscillator Integration :
Combines weighted components into unified oscillator
Applies volatility-based adaptive smoothing
Scales final values to -6 to 6 range
Signal Generation :
Detects potential reversal patterns
Applies cooldown and magnitude filters
Generates clear visual markers for qualified signals
Confidence Assessment :
Evaluates component agreement, historical accuracy, and signal strength
Classifies signals into three confidence tiers (average, above average, excellent)
Displays intuitive confidence indicators (no symbol, +, ++) alongside direction markers
💡 Note:
The AI Adaptive Oscillator performs optimally when used with appropriate timeframe selection and complementary indicators. Its adaptive nature makes it particularly valuable during changing market conditions, where traditional fixed-weight indicators often lose effectiveness. The ensemble approach provides a more robust analysis by leveraging the collective intelligence of multiple technical methodologies. Pay special attention to the signal confidence indicators to optimize your trading decisions - excellent (++) signals often represent the most reliable trade opportunities.

RSI Weighted Trend System I [InvestorUnknown]The RSI Weighted Trend System I is an experimental indicator designed to combine both slow-moving trend indicators for stable trend identification and fast-moving indicators to capture potential major turning points in the market. The novelty of this system lies in the dynamic weighting mechanism, where fast indicators receive weight based on the current Relative Strength Index (RSI) value, thus providing a flexible tool for traders seeking to adapt their strategies to varying market conditions.
Dynamic RSI-Based Weighting System
The core of the indicator is the dynamic weighting of fast indicators based on the value of the RSI. In essence, the higher the absolute value of the RSI (whether positive or negative), the higher the weight assigned to the fast indicators. This enables the system to capture rapid price movements around potential turning points.
Users can choose between a threshold-based or continuous weight system:
Threshold-Based Weighting: Fast indicators are activated only when the absolute RSI value exceeds a user-defined threshold. Below this threshold, fast indicators receive no weight.
Continuous Weighting: By setting the weight threshold to zero, the fast indicators always receive some weight, although this can result in more false signals in ranging markets.
// Calculate weight for Fast Indicators based on RSI (Slow Indicator weight is kept to 1 for simplicity)
f_RSI_Weight_System(series float rsi, simple float weight_thre) =>
float fast_weight = na
float slow_weight = na
if weight_thre > 0
if math.abs(rsi) <= weight_thre
fast_weight := 0
slow_weight := 1
else
fast_weight := 0 + math.sqrt(math.abs(rsi))
slow_weight := 1
else
fast_weight := 0 + math.sqrt(math.abs(rsi))
slow_weight := 1
Slow and Fast Indicators
Slow Indicators are designed to identify stable trends, remaining constant in weight. These include:
DMI (Directional Movement Index) For Loop
CCI (Commodity Channel Index) For Loop
Aroon For Loop
Fast Indicators are more responsive and designed to spot rapid trend shifts:
ZLEMA (Zero-Lag Exponential Moving Average) For Loop
IIRF (Infinite Impulse Response Filter) For Loop
Each of these indicators is calculated using a for-loop method to generate a moving average, which captures the trend of a given length range.
RSI Normalization
To facilitate the weighting system, the RSI is normalized from its usual 0-100 range to a -1 to 1 range. This allows for easy scaling when calculating weights and helps the system adjust to rapidly changing market conditions.
// Normalize RSI (1 to -1)
f_RSI(series float rsi_src, simple int rsi_len, simple string rsi_wb, simple string ma_type, simple int ma_len) =>
output = switch rsi_wb
"RAW RSI" => ta.rsi(rsi_src, rsi_len)
"RSI MA" => ma_type == "EMA" ? (ta.ema(ta.rsi(rsi_src, rsi_len), ma_len)) : (ta.sma(ta.rsi(rsi_src, rsi_len), ma_len))
Signal Calculation
The final trading signal is a weighted average of both the slow and fast indicators, depending on the calculated weights from the RSI. This ensures a balanced approach, where slow indicators maintain overall trend guidance, while fast indicators provide timely entries and exits.
// Calculate Signal (as weighted average)
sig = math.round(((DMI*slow_w) + (CCI*slow_w) + (Aroon*slow_w) + (ZLEMA*fast_w) + (IIRF*fast_w)) / (3*slow_w + 2*fast_w), 2)
Backtest Mode and Performance Metrics
This version of the RSI Weighted Trend System includes a comprehensive backtesting mode, allowing users to evaluate the performance of their selected settings against a Buy & Hold strategy. The backtesting includes:
Equity calculation based on the signals generated by the indicator.
Performance metrics table comparing Buy & Hold strategy metrics with the system’s signals, including: Mean, positive, and negative return percentages, Standard deviations (of all, positive and negative returns), Sharpe Ratio, Sortino Ratio, and Omega Ratio
f_PerformanceMetrics(series float base, int Lookback, simple float startDate, bool Annualize = true) =>
// Initialize variables for positive and negative returns
pos_sum = 0.0
neg_sum = 0.0
pos_count = 0
neg_count = 0
returns_sum = 0.0
returns_squared_sum = 0.0
pos_returns_squared_sum = 0.0
neg_returns_squared_sum = 0.0
// Loop through the past 'Lookback' bars to calculate sums and counts
if (time >= startDate)
for i = 0 to Lookback - 1
r = (base - base ) / base
returns_sum += r
returns_squared_sum += r * r
if r > 0
pos_sum += r
pos_count += 1
pos_returns_squared_sum += r * r
if r < 0
neg_sum += r
neg_count += 1
neg_returns_squared_sum += r * r
float export_array = array.new_float(12)
// Calculate means
mean_all = math.round((returns_sum / Lookback) * 100, 2)
mean_pos = math.round((pos_count != 0 ? pos_sum / pos_count : na) * 100, 2)
mean_neg = math.round((neg_count != 0 ? neg_sum / neg_count : na) * 100, 2)
// Calculate standard deviations
stddev_all = math.round((math.sqrt((returns_squared_sum - (returns_sum * returns_sum) / Lookback) / Lookback)) * 100, 2)
stddev_pos = math.round((pos_count != 0 ? math.sqrt((pos_returns_squared_sum - (pos_sum * pos_sum) / pos_count) / pos_count) : na) * 100, 2)
stddev_neg = math.round((neg_count != 0 ? math.sqrt((neg_returns_squared_sum - (neg_sum * neg_sum) / neg_count) / neg_count) : na) * 100, 2)
// Calculate probabilities
prob_pos = math.round((pos_count / Lookback) * 100, 2)
prob_neg = math.round((neg_count / Lookback) * 100, 2)
prob_neu = math.round(((Lookback - pos_count - neg_count) / Lookback) * 100, 2)
// Calculate ratios
sharpe_ratio = math.round(mean_all / stddev_all * (Annualize ? math.sqrt(Lookback) : 1), 2)
sortino_ratio = math.round(mean_all / stddev_neg * (Annualize ? math.sqrt(Lookback) : 1), 2)
omega_ratio = math.round(pos_sum / math.abs(neg_sum), 2)
// Set values in the array
array.set(export_array, 0, mean_all), array.set(export_array, 1, mean_pos), array.set(export_array, 2, mean_neg),
array.set(export_array, 3, stddev_all), array.set(export_array, 4, stddev_pos), array.set(export_array, 5, stddev_neg),
array.set(export_array, 6, prob_pos), array.set(export_array, 7, prob_neu), array.set(export_array, 8, prob_neg),
array.set(export_array, 9, sharpe_ratio), array.set(export_array, 10, sortino_ratio), array.set(export_array, 11, omega_ratio)
// Export the array
export_array
The metrics help traders assess the effectiveness of their strategy over time and can be used to optimize their settings.
Calibration Mode
A calibration mode is included to assist users in tuning the indicator to their specific needs. In this mode, traders can focus on a specific indicator (e.g., DMI, CCI, Aroon, ZLEMA, IIRF, or RSI) and fine-tune it without interference from other signals.
The calibration plot visualizes the chosen indicator's performance against a zero line, making it easy to see how changes in the indicator’s settings affect its trend detection.
Customization and Default Settings
Important Note: The default settings provided are not optimized for any particular market or asset. They serve as a starting point for experimentation. Traders are encouraged to calibrate the system to suit their own trading strategies and preferences.
The indicator allows deep customization, from selecting which indicators to use, adjusting the lengths of each indicator, smoothing parameters, and the RSI weight system.
Alerts
Traders can set alerts for both long and short signals when the indicator flips, allowing for automated monitoring of potential trading opportunities.

Pulse Oscillator [UAlgo]The "Pulse Oscillator " is a trading tool designed to capture market momentum and trend changes by combining the strengths of multiple well-known technical indicators. By integrating the RSI (Relative Strength Index), CCI (Commodity Channel Index), and Stochastic Oscillator, this indicator provides traders with a comprehensive view of market conditions, offering both trend filtering and precise buy/sell signals. The oscillator is customizable, allowing users to fine-tune its parameters to match different trading strategies and timeframes. With its built-in smoothing techniques and level adjustments, the Pulse Oscillator aims to be a reliable tool for both trend-following and counter-trend trading strategies.
🔶 Key Features
Multi-Indicator Integration: Combines RSI, CCI, and Stochastic Oscillator to create a weighted momentum oscillator.
Why Use Multi-Indicator Integration?
Script uses Multi-Indicator Integration to combine the strengths of different technical indicators—such as RSI, CCI, and Stochastic Oscillator—into a single tool. This approach helps to reduce the weaknesses of individual indicators, providing a more comprehensive and reliable analysis of market conditions. By integrating multiple indicators, we can generate more accurate signals, filter out noise, and enhance our trading decisions.
Customizable Parameters: Allows users to adjust weights, periods, and smoothing techniques, providing flexibility to adapt the indicator to various market conditions.
Trend Filtering Option: An optional trend filter is available to enhance the accuracy of buy and sell signals, reducing the risk of false signals in choppy markets.
Dynamic Levels: The indicator dynamically calculates multiple levels of support and resistance, adjusting to market conditions with customizable decay factors and offsets.
Visual Clarity: The indicator visually represents different levels and trends with color-coded plots and fills, making it easier for traders to interpret market conditions at a glance.
Alerts: Configurable alerts for buy and sell signals, as well as trend changes, enabling traders to stay informed of key market movements without constant monitoring.
🔶 Interpreting the Indicator
Buy Signal: A buy signal is generated when the Slow Line crosses under the Fast Line during an uptrend or when the trend filter is disabled. This indicates a potential bullish reversal or continuation of an upward trend.
Sell Signal: A sell signal occurs when the Slow Line crosses above the Fast Line during a downtrend or when the trend filter is disabled, signaling a potential bearish reversal or continuation of a downward trend.
Trend Change: The indicator detects trend changes when the Fast Line shifts from increasing to decreasing or vice versa, providing early warning of possible market reversals.
Dynamic Levels: The indicator calculates upper and lower levels based on the Fast Line's values. These levels can be used to identify overbought or oversold conditions and potential areas of support or resistance.
🔶 Disclaimer
Use with Caution: This indicator is provided for educational and informational purposes only and should not be considered as financial advice. Users should exercise caution and perform their own analysis before making trading decisions based on the indicator's signals.
Not Financial Advice: The information provided by this indicator does not constitute financial advice, and the creator (UAlgo) shall not be held responsible for any trading losses incurred as a result of using this indicator.
Backtesting Recommended: Traders are encouraged to backtest the indicator thoroughly on historical data before using it in live trading to assess its performance and suitability for their trading strategies.
Risk Management: Trading involves inherent risks, and users should implement proper risk management strategies, including but not limited to stop-loss orders and position sizing, to mitigate potential losses.
No Guarantees: The accuracy and reliability of the indicator's signals cannot be guaranteed, as they are based on historical price data and past performance may not be indicative of future results.

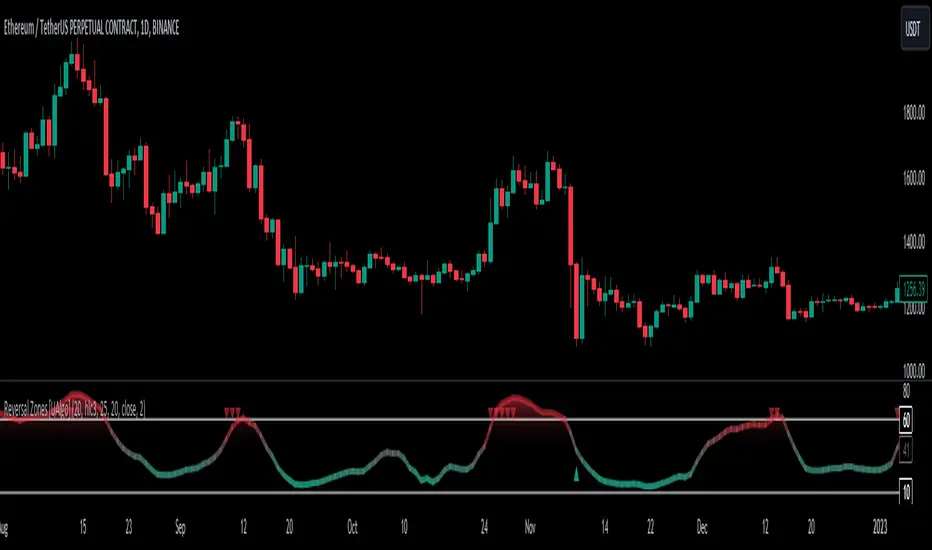
Reversal Zones [UAlgo]🔶Description:
"Reversal Zones " aims to identify potential reversal zones in price movements. The indicator provides visual signals on the chart, indicating potential overbought and oversold conditions based on the calculated values. It offers traders insights into possible turning points in the market, aiding in decision-making processes regarding entry and exit points.
🔶Key Features:
Bollinger Bands Percentile (BB Percentile):
Bollinger Bands Percentile is utilized in this script to gauge the current price position relative to its recent volatility. By calculating the percentile rank of the current price within the Bollinger Bands, traders can identify extreme price levels. This assists in recognizing potential overbought or oversold conditions, where price may be due for a reversal.
Choppiness Index (CI):
The Choppiness Index is employed here to measure the market's trendiness or choppiness. By evaluating the efficiency of the price movement, CI helps traders determine whether the market is trending or consolidating.
Commodity Channel Index (CCI):
The Commodity Channel Index is integrated into this script to capture price momentum. CCI quantifies the relationship between the current price, a moving average, and standard deviation. Traders use CCI to identify overbought or oversold conditions and potential trend reversals.
By averaging and smoothing these values, traders can obtain a clearer picture of potential turning points in the market. The final smoothed combination signal aims to reduce noise and provide more reliable insights.
🔶Disclaimer:
Please note that this script is provided for informational and educational purposes only and should not be considered as financial advice.
Trading in financial markets involves risk, and past performance is not necessarily indicative of future results.
Users should conduct their own research and analysis or consult with a qualified financial advisor before making any investment decisions based on this indicator.
The creators of this script are not liable for any losses incurred from trading activities.
EUR/USD 45 MIN Strategy - FinexBOTThis strategy uses three indicators:
RSI (Relative Strength Index) - It indicates if a stock is potentially overbought or oversold.
CCI (Commodity Channel Index) - It measures the current price level relative to an average price level over a certain period of time.
Williams %R - It is a momentum indicator that shows whether a stock is at the high or low end of its trading range.
Long (Buy) Trades Open:
When all three indicators suggest that the stock is oversold (RSI is below 25, CCI is below -130, and Williams %R is below -85), the strategy will open a buy position, assuming there is no current open trade.
Short (Sell) Trades Open:
When all three indicators suggest the stock is overbought (RSI is above 75, CCI is above 130, and Williams %R is above -15), the strategy will open a sell position, assuming there is no current open trade.
SL (Stop Loss) and TP (Take Profit):
SL (Stop Loss) is 0.45%.
TP (Take Profit) is 1.2%.
The strategy automatically sets these exit points as a percentage of the entry price for both long and short positions to manage risks and secure profits. You can easily adopt these inputs according to your strategy. However, default settings are recommended.

Extreme Entry with Mean Reversion and Trend FilterThis non-repainting indicator is an improved version of my previous work, a more versatile tool designed to provide traders with dynamic and adaptive entry signals while incorporating a mean reversion and trend filtering mechanism. By combining RSI overbought/oversold, regular divergence and confirmatory momentum oscillator such as CCI or MOM, this indicator generates more precise and timely signals for entering trades.
The indicator offers a comprehensive set of entry conditions for both Buy and Sell entries:
• For Buy entries, it checks for oversold conditions based on RSI levels, and detects bullish divergence patterns while oversold and it identifies upward crossovers in the selected entry signal source (CCI or Momentum).
• Similarly, for Sell entries, it identifies downward crossovers of the CCI or Mom, after the recent overbought conditions, and bearish divergence patterns inside the overbought RSI.
To refine the entry signals even further, the indicator utilizes a mean reversion filter. Traders can choose to display signals that occur inside or outside the upper and lower mean reversion bands:
• Range Entries are indicating potential buying opportunities near the lower band and selling opportunities near the upper band. This is based on the concept of mean reversion, which suggests that prices tend to return to the average when they reach the upper or lower bands. By focusing on these signals, traders can take advantage of price movements that have a higher probability of reversing towards the mean.
• Extreme Entries, on the other hand, represent signals that occur outside of the bands, signaling potential pullbacks during strong trends. By entering positions only at extreme highs or lows, traders can avoid getting caught in the middle of the trend. This approach helps traders capitalize more favorable trading opportunities which have a high reward-risk ratio.
Trend Filter acts as a directional bias for the entry signals. When enabled, long and short entry conditions are filtered based on the relationship between the closing price and the EMA.
Traders have the flexibility to customize, tweak the indicator filter and values in the settings according to their preferences strategies and traded assets, tailoring the signals to their specific needs. The script sets alert conditions to trigger alerts for buy, sell, or both entry signals. This indicator can be used in conjunction with price action or other technical analysis tools for confirmation and better trading decisions.
I created this indicator for my own use, and I share this for informational purposes only. It does not constitute financial advice so use at your own risk and consider your financial situation before making any trading decisions. The indicator's accuracy is not guaranteed, and past performance is not indicative of future results.
I appreciate your feedback on this indicator. As I am new to script development, I am open to comments and suggestions to improve it. If you encounter any issues while using this indicator, please let me know in the comments section. If you find it helpful, I kindly ask for your support in boosting it. Thank you for your cooperation.

Color Agreement Aggregate (CAA)This indicator helps finding patterns within market structure in a highly intuitive manner.
It does this by painting a picture instead of presenting numerical values.
It greatly reduces noise in trend/structure analysis.
----- HOW TO USE IT -----
1) Zoom out of chart to get a clearer picture of overall color patterns.
2) Consider areas of intense reds and greens as areas of interest.
3) There is always a pattern of intense reds followed by intense greens. Consider this pattern as the start of a new cycle.
4) Key spikes and dips are shown when all 3 bands are matching of intense colors.
5) Turn on Precision in the Style tab to get more information on decisive spikes in price (See "Precision" below).
Reach (top band):
This is the fast and more volatile movement of the market. It shows the direction in which the recent price action is reaching towards.
Energy (middle band):
This is the medium speed of market movement. It shows the energy of the Reach and how influential it is to market change.
Frequent and intense change of color in this band can be a precursor of change within the Basis.
Basis (bottom band):
This is the slower, broader movement of the market. It is the basis on which the Reach and Energy sit on.
Intense colors in this band show major changes in price levels and market structure.
Precision:
Precision shows the weaker levels of colors. It does this by making bars in a band half its size.
For example, if there is a light green bar that is half, it means that the current bar is on the weaker level of the light green level.
Precision helps in identifying where there are influential moves in price action. Note, there will never be a half-sized bar in the highest and lowest levels.
This is because these levels are the limits and don't have a weaker half.
See notes in chart for more information. Note, you can turn off the labels in the Style tab.
----- HOW THIS INDICATOR IS ORIGINAL; WHAT IT DOES AND HOW IT DOES IT -----
This indicator has an original, unique ability to paint the overall market structure in a highly intuitive manner. It "paints" an image instead of showing numbers.
It does this by color-coding different levels of varying speeds of market movement. It then presents these levels as simple bars.
Finally, it stacks them all and creates an overall image of clear breaks and/or repeats within market structure.
This greatly reduces noise in pattern finding, finding breaks in market structure, and in confirming repeated patterns.
----- VERSION -----
The only significant information from this indicator are the colors themselves and the patterns, agreement, and aggregate of the colors.
This indicator does not provide any numerical information of the underlying, mathematical calculations.
The levels for the Reach are made by the KPAM; for the Energy, the CCI; and for the Basis, the RSI.
However, this indicator is not a variant, replacement, or presentation of the KPAM, CCI, or the RSI in any way, shape, or form -- this indicator does not present itself as such.
The 3 indicators are only useful to this indicator in as much as they are what the colors are derived from -- nothing more.
They are needed in order to obtain, visualize, and create the overall aggregate and agreement of colors.
Thus, the KPAM, CCI, and RSI cannot be adjust nor are they plotted. They are not, in any way, a focus of this indicator.