cryptomars signal short 2.0Description:
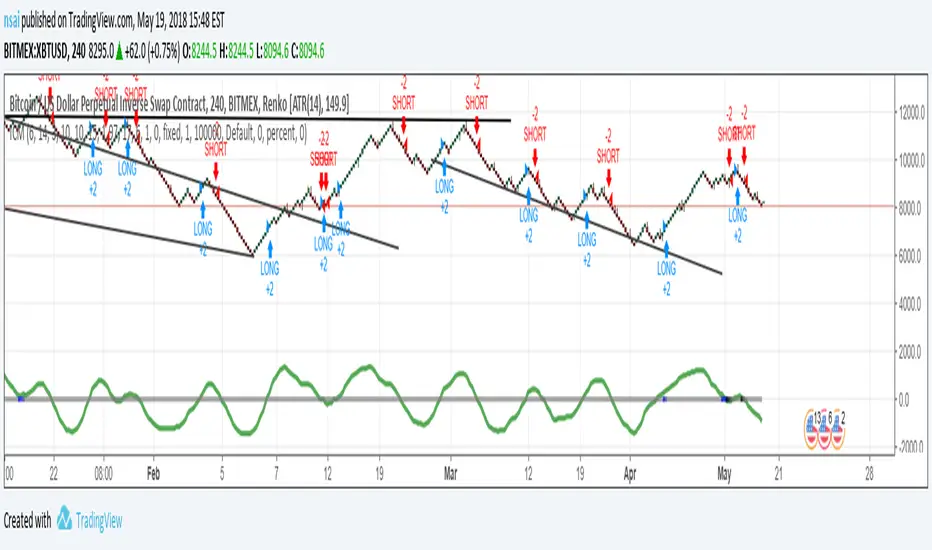
1. In the indicator, there is an orange signal that fluctuates linearly. It is a buy signal when it goes from bottom to top. When the signal line remains in the upper position, it indicates a multi-party trend.
2. When it goes from top to bottom, it indicates a sell signal. When the signal line remains below, it indicates a sales trend.
3. Depending on the time level, when the position of the signal line changes, determine whether the current candle is completed or not according to the time level of the chart you selected to determine the signal. For example, if you select a chart level of 5 meters, then when the signal line changes, for example, it will send a sell signal from top to bottom. At this time, please do not rush to sell. You should wait for this 5 meter candlestick to complete. When the candle is over and the next candle is started, if the signal line remains in the top-down form, the sell signal is normal and you can sell it.
Because the position of the signal appears, it is the location of the sale. During the completion of the candlestick , the signal may disappear after disappearing. We only have to wait for a while to get a more stable deal.
4. The alarm setting is very simple. There are two lines in the indicator. One is the orange signal line that fluctuates up and down, and the other is the fixed zero line of “zero”.
We set it in the alarm. When the signal line passes "zero" from the top, the short signal is sent only when the candle map is completed. When the signal line passes "zero" from "up" below, the signal is sent for a long time when the candlestick is completed.
One trick, the appearance of the signal, is that the price runs in one direction for a while, so it appears at or near the bottom. Because, when we have already made a profit in the transaction, we can make a profit in advance, and we do not need to wait for the opposite signal to stop the profit and reduce the risk of profit retracement.
Because in this market, the fluctuations are very large, and the people who compete are also very fierce. What we need to do is to make every transaction as possible, and we are all profitable. If we sell and find that the price is still rising, please don't feel sorry, don't consider eating all the profits.
6. When the signal appears, in most cases, even in the impact trend, it will still run a distance in the direction of the signal, that is, you will profit, so please close the position and make a profit in time. Otherwise, when the price volatility is too small, you miss the profit point, the price starts to run in the opposite direction, and you may change from profit to loss.
BITMEX's trailing stop loss is a great feature, please use it flexibly.
7, if it is a shock trend, please try not to trade.
8. We recommend that you turn on the “cryptomars 3.0” and “cryptomars 1.0” indicators. No matter who signs the trade first, you can trade, which can help you get more profit.
9. Remember, I hope this indicator will be your powerful assistant, but please don't rely on it completely. Learning more trading knowledge and skills is even more important. Therefore, when we consider the profitable position, you can use your trading skills, MACD , KDJ, etc. to assist and profit in a more suitable position.
Cerca negli script per "Candlestick"

cryptomars signal 3.0Description:
1. In the indicator, there is an orange signal that fluctuates linearly. It is a buy signal when it goes from bottom to top. When the signal line remains in the upper position, it indicates a multi-party trend.
2. When it goes from top to bottom, it indicates a sell signal. When the signal line remains below, it indicates a sales trend.
3. Depending on the time level, when the position of the signal line changes, determine whether the current candle is completed or not according to the time level of the chart you selected to determine the signal. For example, if you select a chart level of 5 meters, then when the signal line changes, for example, it will send a sell signal from top to bottom. At this time, please do not rush to sell. You should wait for this 5 meter candlestick to complete. When the candle is over and the next candle is started, if the signal line remains in the top-down form, the sell signal is normal and you can sell it.
Because the position of the signal appears, it is the location of the sale. During the completion of the candlestick , the signal may disappear after disappearing. We only have to wait for a while to get a more stable deal.
4. The alarm setting is very simple. There are two lines in the indicator. One is the orange signal line that fluctuates up and down, and the other is the fixed zero line of “zero”.
We set it in the alarm. When the signal line passes "zero" from the top, the short signal is sent only when the candle map is completed. When the signal line passes "zero" from "up" below, the signal is sent for a long time when the candlestick is completed.
One trick, the appearance of the signal, is that the price runs in one direction for a while, so it appears at or near the bottom. Because, when we have already made a profit in the transaction, we can make a profit in advance, and we do not need to wait for the opposite signal to stop the profit and reduce the risk of profit retracement.
Because in this market, the fluctuations are very large, and the people who compete are also very fierce. What we need to do is to make every transaction as possible, and we are all profitable. If we sell and find that the price is still rising, please don't feel sorry, don't consider eating all the profits.
6. When the signal appears, in most cases, even in the impact trend, it will still run a distance in the direction of the signal, that is, you will profit, so please close the position and make a profit in time. Otherwise, when the price volatility is too small, you miss the profit point, the price starts to run in the opposite direction, and you may change from profit to loss.
BITMEX's trailing stop loss is a great feature, please use it flexibly.
7, if it is a shock trend, please try not to trade.
8. We recommend that you turn on the “cryptomars 2.0” and “cryptomars 1.0” indicators. No matter who signs the trade first, you can trade, which can help you get more profit.
9. Remember, I hope this indicator will be your powerful assistant, but please don't rely on it completely. Learning more trading knowledge and skills is even more important. Therefore, when we consider the profitable position, you can use your trading skills, MACD , KDJ, etc. to assist and profit in a more suitable position.

VMA - Volume Moving AverageA Short Term trading indicator that measure the overall direction of volume compared to price. Kills in Heikin Ashi, but wanted to show it kills in candlesticks too :)

ICM_novolatileThis script is a fork of the previous script with things still in works. Use renko candlesticks with suitable timeframe. This script tends to not trade low volatility, hence eliminates weaker calls.
Trend Cross StrategyMoving average cross strategy with a custom trend line that allows for better positioning when buying and selling.
1. Shorts positions at ideal times to protect from large drops
2. Captures full gains when the price is mooning.
3. Makes small gains while the market is sideways and trending downward
*Intended for Bot Trading, but can be used on larger time frames for manual trading.
**Use Heikin-Ashi Candlesticks

Altcoin-BTC TidesRider (beats Buy & Hold) BINANCE:EOSBTC
参数基于Binance的EOSBTC。不同交易对有不同DNA,没有万金油策略,需要调整参数。
基于均线
双均线过滤信号
Haiken Ashi蜡烛图过滤信号
通过量能放大来“偷鸡”赚取利润
不断改进中.
Based on Moving Average
Use dual SMA to filter false signals
Use Haiken Ashi candlesticks to filter false signals
Volume sensitive buy and sell to obtain higher profit
Default settings are based on EOSBTC on Binance and are overfitted to produce good backtest results, however this is normal as each trading pair has its own DNA hence optimal settings.
I welcome suggestions of improvements.
Ongoing improvement.
Contact me for subscription.
Disclaimer: The strategy does not form or provide financial advice regarding investment. Use at your own risk.

ICM_editionThe Bot is best suited to be used with 30m charts and Heikin Ashi Candlesticks, although if you aren’t proficient in trading, I suggest the use of 4H candles stick to filter out weak signals. Use of other indicators to further validate the calls is always recommended.

Starting TemplateThis script sets defaults that I like to start with:
Trade commission set to 0.25%
Allow multiple buys before sells
Fixed trade size
Also included are setting a minimum desired gain (change gain_protection to 0 if you want to sell regardless of your gain), and buying only if it will reduce your average bought price (change avg_protection to 0 to turn this feature off).
This strategy only takes long positions since Gunbot does not make short positions.
We also start the backtesting at a specific time, to avoid going over the maximum of 2000 trades. Especially helpful when trying to tune a high frequency strategy, or when comparing the efficacy of a strategy on candlesticks with different time periods (this is why I did not use max bars back).
Cheers!
Line Break StrategyLine Break Strategy
Entry rule:
Long on a bullish line and short on a bearish line.
Backtest:
Profit factors are shown below for three-line break.
Daily time frame, FXCM broker.
EURUSD: 1.267, USDJPY: 1.039, GBPUSD: -0.816, AUDUSD: -0.959
S&P500: -0.783, Nikkei225: 1.099
CrudeOil: 1.03, Gold: 1.196
BTCUSD: -0.883
Reference:
Steve Nison, Beyond Candlesticks - New Japanese Charting Techniques Revealed
Note:
This strategy doesn't work properly on the linebreak chart.
A good example is shown below. The entry prices are not always correct.
If you have signal, but the next candle moves in the opposite direction, the entry price is drawn at the Open of the new candle instead of the Close of the previous candle.
The results of backtest are unreliable due to this reason.

ECO Strategy Backtest We call this one the ECO for short, but it will be listed on the indicator list
at W. Blau’s Ergodic Candlestick Oscillator. The ECO is a momentum indicator.
It is based on candlestick bars, and takes into account the size and direction
of the candlestick "body". We have found it to be a very good momentum indicator,
and especially smooth, because it is unaffected by gaps in price, unlike many other
momentum indicators.
We like to use this indicator as an additional trend confirmation tool, or as an
alternate trend definition tool, in place of a weekly indicator. The simplest way
of using the indicator is simply to define the trend based on which side of the "0"
line the indicator is located on. If the indicator is above "0", then the trend is up.
If the indicator is below "0" then the trend is down. You can add an additional
qualifier by noting the "slope" of the indicator, and the crossing points of the slow
and fast lines. Some like to use the slope alone to define trend direction. If the
lines are sloping upward, the trend is up. Alternately, if the lines are sloping
downward, the trend is down. In this view, the point where the lines "cross" is the
point where the trend changes.
When the ECO is below the "0" line, the trend is down, and we are qualified only to
sell on new short signals from the Hi-Lo Activator. In other words, when the ECO is
above 0, we are not allowed to take short signals, and when the ECO is below 0, we
are not allowed to take long signals.
You can change long to short in the Input Settings
Please, use it only for learning or paper trading. Do not for real trading.

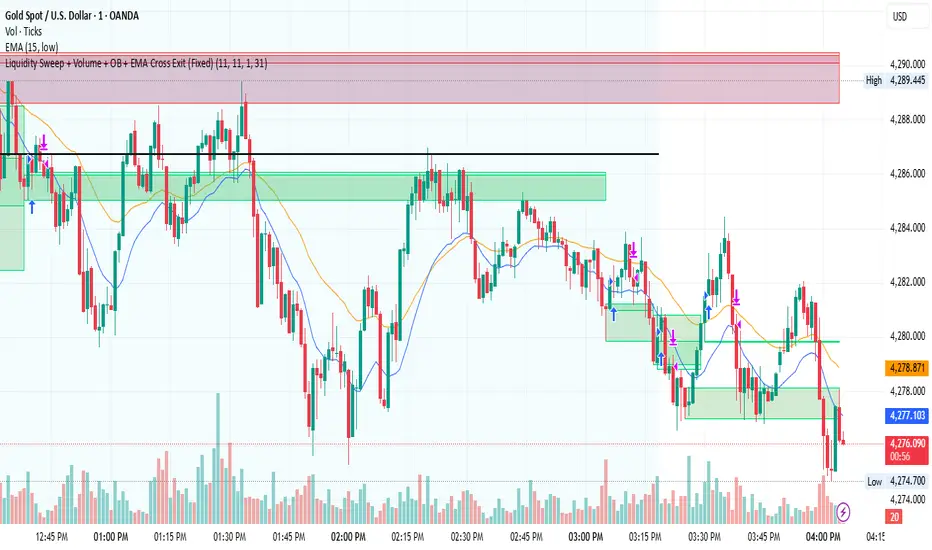
Liquidity Sweep + Volume + OB + EMA Cross Exit This strategy is a smart-money–inspired trading system designed to capture high-probability reversals after liquidity is taken from the market.
It combines liquidity sweeps, volume confirmation, order block validation, and a dynamic EMA-based exit to control risk and let profits run.
Core Concept
Institutions first take liquidity, then move price in the real direction.
This strategy aims to enter after liquidity is swept and price shows confirmation.
1️⃣ Liquidity Sweep Detection
2️⃣ Volume Confirmation
3️⃣ Order Block Identification
4️⃣ EMA Trend Filter (Optional Entry Bias)
5️⃣ Trade Entry Logic
6️⃣ Exit Strategy – EMA Cross Exit
Benefits:
Lets strong trends run
Exits automatically when momentum weakens
Adapts to different market conditions
🛡 Risk & Trade Management
One trade at a time (anti-overtrading logic)
Early exit if trade moves against position after a few bars
Opposite signal forces exit
EMA cross provides trend-based exit
GOLD 5m PA ScalperXAUUSD 5-Minute Price Action Scalper with HTF Confirmation
This Pine Script is a trend-following scalping strategy designed specifically for XAUUSD (Gold) on the 1,3,5-minute timeframe.
Its main goal is to reduce noise and false signals by combining lower-timeframe price action with higher-timeframe (15-minute) structure.
CORE IDEA
Trade only in the direction of the dominant trend and only when price reacts from a strong higher-timeframe Order Block.

Follow the "Smart Money" to Capture Altcoin Super-Trends這不是一套普通的趨勢策略。大多數山寨幣 (Altcoins) 的突破策略之所以失效,是因為它們忽略了市場的真實驅動力——比特幣的機構資金流向。 ITAS (Institutional Triggered Alpha System) 是一套結合了「跨市場分析」與「波動率自適應」的量化系統。
核心運作邏輯:
機構資金濾網 (Institutional Filter): 我們監控比特幣 (BTC) 在頂級合規交易所(如 Coinbase)與全球流動性池之間的資金溢價 (Premium)。這是一個領先指標,用來判斷華爾街機構是在「吸籌」還是「派發」。
精準狙擊 (Precision Trigger): 只有當監測到**「機構資金正在買入 BTC」**的時刻,系統才會解鎖山寨幣的交易權限。
拒絕假突破 (False Breakout Rejection): 透過這個濾網,我們能過濾掉市場中 80% 由散戶情緒引起的「假突破」。如果比特幣沒有機構支撐,就算山寨幣漲得再兇,本策略也會判定為雜訊而拒絕進場。
波動率適配 (Volatility Adaptation): 針對高波動資產 (High Beta Assets) 優化的動態通道,確保在劇烈洗盤中能拿住單子,吃到完整的波段利潤。
This is not an ordinary trend-following strategy. Most Altcoin breakout strategies fail because they ignore the true driver of the market—Institutional Money Flow in Bitcoin. ITAS (Institutional Triggered Alpha System) is a quantitative system that combines "Inter-market Analysis" with "Volatility Adaptation."
How It Works:
Institutional Filter: We monitor the Premium Gap of Bitcoin (BTC) between top-tier regulated exchanges (like Coinbase) and global liquidity pools. This serves as a leading indicator to determine whether Wall Street institutions are "Accumulating" or "Distributing."
Precision Trigger: The system only unlocks trading permissions for Altcoins when it detects "Institutional Buying in BTC."
False Breakout Rejection: Through this filter, we effectively filter out 80% of "False Breakouts" driven solely by retail sentiment. If there is no institutional support behind Bitcoin, the strategy will identify any Altcoin pump as noise and refuse to enter.
Volatility Adaptation: Features a dynamic channel optimized for High Beta Assets, ensuring positions are held through aggressive shakeouts to capture the full trend.
免責聲明 (Disclaimer)
補充說明: 以上策略績效源自歷史數據回測,不代表對未來獲利的保證。加密貨幣市場風險極高,本策略僅供量化研究與邏輯分享,使用者應自行評估風險並自負盈虧,本人不承擔任何交易損失。
Disclaimer: The performance above is based on historical backtesting and does not guarantee future results. Cryptocurrency trading involves high risk. This strategy is shared for quantitative research and educational purposes only. Users are solely responsible for their own risk assessment and PnL. I assume no liability for any trading losses incurred.

BRT Support MA [STRATEGY] v2BRT Support MA Strategy v2 - Dynamic Support Line Strategy
📊 Strategy Description
BRT Support MA Strategy v2 is an automated trading strategy based on the analysis of dynamic support and resistance levels using volatility calculations on higher timeframes. The strategy is designed to identify key trend reversal moments and enter positions with optimal risk-to-reward ratios.
🎯 Key Features
Unique strategy characteristics:
1. Multi-Timeframe Volatility Analysis - indicators are calculated on a user-selected timeframe, which allows filtering market noise and obtaining more reliable signals
2. Adaptive Hedging System - a unique algorithm for dynamic position volume calculation during reversals, which accounts for current drawdown and automatically adjusts order size for optimal risk management
3. Visual Trend Indication - dynamic color change of the main line (green = uptrend, red = downtrend) for quick assessment of current market conditions
4. Automatic Signal Markers - the strategy marks trend change moments on the chart with arrows for convenient analysis
5. Limit Orders - entries into positions occur via limit orders at key levels, ensuring better price execution
⚙️ Strategy Settings
Support MA Length - calculation period for the main support/resistance line
Support MA Timeframe - timeframe for indicator calculations (can be set higher than current for noise filtering)
TP (%) - take profit percentage from entry point
SL (%) - stop loss percentage from entry point
Hedge Multiplier - volume multiplier for hedging positions during reversals
📈 Operating Logic
The strategy analyzes the relationship between two dynamic levels calculated based on market volatility. When price breaks through the main support level in the direction of the trend:
Long positions are opened when the main indicator is in an uptrend and price breaks above it
Short positions are opened when the main indicator is in a downtrend and price breaks below it
When there is an open position and an opposite signal forms, the strategy automatically calculates the optimal volume for a hedging position based on the percentage price movement and the set take profit.
🎨 Visual Elements
Blue/Green/Red line - main dynamic support/resistance level (color changes depending on current trend)
Green arrows down ▼ - uptrend reversal signals
Red arrows up ▲ - downtrend reversal signals
TP and SL - displayed in data window for current open position
💡 Usage Recommendations
Test the strategy on historical data of different instruments before use
Optimize parameters for the specific trading instrument and timeframe
Configure TP/SL parameters according to your trading system and risk tolerance
Hedge Multiplier controls hedging system aggressiveness - start with conservative values
⚠️ DISCLAIMER
IMPORTANT! PLEASE READ BEFORE USE:
This script is provided for educational and research purposes only . It is intended for testing on historical data and studying algorithmic trading approaches.
The author is NOT responsible for:
Any financial losses incurred as a result of using this strategy
Trading results in real-time or on demo accounts
Losses arising from incorrect parameter configuration
Technical failures, slippage, and other market conditions
Trading involves a high level of risk and is not suitable for all investors. You can lose all of your invested capital. Do not invest money you cannot afford to lose.
Before starting real trading:
Conduct thorough testing on historical data
Ensure you fully understand the strategy's operating logic
Consult with a financial advisor
Consider broker commissions and slippage
Start with minimum volumes
Past performance does not guarantee future profitability. Use of the strategy is at your own risk.
© MaxBRFZCO | Version 2.0 | Pine Script v5
For questions and suggestions, please use comments under the publication

Macro-Filtered Volatility Breakout (MVB)策略簡介:
這是一套專門針對高 Beta 值資產(如 ETH, SOL 等山寨幣)設計的趨勢跟隨系統。我們解決了傳統突破策略在山寨幣市場中「假突破(False Breakout)」過多的痛點。
核心邏輯:
市場體制過濾(Regime Filtering): 加密貨幣市場具有高度的相關性。本策略引入比特幣(BTC)作為**「宏觀市場指標」**,只有當 BTC 處於確立的多頭趨勢時,才允許執行山寨幣的做多信號。這有效規避了「大盤崩盤時,小幣假突破」的系統性風險。
動態波動率通道: 我們不使用固定價格止損,而是採用肯特納通道(Keltner Channels)。這利用 ATR(平均真實波幅)動態調整進出場區間:在市場平靜時通道收窄以敏銳捕捉啟動點,在劇烈波動時通道放寬以避免被雜訊洗出場。
風控特徵:
系統性避險: 透過 BTC 趨勢濾網,在熊市或大盤回調期間自動空手,降低回撤。
獲利奔跑(Let Profits Run): 採用基於波動率的移動止損(Volatility Trailing Stop),在大趨勢中能吃到完整的魚身。
免責聲明:
以上策略分享僅供學術研究、回測實驗與邏輯參考,並不代表對未來獲利的保證。 過往的回測績效不代表未來的行情表現。本文內容不構成任何投資建議。加密貨幣交易具有高度風險,使用者應自行評估風險承受能力並自負盈虧,本人不承擔任何因使用此策略而產生的資金損失。
Strategy Overview
This is a trend-following system specifically designed for high-beta assets, such as altcoins like ETH, SOL, and similar cryptocurrencies. The strategy addresses a key weakness of traditional breakout systems in altcoin markets—the high frequency of false breakouts.
Core Logic
Market Regime Filtering
The cryptocurrency market exhibits strong cross-asset correlation. This strategy uses Bitcoin (BTC) as a macro market indicator. Long signals on altcoins are only allowed when BTC is in a confirmed bullish trend, effectively avoiding the systemic risk of altcoin false breakouts during broader market downturns.
Dynamic Volatility Channels
Instead of fixed-price stop losses, the strategy employs Keltner Channels, which adapt dynamically using ATR (Average True Range).
During low-volatility conditions, the channel narrows to sensitively capture early trend initiation.
During high-volatility environments, the channel widens to prevent premature exits caused by market noise.
Risk Management Features
Systematic Risk Avoidance
By applying BTC trend filtering, the strategy automatically stays in cash during bear markets or major market pullbacks, significantly reducing drawdowns.
Let Profits Run
A volatility-based trailing stop is used to maximize profit capture during strong directional trends, allowing positions to benefit from the full trend structure.
Disclaimer
The strategy presented above is for academic research, backtesting experiments, and logical reference only. It does not constitute a guarantee of future performance. Past backtest results are not indicative of future outcomes. This content does not represent any investment advice. Cryptocurrency trading involves substantial risk, and users should assess their own risk tolerance and assume full responsibility for any gains or losses. The author bears no liability for any financial losses incurred from the use of this strategy.

Institutional Execution Engine v3 [Nishith Rajwar]
Institutional Execution Engine v3
Market-Structure-Driven Execution Framework (Indicator + Strategy Hybrid)
The **Institutional Execution Engine v3** is a professional-grade execution framework designed to model **how institutional participants interact with liquidity, volatility regimes, and market structure**.
It is built for **index traders, crypto traders, and systematic intraday participants** who require **non-repainting, forward-validated signals** with strict risk control.
This is **not a mashup of indicators**.
Every module is purpose-built and interacts through a unified execution pipeline.
---
🔍 Core Concepts & Methodology
1️⃣ Market Structure & POI Engine
* Identifies **Points of Interest (POIs)** using swing structure, volatility context, and liquidity positioning
* POIs are **confirmed only after bar close** (strict non-repaint enforcement)
* Adaptive pivot sensitivity based on selected execution preset
2️⃣ Liquidity-Aware Scoring System
Each potential trade is filtered through a **multi-factor execution score**, including:
* Structural alignment
* Volatility normalization (ATR regime)
* Liquidity reaction quality
* Directional efficiency
Trades are only allowed when the **minimum institutional score threshold** is met.
3️⃣ Regime Detection (Forward-Walk Safe)
The engine dynamically classifies market conditions into execution regimes:
* Trending
* Rotational
* Mean-reverting
Regime detection is **forward-walk compatible** and does **not leak future data**.
4️⃣ Risk-First Execution Model
* ATR-normalized stop placement
* R-multiple-based take-profit targeting
* Optional **single-trade-per-session guard**
* Strategy engine includes **open-trade protection** to prevent over-execution
5️⃣ Strategy + Indicator Hybrid
This script can be used in **two ways**:
* **Indicator mode** → discretionary execution with visual POIs, signals, and context
* **Strategy mode** → systematic backtesting with full TradingView Strategy Tester support
Both modes share the **same execution logic** (no divergence).
---
⚙️ Preset-Driven Architecture
Built-in execution presets auto-configure internal parameters without changing core logic:
* **Scalp (Index)**
* **Daytrade (Index)**
* **Crypto Intraday**
* **Institutional Research (FWalk)**
Presets adjust pivot sensitivity, score thresholds, ATR behavior, and risk profile — while preserving execution integrity.
---
## 🚫 Non-Repainting & Data Integrity
* No look-ahead bias
* No future bar references
* No repainting signals
* VWAP and regime logic reset correctly per session
* Safe handling of strategy.opentrades to avoid execution errors
All signals are **bar-close confirmed**.
---
📊 Who This Is For
✔ Index traders (NIFTY / BANKNIFTY / SENSEX)
✔ Crypto intraday traders
✔ Systematic traders validating execution logic
✔ Traders who value **structure + liquidity + risk discipline** over indicators
---
⚠️ Disclaimer
This script is a **research and execution framework**, not financial advice.
Always forward-test and adapt risk parameters to your instrument and timeframe.
---
**Author:** Nishith Rajwar
**Version:** v3
**Execution Philosophy:** Trade where institutions execute — not where indicators react.

ARVEXV1“Failed Reversal – Opposite Candle Only (No Doji/Hammer/Hanging Man)”:
This strategy captures failed reversal attempts where the current candle is opposite to the previous candle and volume is higher. It enters long if a bearish candle fails to break a previous bullish candle’s low, and short if a bullish candle fails to break a previous bearish candle’s high. Signals are canceled for Doji, Hammer, or Hanging Man candles. Entries only, fully backtestable.

Ribbon Cross Strategy This strategy uses a simple moving-average ribbon crossover system with a customizable entry filter. You can choose whether trades trigger near the fast or slow average, allowing flexibility in capturing early or confirmed trend moves.
It’s best suited for index trading on intraday timeframes , helping identify short-term trend reversals and continuations with clear visual cues and backtestable logic.

Hammer/Inv Hammer + ema and other settings + stratok, so thrown everything at this one as the previous only had longs.
so we have all the options, but main feature is the ema to divide up the longs and short, shorts above, longs below, we all know price ends up back to the ema at some point.
I have added a volume filter, this calculates the average volume from the last "20" candles (which can be adjusted) then when a hammer appears it has to be larger than the average volume to be valid.
Also added trading hours in, if you are switching between RTH and ETH it can cause issue if it enters a position EOD then you get an anomaly trade as we can hold positions past certain times.
Also added some trading strategy, so after 2 wins it wont trade again that day or after 1 loss. you decide.
So much to play with now.

Smart Money Liquidity Structure AlgoSmart Money Liquidity Structure Algo is a rule-based trading strategy designed to analyze market structure, liquidity zones, and volatility conditions.
The script combines structure breakout logic, volatility filtering, order-block style price gaps, and Supertrend direction to generate systematic long and short signals.
This strategy is intended for educational and research purposes, helping traders study how liquidity, structure, and trend alignment can be combined into a single framework.
All signals are generated objectively using predefined conditions without repainting after bar close.
The strategy includes built-in risk management logic using ATR-based stop-loss and trailing exit mechanisms.
⚙️ Core Logic Overview
Market structure based on pivot-derived support and resistance
Volatility normalization filter to avoid low-activity periods
Price gap detection inspired by order-block concepts
Supertrend-based directional confirmation
Time-based holding logic before exits are allowed
✨ Features
Rule-based long and short entries
Liquidity & structure breakout detection
Volatility-filtered signal generation
Optional Supertrend trend filter
ATR-based stop-loss and trailing exits
Non-repainting logic after candle close
🧪 How to Use
Apply on liquid markets such as crypto, indices, or forex
Works best on intraday to higher timeframes
Adjust volatility filter and ATR multiplier based on the instrument
Always forward-test and paper-trade before live use
⚠️ Disclaimer
This script is not financial advice.
Trading involves risk, and past performance does not guarantee future results.
Use this strategy for analysis, testing, and educational purposes only.

Hammer Breakout (Adjustable RR)Hammer candle detection and strat for back testing.
diamond indicates a detected hammer candle, the position is entered at the hammer candle close.
Stop loss below the hammer candle wick.
Adjustbale rr based on the distance to the stop (bottom of wick)

Scalping EMA + Pinbar Strategy (London & NY only, BE @ 1R)The scalping trading system uses two types of indicators:
EMA 10, EMA 21, EMA 50
Pinbar Indicator
Rules for entering a buy order:
If the closing price is above the EMA 50, the trend is uptrend and only buy orders should be considered.
The EMA 10 and EMA 21 lines must simultaneously be above the EMA 50.
The price must correct down at least 50% of the area created by the EMA 10 and EMA 21, or correct further down.
A Type 1 Pinbar candle (marked by the Pinbar indicator) must appear; this Pinbar candle must react to at least one of the three EMA lines (EMA 10, EMA 21, EMA 50) and close above the EMA 50.
This Pinbar candle must have a Pinbar strength value (marked by the Pinbar indicator) less than 2 to be considered valid. Check if the closing price of this pinbar candle is higher than the 50-day EMA and if the 10-day and 21-day EMAs are also higher than the 50-day EMA. If so, the conditions have been met and you can begin trading.
Place a buy stop order 0.1 pip higher than the highest price of the pinbar candle, and a stop loss order 0.1 pip lower than the lowest price of the pinbar candle. Set the take profit at 3R.
If the price moves past the previously set stop loss, cancel the pending order.
When the price moves 1R, move the stop loss back to the entry point.
The next trade can only be executed after the previous trade has moved the stop loss back to the entry point.
Rules for placing sell orders:
If the closing price is below the 50-day EMA, the trend is bearish, and only sell orders should be considered. The 10-day and 21-day EMAs must both be below the 50-day EMA.
The price must correct downwards by at least 50% of the area formed by the 10-day and 21-day EMAs, or even further.
A Type 1 pinbar candle (marked by the Pinbar indicator) must appear. This pinbar candle must react to at least one of the three EMAs (EMA 10, EMA 21, EMA 50) and close below the EMA 50.
This pinbar is valid if its strength (indicated by the Pinbar indicator) is less than 2. Verify that the closing price of this pinbar candle is below the EMA 50 and that both the EMA 10 and EMA 21 are below the EMA 50. If all conditions are met, the trade can be executed.
(This appears to be a separate entry rule and not part of the previous text.) Place a sell stop order 0.1 pip below the lowest point of the pinbar candle, and a stop loss order 0.1 pip above the highest point of the pinbar candle. Set the take profit point at 3R.
If the price moves past the previously set stop-loss point, cancel the pending order.
When the price moves 1R, move the stop-loss point back to the entry point.
The next trade can only be executed after the previous trade has moved the stop-loss point back to the entry point.

SMC Pro [Stansbooth]
🔮 SMC × Fibonacci Confluence Engine — The Hidden Algorithm of the Markets
Welcome to a level of chart analysis where mathematics , market psychology , and institutional logic merge into one ultra-intelligent system.
This indicator decodes the true structure of price delivery by combining Smart Money Concepts with the timeless precision of Fibonacci ratios , revealing what retail traders can’t see — *the algorithmic heartbeat of the market*.
✨ What Makes This Indicator Different
Instead of drawing random lines or reacting to late signals, this tool **anticipates** market behavior by reading the footprints left behind by institutional algorithms. Every element is placed with purpose — every zone, every shift, every fib level — all forming a seamless narrative that explains *why* price moves the way it does.
🔥 Core Intelligence Features
Advanced BOS/CHOCH Auto-Detection — Spot structure shifts before momentum even forms.
Institutional Liquidity Mapping
— Identify liquidity pools, engineered sweeps, equal highs/lows, and trap zones designed by smart money.
Fibonacci-Aligned Precision Zones
— Auto-generated fib grids synced with SMC levels for pinpoint reversal and continuation setups.
Imbalance Engine
— FVGs, displacement, inefficiencies, and mitigation blocks displayed with crystal clarity.
Premium/Discount Algorithm
— Understand instantly whether price is in a zone of accumulation or distribution.
🚀 Designed for Traders Who Want an Edge
Whether you're scalping fast moves, capturing intraday swings, or holding higher-timeframe plays, this indicator provides a professional lens into the market. It turns complex price action into a structured, predictable system where every move has logic and every entry has confluence.
You don’t just see the chart —
you see the intention behind every push, pull, manipulation, and reversal.
💎 Why It Feels Like a Cheat Code
Because it mirrors the way institutions analyze the market:
— Identify liquidity
— Seek equilibrium
— Deliver price
— Create inefficiency
— Mitigate
— Continue the narrative
Using SMC and Fibonacci together unlocks the “algorithmic geometry” behind price movement, giving you clarity where others see chaos.
⚡ Trade With Confidence, Confluence & Control
This indicator isn’t just a tool.
It’s a complete trading framework — structured, intelligent, and deadly accurate.
Master the markets.
Decode the algorithm.
Trade like smart money .
