Tweezer Scanner v1Some code for detecting tweezer candles, which are reversal patterns. You'll need to tweak the settings to be either less strict (more detections) or more strict (less detections). I found that if you follow the documentation for tweezers exactly, you will get very few detections. It is possible that this candlestick has become overused, so the original pattern itself has been lost to the noise of the market.
Settings:
1. Tweezer Max Body Height (Pips) - How tall can the body of the tweezer be, in pips (increase this pips to increase detections)
2. Tweezer Body Similarity (>%) - How similar should the body heights be, higher percentage is more similar (reduce this % to increase detections)
3. Tweezer Tail Similarity (>%) - How similar should the tail heights be, higher percentage is more similar (reduce this % to increase detections)
4. Tweezer Tail Proportion (<%) - How short should the opposite tail heights be, lower percentage is shorter and more similar to the documentation (increase this % to increase detections)
Cerca negli script per "Candlestick"

[RESEARCH] Heikin-Ashi Chart IdentifierA deterministic approach to identify Heikin-Ashi chart type.
The script checks the next statements about HA:
HA chart does not have any gaps in a classic sense
Every new HA open price is calculated using a specific recurrence formula. This fact also means that initial HA open price is used to calculate all the next and so on (a construction of Infinite Impulse Response filters)
The script works correctly being applied to other chart types:
Classic Candlestick
Range Bars
Line Break
Traditional Renko
ATR Renko
Traditional Point-and-Figure
ATR Point-and-Figure
Kagi
For special ones: this code allows you to check whether your script is being executed with Heikin-Ashi candles or not inside your script.
Ev sistr 'ta Laou!

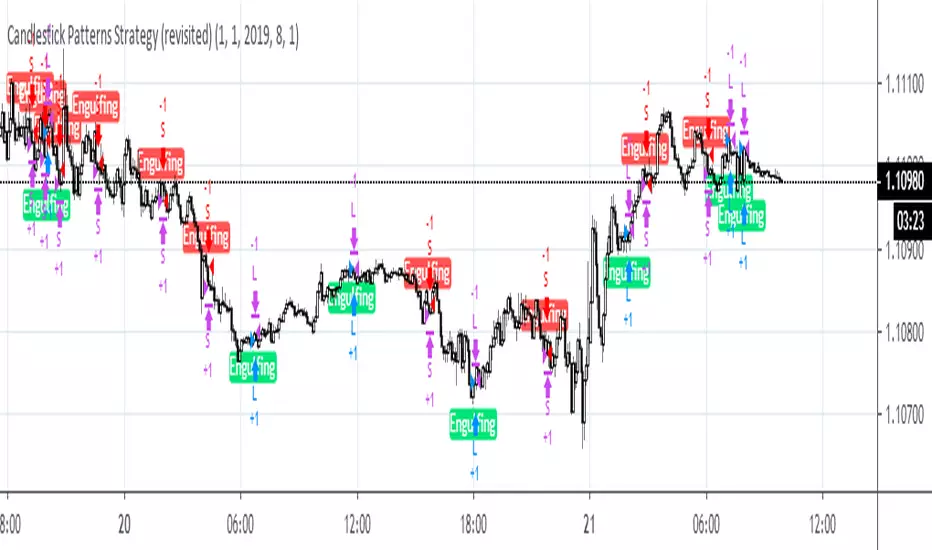
Candlestick Patterns Strategy (revisited)This strategy is used as a benchmark to see how it compares with other strategies posted by me recently. In all, the below collection of candlestick patterns appears to be one of the best among the ones that can be found here, imho.
Candle Patterns StrategyThe script allows you to test popular candlestick patterns on various instruments and timeframes. In addition, you can configure risk management (if the value is zero, it means the function is disabled), and you can also specify the time of the trading session (for example, so that the positions are not transferred to the next day).
The author is grateful to JayRogers and Phi35, their code examples helped a lot in writing the strategy.

Engulfing Pattern Hello Traders,
Sharing one of my favorite candlestick pattern with everyone. Feel free to use it.
Regards,
Intraday Guruji

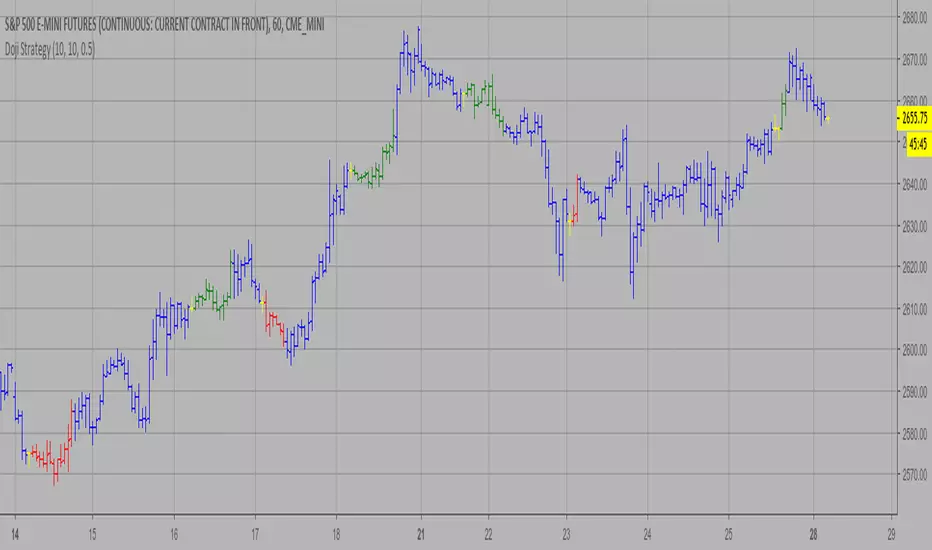
Doji Strategy This is a candlestick where the open and close are the same.
WARNING:
- This script to change bars colors.
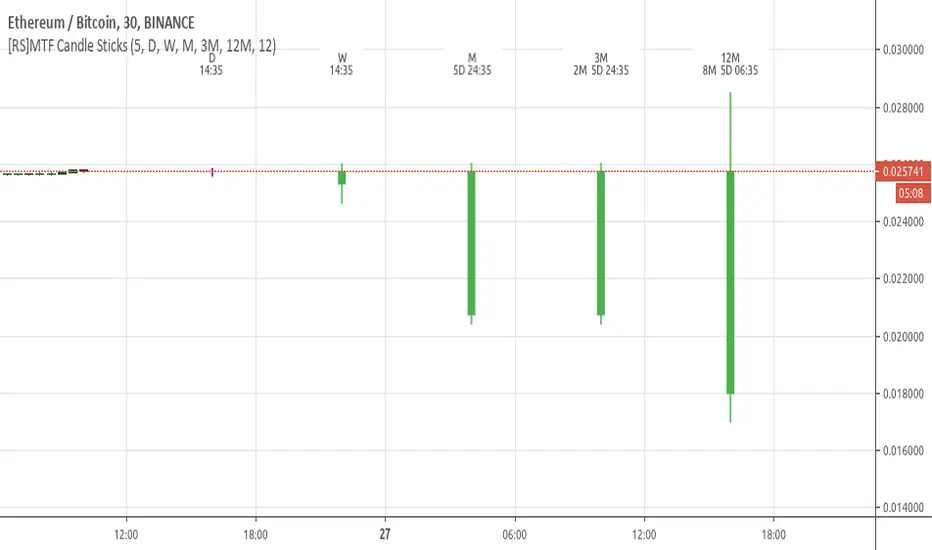
HDW open_close上位時間軸のロウソク足を表示したくて、それに代わるものが見つからなかったので作ってみました。
1時間足、日足、週足の 始値 と 終値 をラインで表示するものです。
ヒゲの部分は作っていません。実体を見て判断します。
【Google translate】
I wanted to display the candlestick on the upper time axis, so I could not find an alternative to it, so I made it.
It displays the start value and closing price of 1 hour foot, daily stick, weekly leg with a line.
The Lie Detector [LucF]Sometimes the simplest things turn out to be surprisingly useful.
Wyckoff's second law of cause and effect implies that price movement (up or down) should be proportional to the effort (volume) supplied. Price is not subject to gravity; without volume it cannot move.
This one-line indicator acts a bit like a lie detector for price action.
It simply identifies bars with decreasing volume, the idea being that movement on a bar where volume has decreased is considered suspicious.
Falling volume accompanied by much price movement is more suspicious than it is on bars with less movement.
Pure luck would have it that the varying size of the candlestick bodies provides an easy way to visually grasp the degree of suspiciousness their movement should be considered with because it is directly proportional to the body's size. Large, empty bodies are more suspicious than small ones.
Taking things from the opposite perspective, this indicator reveals the more meaningful candles on your chart, the ones telling the truth, since their color is not changed if they are accompanied by rising volume.

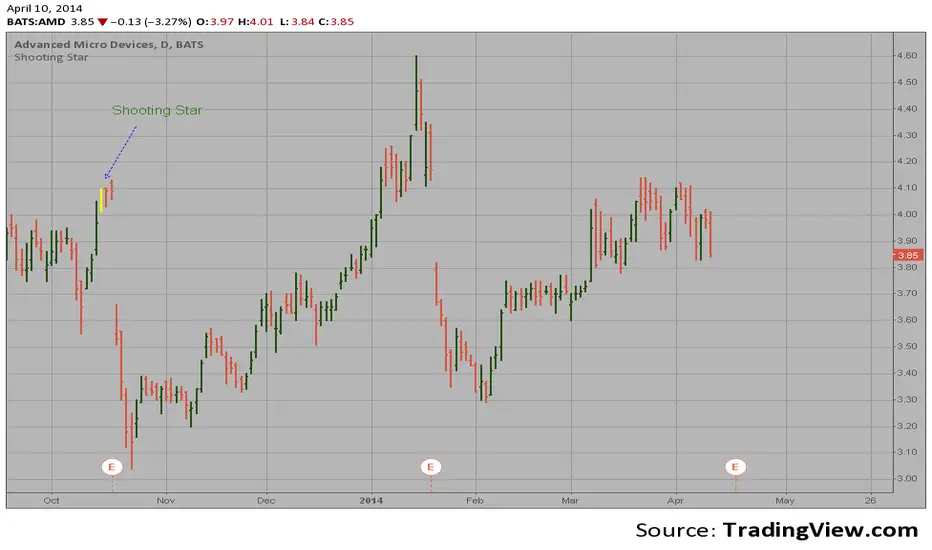
Shooting Star automatic finding scriptHi
Let me introduce my Shooting Star automatic finding script.
This is a bearish reversal candlestick which occurs in an uptrend. It has a long
upper shadow with little, or no lower shadow, and a small real body near the lows
of the session.
Dekidaka-Ashi - Candles And Volume Teaming Up (Again)The introduction of candlestick methods for market price data visualization might be one of the most important events in the history of technical analysis, as it totally changed the way to see a trading chart. Candlestick charts are extremely efficient, as they allow the trader to visualize the opening, high, low and closing price (OHLC) each at the same time, something impossible with a traditional line chart. Candlesticks are also cleaner than bars charts and make a more efficient use of space. Japanese peoples are always better than everyone at an incredible amount of stuff, look at what they made, the candlesticks/renko/kagi/heikin-ashi charts, the Ichimoku, manga, ecchi...
However classical candlesticks only include historical market price data, and won't include other type of data such as volume, which is considered by many investors a key information toward effective financial forecasting as volume is an indicator of trading activity. In order to tackle to this problem solutions where proposed, the most common one being to adapt the width of the candle based on the amount of volume, this method is the most commonly accepted one when it comes to visualizing both volume and OHLC data using candlesticks.
Now why proposing an additional tool for volume data visualization ? Because the classical width approach don't provide usable data regarding volume (as the width is directly related to the volume data). Therefore a new trading tool based on candlesticks that allow the trader to gain access to information about the volume is proposed. The approach is based on rescaling the volume directly to the price without the direct use of user settings. We will also see that this tool allow to create support and resistances as well as providing signals based on a breakout methodology.
Dekidaka-Ashi - Kakatte Koi Yo!
"Dekidaka" (出来高) mean "Volume" in a financial context, while "Ashi" (足) mean "leg" or "bar". In general methods based on candlesticks will have "Ashi" in their name.
Now that the name of the indicator has been explained lets see how it works, the indicator should be overlayed directly to a candlestick chart. The proposed method don't alter the shape of the candlesticks and allow to visualize any information given by the candles. As you can see on the figure below the candle body of the proposed tool only return the border of the candle, this allow to show the high/low wick of the candle.
The body size of the candle is based on two things : the absolute close/open difference, and the volume, if the absolute close/open difference is high and the volume is high then the body of the candle will be clearly visible, if the volume is high but the absolute close/open difference is low, then the body will be less visible. This approach is used because of the rescaling method used, the volume is divided by the sum between the current volume value and the precedent volume value, this rescale the volume in a (0,1) range, this result is multiplied by the absolute close/open difference and added/subtracted to the high/low price. The original approach was based on normalization using the rolling maximum, but this approach would have led to repainting.
You have access to certain settings that can help you obtain a better visualization, the first one being the body size setting, with higher values increasing the body amplitude.
In green body with size 2, in red with size 1. The smooth parameter will smooth the volume data before being used, this allow to create more visible bodies.
Here smooth = 100.
Making Bands From The Dekidaka-Ashi
This tool is made so it output two rescaled volume values, with the highest value being denoted as "Dekidaka-high" and the lowest one as "Dekidaka-low". In order to get bands we must use two moving averages, one using the Dekidaka-high as input and the other one using Dekidaka-low, the body size parameter should be fairly high, therefore i will hide the tool as it could cause trouble visualizing the bands.
Bands with both MA's of period 20 and the body size equal to 20. Larger periods of the MA's will require a larger amount of body size.
Breakout Signals
There is a wide variety of signals that can be made from candles, ones i personally like comes from the HA candles. The proposed tool is no exception and can produce a wide variety of signals. The signals generated are basic ones based on a breakout methodology, here is each signal with their associated label :
Strong Bullish signal "⇈" : The high price cross the Dekidaka-high and the closing price is greater than the opening price
Strong Bearish signal "⇊" : The low price cross the Dekidaka-low and the closing price is lower than the opening price
Weak Bullish signal "↑" : The high price cross the Dekidaka-high and the closing price is lower than the opening price
Weak Bearish signal "↓" : The low price cross the Dekidaka-low and the closing price is greater than the opening price
Uncertain "↕" : The high price cross the Dekidaka-high and the low price cross the the Dekidaka-low
In order to see the signals on the chart check the "Show signals" option. Note that such signals are not based on an advanced study, and even if they are based on a breakout methodology we can see that volatile movement rarely produce signals, therefore signals mostly occur during low volume/volatility periods, which isn't necessarily a great thing.
Conclusion
A trading tool based on candlesticks that aim to include volume information has been presented and a brief methodology has been introduced. A study of the signals generated is required, however i'am not confident at all on their accuracy, i could work on that in the future. We have also seen how to make bands from the tool.
Candlesticks remain a beautiful charting technique that can provide an enormous amount of information to the trader, and even if the accuracy of patterns based on candlesticks is subject to debates, we can all agree that candlesticks will remain the most widely used type of financial chart.
On a side note i mostly use a dark color for a bullish candle, and a light gray for a bearish candle, with the border color being of the same color as the bullish candle. This is in my opinion the best setup for a candlestick chart, as candles using the traditional green/red can kill the eyes and because this setup allow to apply a wide variety of colors to the plot of overlayed indicators without the fear of causing conflict with the candles color.
Thanks for reading ! :3 Nya
A Word
This morning i received some hateful messages on twitter, the users behind them certainly coming from tradingview, so lets be clear, i know i'am not the most liked person in this community, i know that perfectly, but no one merit to be receive hateful messages. I'am not responsible for the losses of peoples using my indicators, nor is tradingview, using technical indicators does not guarantee long term returns, your ability to be profitable will mostly be based on the quality and quantity of knowledge you have.

ADX Momentum Shaded CandlesDescription:
The "ADX Momentum Shaded Candles" indicator (ADXMSC) is an overlay indicator that enhances candlestick charts by adding shading based on the momentum derived from the Average Directional Index (ADX). This indicator provides visual cues about the strength of bullish and bearish momentum by adjusting the transparency of the candlesticks.
How it Works:
The indicator utilizes the ADX indicator to calculate the values of +DI (Directional Indicator Plus) and -DI (Directional Indicator Minus) based on user-defined parameters. It then determines the transparency levels for the bullish and bearish candlesticks based on the calculated values of +DI and -DI. Higher values of +DI or -DI result in lower transparency levels, while lower values increase transparency.
Transparency Calculation:
The transparency of the bullish and bearish candlesticks is adjusted based on the values of +DI and -DI, which reflect the momentum of the price movement. Transparency is inversely proportional to these values, with higher values resulting in lower transparency. To calculate transparency, the indicator uses the formula 100 minus the value of +DI or -DI multiplied by 2. This ensures that higher values of +DI or -DI produce more opaque candlesticks.
Usage:
To effectively use the "ADX Momentum Shaded Candles" indicator (ADXMSC), follow these steps:
1. Apply the indicator to your chart by adding it from the available indicators.
2. Observe the candlesticks on the chart:
- Bullish candlesticks are represented by the original bullish color with adjusted transparency.
- Bearish candlesticks are represented by the original bearish color with adjusted transparency.
3. Analyze the transparency levels of the candlesticks to assess the strength of bullish and bearish momentum. Less transparent candlesticks indicate stronger momentum, while more transparent ones suggest weaker momentum.
4. Combine the visual information from the shaded candlesticks with other technical analysis tools, such as support and resistance levels, trend lines, or oscillators, to confirm potential trade opportunities.
5. Customize the indicator's parameters, such as the ADX length and smoothing, to suit your trading preferences.
6. Implement appropriate risk management strategies, including setting stop-loss orders and position sizing, to manage your trades effectively and protect your capital.

Price Action Color Forecast (Expo)█ Overview
The Price Action Color Forecast Indicator , is an innovative trading tool that uses the power of historical price action and candlestick patterns to predict potential future market movements. By analyzing the colors of the candlesticks and identifying specific price action events, this indicator provides traders with valuable insights into future market behavior based on past performance.
█ Calculations
The Price Action Color Forecast Indicator systematically analyzes historical price action events based on the colors of the candlesticks. Upon identifying a current price action coloring event, the indicator searches through its past data to find similar patterns that have happened before. By examining these past events and their outcomes, the indicator projects potential future price movements, offering traders valuable insights into how the market might react to the current price action event.
The indicator prioritizes the analysis of the most recent candlesticks before methodically progressing toward earlier data. This approach ensures that the generated candle forecast is based on the latest market dynamics.
The core functionality of the Price Action Color Forecast Indicator:
Analyzing historical price action events based on the colors of the candlesticks.
Identifying similar events from the past that correspond to the current price action coloring event.
Projecting potential future price action based on the outcomes of past similar events.
█ Example
In this example, we can see that the current price action pattern matches with a similar historical price action pattern that shares the same characteristics regarding candle coloring. The historical outcome is then projected into the future. This helps traders to understand how the past pattern evolved over time.
█ How to use
The indicator provides traders with valuable insights into how the market might react to the current price action event by examining similar historical patterns and projecting potential future price movements.
█ Settings
Candle series
The candle lookback length refers to the number of bars, starting from the current one, that will be examined in order to find a similar event in the past.
Forecast Candles
Number of candles to project into the future.
-----------------
Disclaimer
The information contained in my Scripts/Indicators/Ideas/Algos/Systems does not constitute financial advice or a solicitation to buy or sell any securities of any type. I will not accept liability for any loss or damage, including without limitation any loss of profit, which may arise directly or indirectly from the use of or reliance on such information.
All investments involve risk, and the past performance of a security, industry, sector, market, financial product, trading strategy, backtest, or individual's trading does not guarantee future results or returns. Investors are fully responsible for any investment decisions they make. Such decisions should be based solely on an evaluation of their financial circumstances, investment objectives, risk tolerance, and liquidity needs.
My Scripts/Indicators/Ideas/Algos/Systems are only for educational purposes!

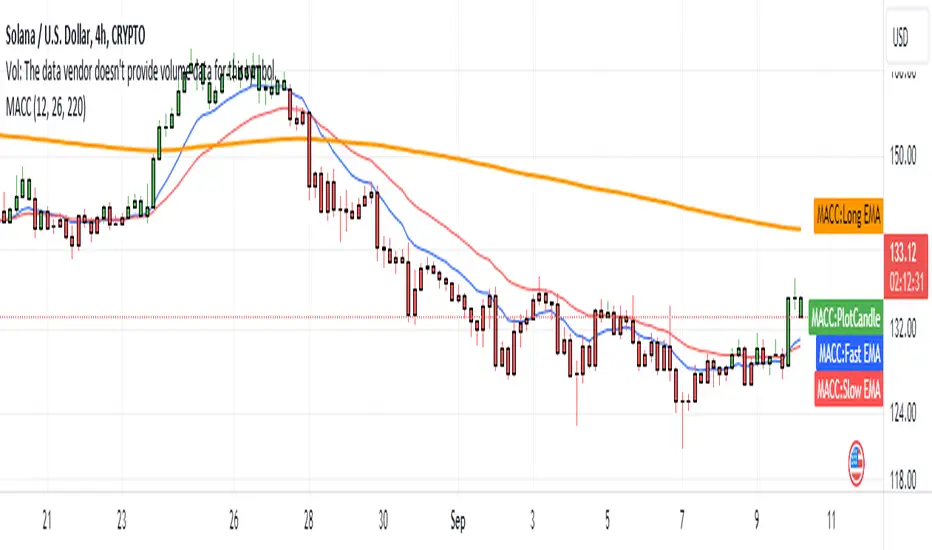
[MACC] Moving Average Candle ColorThe simplest trading framework is using moving average. This indicator is harnessing that very method.
What It Does:
This indicator helps you see market trends at a glance by changing the color of the candlesticks based on the relationship between two Exponential Moving Averages (EMAs). When the 9-period EMA is above the 21-period EMA, candlesticks turn green, suggesting a bullish trend. When the 9 EMA is below the 21 EMA, candlesticks turn red, indicating a bearish trend.
Why You'll Love It:
Easy Trend Visualization: Quickly spot trends and potential reversals with color-coded candlesticks.
Customizable Settings: Adjust the lengths of the EMAs to fit your trading style. Just change the values in the settings panel and watch the indicator update in real-time.
Optional EMA Lines: See the EMA lines plotted on your chart for added context and trend confirmation.
How to Use It:
Green Candlesticks: It’s a sign that the trend is likely upward.
Red Candlesticks: signaling a potential downward trend.
Customization:
EMA Lengths: You can set the lengths for the 9 EMA and 21 EMA to whatever fits your trading strategy best.
Colors: Adjust the colors if you want to match your chart’s theme.
Get Started: Add this indicator to your TradingView chart and tweak the settings to see how it helps you track market trends more effectively.
Cherio...
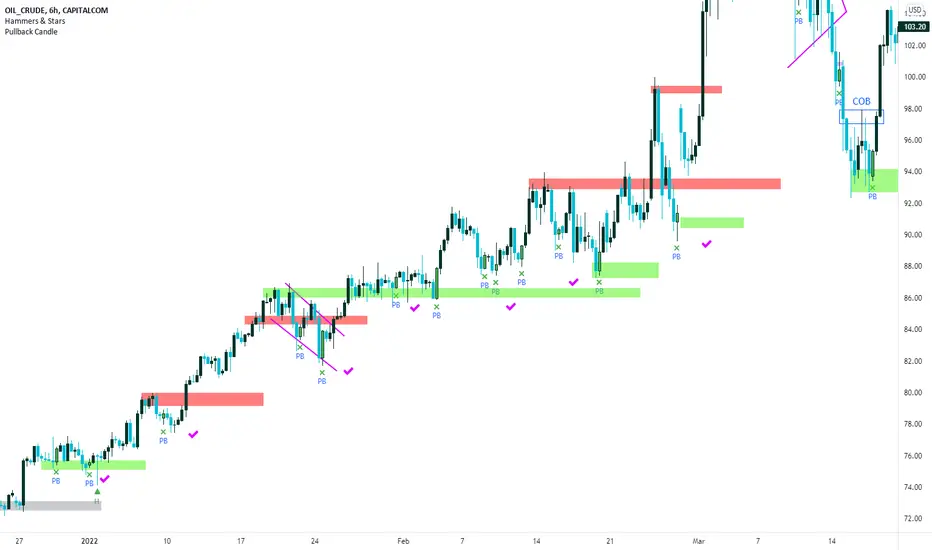
Pullback Candles (Candlestick Analysis) Guaranteed Winners!!!!Pullback Candle will signal when price is at the end of a pullback and entering a balance phase in the market (works on all markets)
Also we can expect a Pullback Candle during flash crashes as the theory of this script is when there is a turning point in momentum - this candle will appear and we can look long from this signal.
This candle will only work in Swing Low areas and appear when below an moving average which can be changed in the settings.
This candle will work on all timeframes - HTF provided very good rexpectancy whereas the LTF has a slightly less expectancy.
This candle can be alerted to signal the Pullback Candle when the bar is confirmed and not during.
The way i trade this candle is
1) Candle signal must be in probably area to increase efficiency.
2) Enter on the second candle after candle IS CONFIRMED
3) Set stop loss below Pullback Candle or use ATR value
4) Trade with the trend ie only bullish price action
5) This candle can catch falling knifes - we had one on LUNA before the rally to $7.50
6) Trading with a confluence along with the Pullback is better than solely trading this candle
Please leave a comment.
If we get to 100 likes i will publish the script.
Have a good weekend :)
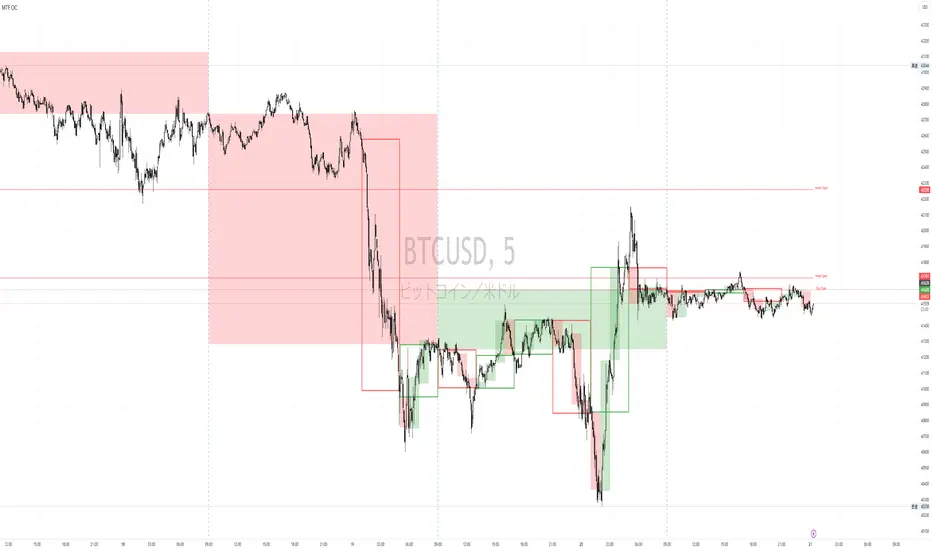
Volume Delta Candles HTF [TradingFinder] LTF Volume Candles 🔵 Introduction
In financial markets, understanding the concepts of supply and demand and their impact on price movements is of paramount importance. Supply and demand, as fundamental pillars of economics, reflect the interaction between buyers and sellers.
When buyers' strength surpasses that of sellers, demand increases, and prices tend to rise. Conversely, when sellers dominate buyers, supply overtakes demand, causing prices to drop. These interactions play a crucial role in determining market trends, price reversal points, and trading decisions.
Volume Delta Candles offer traders a practical way to visualize trading activity within each candlestick. By integrating data from lower timeframes or live market feeds, these candles eliminate the need for standalone volume indicators.
They present the proportions of buying and selling volume as intuitive colored bars, making it easier to interpret market dynamics at a glance. Additionally, they encapsulate critical metrics like peak delta, lowest delta, and net delta, allowing traders to grasp the market's internal order flow with greater precision.
In financial markets, grasping the interplay between supply and demand and its influence on price movements is crucial for successful trading. These fundamental economic forces reflect the ongoing balance between buyers and sellers in the market.
When buyers exert greater strength than sellers, demand dominates, driving prices upward. Conversely, when sellers take control, supply surpasses demand, and prices decline. Understanding these dynamics is essential for identifying market trends, pinpointing reversal points, and making informed trading decisions.
Volume Delta Candles provide an innovative method for evaluating trading activity within individual candlesticks, offering a simplified view without relying on separate volume indicators. By leveraging lower timeframe or real-time data, this tool visualizes the distribution of buying and selling volumes within a candle through color-coded bars.
This visual representation enables traders to quickly assess market sentiment and understand the forces driving price action. Buyer and seller strength is a critical concept that focuses on the ratio of buying to selling volumes. This ratio not only provides insights into the market's current state but also serves as a leading indicator for detecting potential shifts in trends.
Traders often rely on volume analysis to identify significant supply and demand zones, guiding their entry and exit strategies. Delta Candles translate these complex metrics, such as Maximum Delta, Minimum Delta, and Final Delta, into an easy-to-read visual format using Japanese candlestick structures, making them an invaluable resource for analyzing order flows and market momentum.
By merging the principles of supply and demand with comprehensive volume analysis, tools like the indicator introduced here offer unparalleled clarity into market behavior. This indicator calculates the relative strength of supply and demand for each candlestick by analyzing the ratio of buyers to sellers.
🔵 How to Use
The presented indicator is a powerful tool for analyzing supply and demand strength in financial markets. It helps traders identify the strengths and weaknesses of buyers and sellers and utilize this information for better decision-making.
🟣 Analyzing the Highest Volume Trades on Candles
A unique feature of this indicator is the visualization of price levels with the highest trade volume for each candlestick. These levels are marked as black lines on the candles, indicating prices where most trades occurred. This information is invaluable for identifying key supply and demand zones, which often act as support or resistance levels.
🟣 Trend Confirmation
The indicator enables traders to confirm bullish or bearish trends by observing changes in buyer and seller strength. When buyer strength increases and demand surpasses supply, the likelihood of a bullish trend continuation grows. Conversely, decreasing buyer strength and increasing seller strength may signal a potential bearish trend reversal.
🟣 Adjusting Timeframes and Calculation Methods
Users can customize the indicator's candlestick timeframe to align with their trading strategy. Additionally, they can switch between moving average and current candle modes to achieve more precise market analysis.
This indicator, with its accurate and visual data display, is a practical and reliable tool for market analysts and traders. Using it can help traders make better decisions and identify optimal entry and exit points.
🔵 Settings
Lower Time Frame Volume : This setting determines which timeframe the indicator should use to identify the price levels with the highest trade volume. These levels, displayed as black lines on the candlesticks, indicate prices where the most trades occurred.
It is recommended that users align this timeframe with their primary chart’s timeframe.
As a general rule :
If the main chart’s timeframe is low (e.g., 1-minute or 5-minute), it is better to keep this setting at a similarly low timeframe.
As the main chart’s timeframe increases (e.g., daily or weekly), it is advisable to set this parameter to a higher timeframe for more aligned data analysis.
Cumulative Mode :
Current Candle : Strength is calculated only for the current candlestick.
EMA (Exponential Moving Average) : The strength is calculated using an exponential moving average, suitable for identifying longer-term trends.
Calculation Period : The default period for the exponential moving average (EMA) is set to 21. Users can modify this value for more precise analysis based on their specific requirements.
Ultra Data : This option enables users to view more detailed data from various market sources, such as Forex, Crypto, or Stocks. When activated, the indicator aggregates and displays volume data from multiple sources.
🟣 Table Settings
Show Info Table : This option determines whether the information table is displayed on the chart. When enabled, the table appears in a corner of the chart and provides details about the strength of buyers and sellers.
Table Size : Users can adjust the size of the text within the table to improve readability.
Table Position : This setting defines the table’s placement on the chart.
🔵 Conclusion
The indicator introduced in this article is designed as an advanced tool for analyzing supply and demand dynamics in financial markets. By leveraging buyer and seller strength ratios and visually highlighting price levels with the highest trade volume, it aids traders in identifying key market zones.
Key features, such as adjustable analysis timeframes, customizable calculation methods, and precise volume data display, allow users to tailor their analyses to market conditions.
This indicator is invaluable for analyzing support and resistance levels derived from trade volumes, enabling traders to make more accurate decisions about entering or exiting trades.
By utilizing real market data and displaying the highest trade volume lines directly on the chart, it provides a precise perspective on market behavior. These features make it suitable for both novice and professional traders aiming to enhance their analysis and trading strategies.
With this indicator, traders can gain a better understanding of supply and demand dynamics and operate more intelligently in financial markets. By combining volume data with visual analysis, this tool provides a solid foundation for effective decision-making and improved trading performance. Choosing this indicator is a significant step toward refining analysis and achieving success in complex financial markets.

RSI Candlestick Oscillator [LuxAlgo]The RSI Candlestick Oscillator displays a traditional Relative Strength Index (RSI) as candlesticks. This indicator references OHLC data to locate each candlestick point relative to the current RSI Value, leading to a more accurate representation of the Open, High, Low, and Close price of each candlestick in the context of RSI.
In addition to the candlestick display, Divergences are detected from the RSI candlestick highs and lows and can be displayed over price on the chart.
🔶 USAGE
Translating candlesticks into the RSI oscillator is not a new concept and has been attempted many times before. This indicator stands out because of the specific method used to determine the candlestick OHLC values. When compared to other RSI Candlestick indicators, you will find that this indicator clearly and definitively correlates better to the on-chart price action.
Traditionally, the RSI indicator is simply one running value based on (typically) the close price of the chart. By introducing high, low, and open values into the oscillator, we can better gauge the specific price action throughout the intrabar movements.
Interactions with the RSI levels can now take multiple forms, whether it be a full-bodied breakthrough or simply a wick test. Both can provide a new analysis of price action alongside RSI.
An example of wick interactions and full-bodied interactions can be seen below.
As a result of the candlestick display, divergences become simpler to spot. Since the candlesticks on the RSI closely resemble the candlesticks on the chart, when looking for divergence between the chart and RSI, it is more obvious when the RSI and price are diverging.
The divergences in this indicator not only show on the RSI oscillator, but also overlay on the price chart for clearer understanding.
🔹 Filtering Divergence
With the candlesticks generating high and low RSI values, we can better sense divergences from price, since these points are generally going to be more dramatic than the (close) RSI value.
This indicator displays each type of divergence:
Bullish Divergence
Bearish Divergence
Hidden Bullish Divergence
Hidden Bearish Divergence
From these, we get many less-than-useful indications, since every single divergence from price is not necessarily of great importance.
The Divergence Filter disregards any divergence detected that does not extend outside the RSI upper or lower values.
This does not replace good judgment, but this filter can be helpful in focusing attention towards the extremes of RSI for potential reversal spotting from divergence.
🔶 DETAILS
In order to get the desired results for a display that resembles price action while following RSI, we must scale. The scaling is the most important part of this indicator.
To summarize the process:
Identify a range on Price and RSI
Consider them as equal to create a scaling factor
Use the scaling factor to locate RSI's "Price equivalent" Upper, Lower, & Mid on the Chart
Use those prices (specifically the RSI Mid) to check how far each OHLC value lies from it
Use those differences to translate the price back to the RSI Oscillator, pinning the OHLC values at their relative location to our anchor (RSI Mid)
🔹 RSI Channel
To better understand, and for your convenience, the indicator includes the option to display the RSI Channel on the chart. This channel helps to visualize where the scaled RSI values are relative to price.
If you analyze the RSI channel, you are likely to notice that the price movement throughout the channel matches the same movement witnessed in the RSI Oscillator below. This makes sense since they are the exact same thing displayed on different scales.
🔹 Scaling the Open
While the scaling method used is important, and provides a very close view of the real price bar's relative locations on the RSI oscillator… It is designed for a single purpose.
The scaling does NOT make the price candles display perfectly on the RSI oscillator.
The largest place where this is noticeable is with the opening of each candle.
For this reason, we have included a setting that modifies the opening of each RSI candle to be more accurate to the chart's price candles.
This setting positions the current bar's opening RSI candlestick value accurately relative to the price's open location to the previous closing price. As seen below.
🔶 SETTINGS
🔹 RSI Candles
RSI Length: Sets the Length for the RSI Oscillator.
Overbought/Oversold Levels: Sets the Overbought and Oversold levels for the RSI Oscillator.
Scale Open for Chart Accuracy: As described above, scales the open of each candlestick bar to more accurately portray the chart candlesticks.
🔹 Divergence
Show on Chart: Choose to display divergence line on the chart as well as on the Oscillator.
Divergence Length: Sets the pivot width for divergence detection. Normal Fractal Pivot Detection is used.
Divergence Style: Change color and line style for Regular and Hidden divergences, as well as toggle their display.
Divergence Filter: As described above, toggle on or off divergence filtering.
🔹 RSI Channel
Toggle: Display RSI Channel on Chart.
Color: Change RSI Channel Color

No Wick Setup Indicator
**No Wick Setup Indicator**
This is a custom trading indicator designed to identify and signal potential buy and sell opportunities based on candlestick patterns with no wicks. Specifically, it looks for candles with no wicks at the bottom (bullish setup) or no wicks at the top (bearish setup). Here's how it works:
**Key Features:**
- **Bullish Setup**: A green candlestick with no bottom wick (i.e., the open price is equal to the low price of the candle) is considered a potential bullish signal. A trendline is drawn at the bottom of this candle. When the market price returns to this trendline, a buy signal is generated.
- **Bearish Setup**: A red candlestick with no top wick (i.e., the open price is equal to the high price of the candle) is considered a potential bearish signal. A trendline is drawn at the top of this candle. When the market price returns to this trendline, a sell signal is generated.
- **Timeframe**: This indicator works exclusively on the **30-minute timeframe**.
**How It Works:**
1. When a candlestick pattern with no bottom wick (bullish setup) is identified, a trendline is drawn at the low of the candlestick.
2. When a candlestick pattern with no top wick (bearish setup) is identified, a trendline is drawn at the high of the candlestick.
3. The indicator then tracks the market price and waits for it to return to the respective trendline level.
4. **Buy Signal**: When the market price touches or goes below the bullish trendline, a **Buy** signal is displayed on the chart with an upward arrow.
5. **Sell Signal**: When the market price touches or goes above the bearish trendline, a **Sell** signal is displayed on the chart with a downward arrow.
**Visual Elements:**
- **Trendlines**: Horizontal lines drawn at the bottom (bullish) or top (bearish) of the candlesticks with no wick.
- **Buy/Sell Labels**: Labels indicating "Buy" or "Sell" appear when the market price returns to the trendline.
**Why Use This Indicator?**
- This indicator helps identify specific price levels where the market might reverse or consolidate based on candlestick structure, offering potential entry points for trades.
- It allows traders to focus on price action and market behavior without relying on more complex indicators.

Candle Patterns Ver.2When someone decided to start trading the first thing we learn is how to read and understand the candlesticks. This little "boxes" with sticks tell us how the market sentiment and they can be used to "predict" future moves. I put predict inside a quotation marks because I would say predict the market is almost an utopia and we all know the reason.
Anyway with a good understand in reading the candlesticks with other indicators(like momentum or even a MA) can give us some edge when analyzing an instrument.
Since we have a lot of candlesticks types I did some back test and figured out that for my strategy that three candlestick types works very well. I will briefly describe then.
Engulfing Bar
This type of candlestick shows us a potential reversal based on the previous bar.
A bullish Engulfing has the close higher than the open it works better if the previous one is a bearish bar(open higher than close) and it is at a Support level. The body of the Engulfing bar should "engulf" the full body of the previous bar. If all parameters(previous bearish bar at Support level after a downtrend move) this Engulfing will represents a reversal move. When I say reversal it could means a pullback reversal(if the past trend is downtrend) or if the previous downtrend is a pullback from a past uptrend. In any way the previous bearish followed by an bullish Engulfing in general leads for an upward move.
The same picture applies to a previous bullish bar followed by an bearish Engulfing bar that if appears at the Resistance level will lead to a downward move.
One thing that is worth to mention is in a downward(or upward) move we have a small bullish bar followed by a bullish Engulfing this situation may lead to a continuation, not reversal.
Pinbar Bar:
This is another candlestick type that represents possible reversal. The Pinbar candle show a small(or medium) size but the important part is the size of the stick. If the stick is the upper one and has the size of 2 times the size of the body, it is a bearish bars and it appears after an uptrend move it represents that the buyers are losing momentum so we can expect a reversal move. When this type of bar appears after a downward move, it is a bullish bars but the stick is the lower one and has the size of two times of the body it will represents a bullish reversal. In this picture this candle is called a "Hammer".
So based on that I develop an indicator that shows me these 2 bars types and makes easy to identify with the other indicator possible entries.
Please feel free for a constructive comments and hope it help any one whe trading. Candlestick are the fundamentals of Price action.
You all have a great trading new week.

Wickiness IndexWickiness Index - Detect Indecision and Trend Exhaustion
The Wickiness Index is a versatile technical indicator designed to measure the proportion of wicks (upper and lower shadows) relative to the total range of price bars over a specified lookback period. It provides insights into market indecision, reversals, and trend exhaustion by analyzing the structural composition of candlesticks. The indicator calculates the lengths of upper and lower wicks along with the body of each candlestick. Each bar's wick length is expressed as a percentage of the total range (High - Low). The ratio is scaled to 0–100, where 100 represents entirely wicks with no body (indicating pure indecision) and 0 represents no wicks with only body (indicating strong directional movement). These values are then averaged over the lookback period (default = 5 bars) to provide a smoothed representation of wickiness, reducing noise and highlighting trends.
A high value, especially above 70, suggests indecision or potential reversals, as candlesticks dominated by wicks often appear near tops or bottoms. Conversely, low values below 30 indicate trend strength and strong momentum, useful for spotting breakouts and trend continuation. Mid-range values between 30 and 70 often indicate consolidation phases or gradual transitions between trends. Traders can adjust the lookback period to match their trading style, with shorter periods offering faster responses and longer periods providing smoother trends.
This indicator is particularly useful for trend reversal detection, breakout confirmation, and volatility filtering. It scales effectively across all timeframes, making it suitable for both intraday traders and long-term investors. When combined with volume analysis or trend-following indicators, the Wickiness Index can further strengthen trade signals. The visual design includes a blue line for the index and horizontal reference lines at 30 and 70, allowing for quick and intuitive interpretation.
The Wickiness Index offers a unique perspective on market sentiment and price action behavior, providing traders with valuable insights into potential turning points, momentum shifts, and market indecision. It is a powerful tool for improving decision-making in volatile markets and identifying areas where price trends may weaken or reverse.

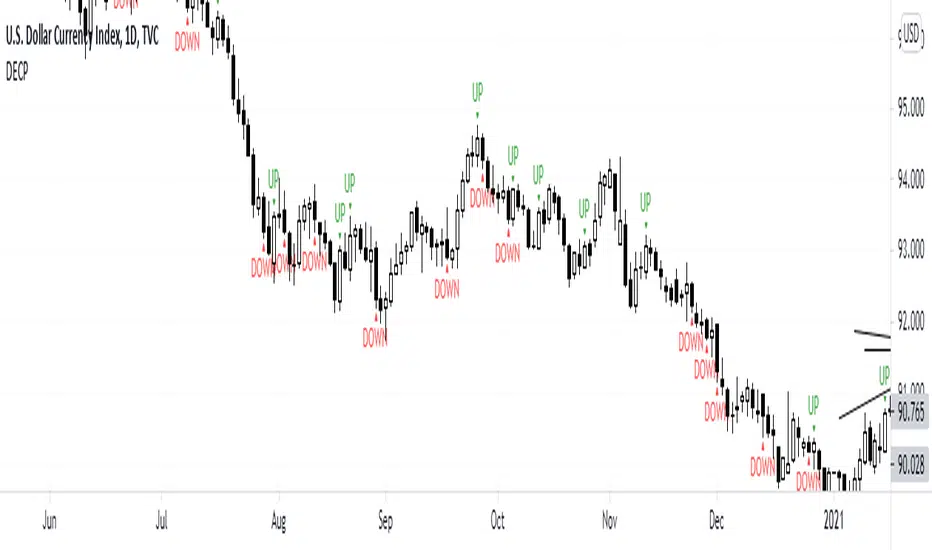
DECPDECP is simple and easy to use!
It detects bullish and bearish engulfing candlestick patterns.
After detecting the patterns I've said, it mentions that the pattern is going to continue its direction to up or down.
But remember candlestick patterns don't determine targets and it's possible that predicted directions fail.
So use it carefully and enjoy it!
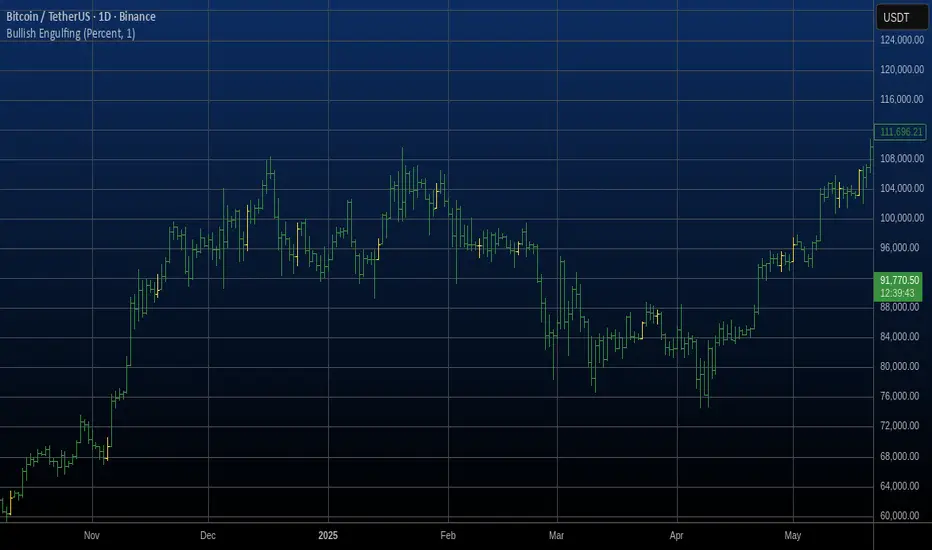
Bullish Engulfing Automatic Finding Script This is a bullish pattern formed by three candlesticks.
The pattern is based on the fact that the last candlestick must
completely engulf the previous two and be upward. The two preceding
candlesticks must also be downward. Candlestick wicks are not taken
into account.
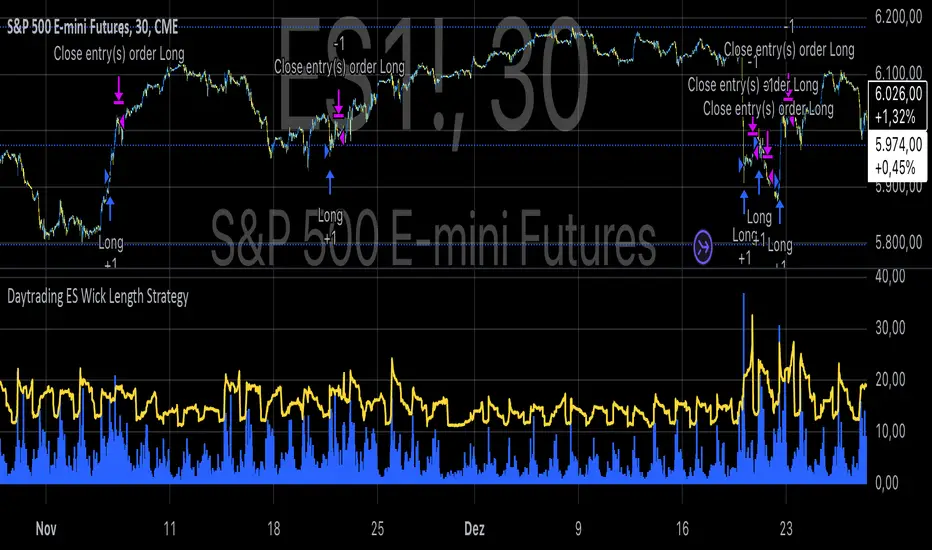
Daytrading ES Wick Length StrategyThis Pine Script strategy calculates the combined length of upper and lower wicks of candlesticks and uses a customizable moving average (MA) to identify potential long entry points. The strategy compares the total wick length to the MA with an added offset. If the wick length exceeds the offset-adjusted MA, the strategy enters a long position. The position is automatically closed after a user-defined holding period.
Key Features:
1. Calculates the sum of upper and lower wicks for each candlestick.
2. Offers four types of moving averages (SMA, EMA, WMA, VWMA) for analysis.
3. Allows the user to set a customizable MA length and an offset to shift the MA.
4. Automatically exits positions after a specified number of bars.
5. Visualizes the wick length as a histogram and the offset-adjusted MA as a line.
References:
• Candlestick wick analysis: Nison, S. (1991). Japanese Candlestick Charting Techniques.
• Moving averages: Brock, W., Lakonishok, J., & LeBaron, B. (1992). “Simple Technical Trading Rules and the Stochastic Properties of Stock Returns”. Journal of Finance.
This strategy is suitable for identifying candlesticks with significant volatility and long wicks, which can indicate potential trend reversals or continuations.