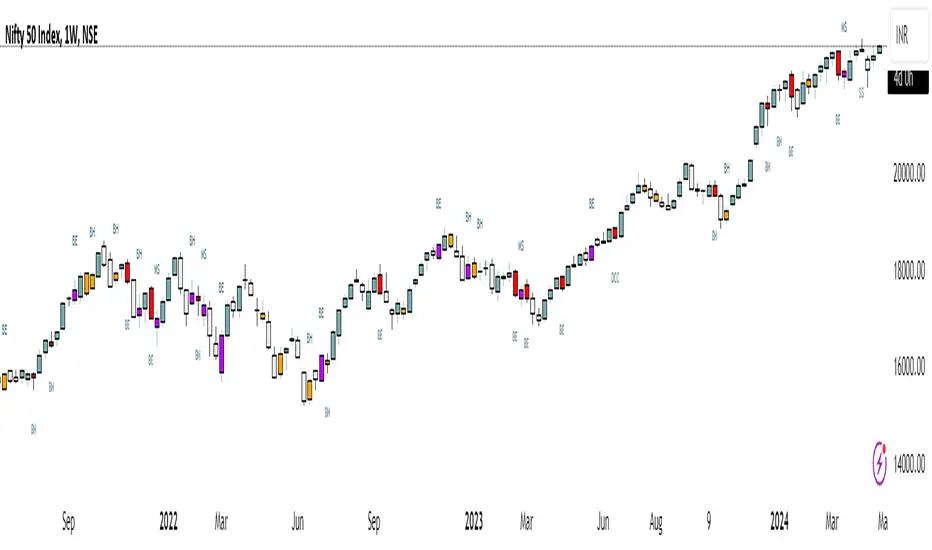
Inside Bar + Bullish and Bearish candlestick [Tarun]
Inside Bar Detection:
The function isInsideBar() checks if a bar is an inside bar, meaning its high is lower than the previous bar's high and its low is higher than the previous bar's low.
Inside bars are highlighted with an orange color.
Bearish Candlestick Patterns:
Bearish Engulfing: When the current candlestick's body completely engulfs the previous candlestick's body.
Dark Cloud Cover: When a bullish candle is followed by a bearish candle that opens above the previous bullish candle's close but closes below its midpoint.
Bearish Harami: When a small bullish candlestick is engulfed by a larger bearish candlestick.
Evening Star: A three-candle pattern consisting of a large bullish candle, a small-bodied candle with a gap up or down, and a large bearish candle that closes below the midpoint of the first candle.
Shooting Star: A single candlestick pattern with a small real body near the bottom of the price range and a long upper shadow.
Bearish Marubozu: A candlestick with a long bearish body and little to no upper or lower shadows.
Bearish candlestick patterns are highlighted with a red color and labeled with abbreviated names.
Bullish Candlestick Patterns:
Bullish Engulfing: Opposite of bearish engulfing, where the current candlestick's body completely engulfs the previous candlestick's body.
Piercing Pattern: When a bearish candle is followed by a bullish candle that opens below the previous bearish candle's low but closes above its midpoint.
Bullish Harami: Similar to bearish harami but bullish, where a small bearish candlestick is engulfed by a larger bullish candlestick.
Morning Star: A three-candle pattern opposite to the evening star, signaling a potential reversal from downtrend to uptrend.
Bullish Hammer: A single candlestick pattern with a small real body near the top of the price range and a long lower shadow.
Bullish Marubozu: A candlestick with a long bullish body and little to no upper or lower shadows.
Bullish candlestick patterns are highlighted with a purple color and labeled with abbreviated names.
Cerca negli script per "Candlestick"
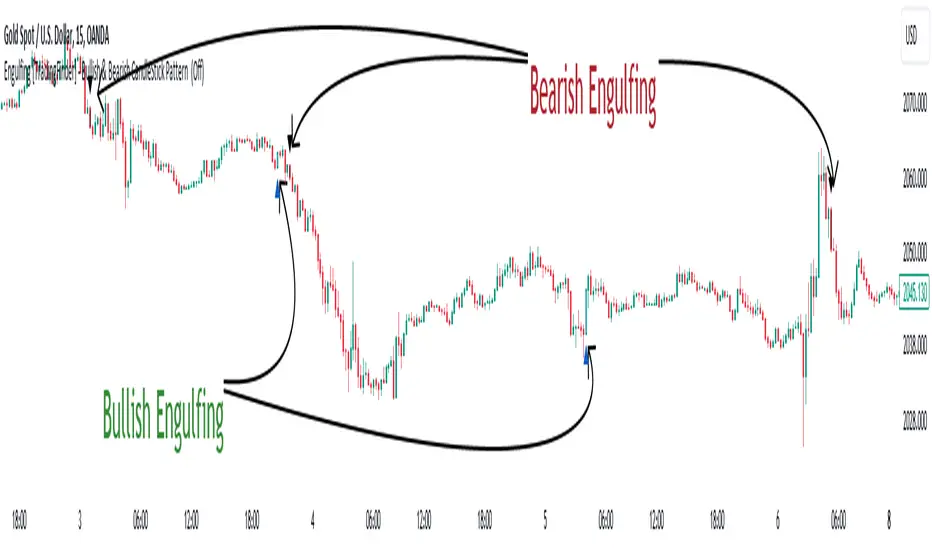
Engulfing [TradingFinder] Bullish & Bearish CandleStick Pattern🔵 Introduction
The candlestick engulfing pattern is important pattern in technical analysis that can be observed in candlestick charts. This pattern occurs when a complete candle engulfs or "engulfs" the body of a previous candle, meaning that the body of the new candle completely covers the body of the previous candle.
The candlestick engulfing pattern has two types: the bullish engulfing pattern and the bearish engulfing pattern.
• Bullish Engulfing Pattern: This pattern occurs when a market candle opens with a larger and higher body than the previous market candle and completely covers the body of the previous candle. This pattern may indicate the presence of strong buying pressure and a potential change in price direction upwards.
• Bearish Engulfing Pattern: This pattern occurs when a market candle opens with a larger and lower body than the previous market candle and completely covers the body of the previous candle. This pattern may indicate the presence of strong selling pressure and a potential change in price direction downwards.
The candlestick engulfing pattern is usually used as a valid signal for a change in price direction in the market and can enhance a combination of crossover investments and technical analysis. However, it should always be evaluated alongside other indicators and market factors, and counter decisions should be made accordingly.
🔵 Recognition Method
Correct, the candlestick engulfing pattern is one of the important patterns in technical analysis that is typically used as a strong signal for a valid change in price direction in the market. This pattern occurs when a candle (usually in the market) opens with a larger and higher (for bullish engulfing pattern) or lower (for bearish engulfing pattern) body than a previous market candle and completely covers the body of the previous candle.
Example of Bullish Engulfing Pattern:
• First Candle: A bearish (downward) candle with a small red body.
• Second Candle: A bullish (upward) candle with a larger body that completely covers the body of the previous candle.
This pattern may indicate a change in price direction from downward to upward.
Example of Bearish Engulfing Pattern:
• First Candle: A bullish (upward) candle with a small green body.
• Second Candle: A bearish (downward) candle with a larger body that completely covers the body of the previous candle.
This pattern may indicate a change in price direction from upward to downward.
The most important point is that the candlestick engulfing pattern should be carefully considered and always evaluated alongside other market indicators and overall conditions. For example, the engulfing pattern near important support or resistance levels, during significant market command changes, or accompanied by other technical signals can have greater signaling power.
🟣 "Bullish Engulfing" Candle
• The first candle is bullish and the second candle is bearish.
• At the end of a downtrend.
• The closing of the first candle is above the opening of the second candle.
• The high of the first candle is higher than the high of the second candle.
Optimal Condition:
• The closing of the first candle is higher than the high of the second candle.
• More than 80% of the first candle is bullish.
🟣 "Bearish Engulfing" Candle
• The first candle is bearish and the second candle is bullish.
• At the end of an uptrend.
• The closing of the first candle is below the opening of the second candle.
• The low of the first candle is lower than the low of the second candle.
Optimal Condition:
• The closing of the first candle is below the opening of the second candle.
• More than 80% of the first candle is bearish.
🔵 Settings
The "Engulf Filter" option allows the "Optimal Condition" to be executed and will show fewer candlesticks.
🔵 Status
Off: Default mode, showing more identifications.
• Green color indicates optimal "Bullish Engulfing" candles.
• Red color indicates optimal "Bearish Engulfing" candles.
On: By changing the default to "On," the number of identifications decreases and the optimal condition is applied.
• Blue color indicates "Bullish Engulfing" candles.
• Black color indicates "Bearish Engulfing" candles.
🟣 Important Note
"Engulfing" candles are very useful signals in the direction of the overall trend, but we do not expect a suitable movement from "Engulfing" candles against the trend.
Crypto Candlestick Patterns - CN VersionIntroduction:
The candlestick chart has been used for centuries since the Japanese applications. Based on the candlestick charting, people developed candle pattern analysis. Now we have tons of books or articles illustrating the usage of reversal patterns and continuation patterns, and computers provide a faster and preciser way to recognize these pattern.
Originally we have a common *All Candlestick Patterns* indicator to use. This indicator works well for most of the markets or commodities including stocks and futures. However, for cryptocurrency market, quite a few patterns are not suitable anymore. For example, crypto markets are continuously running 7x24hrs and the big coins with good volume tend to have almost continuous price in commonly used time periods. Hence, original patterns with "window" or "jump" concepts are usually not applied to crypto.
For these issues, I modified the original *All Candlestick Patterns* indicator and introduced the Chinese version for people speaking such language.
Like most of the other indicators, I personally do not recommend anyone to simply follow the patterns it shows to enter the market. You may take these recognized patterns as a reference, and further actions on trading should be done with several other tools, such as MACD, RSI, Stochastic and etc.
Usage:
The application of this indicator is basically the same as the original *All Candlestick Patterns* and you will get an automatically generated pattern recognition by your computer system.
There are a few parameters to adjust for the indicator:
Trending Detection Settings: Here you can choose SMA-Fast, SMA-Fast/Slow or None detecting options to recognize the current market trend. This is a minor improvement from the original indicator and you can choose your preferred trending detecting settings by changing the length of SMA.
Candlestick Settings: You may adjust the rules to recognize the properties of candlesticks. I add a "perturbation" parameter here, which actually is an error tolerance for pattern recognition. Some seemingly pattern may not fulfill the strict rules of classic candlestick patterns, but we may recognize them by watch the charting on our own. Hence this error tolerance may show more potential patterns from the charting.
Plot Settings: It is the usually colour choice and providing options for bullish/bearish.
Pattern Settings: Here you can select the patterns that you would like to see from the charting. You can pick the preferred reversal patterns or choose to show all the patterns. It's all up to you!
Features:
Language Translation: Since this is a Chinese language version. I have replaced all the English explanation of patterns to Chinese ones. Move your mouse to the label, you will find a brief intro of the pattern and a notice about bullish or bearish signals it indicates.
Alerts: As the same as the original one, we will have the alert options from this indicator. All the alerts and their messages are Chinese. You can activate alerts based on this indicator from the alert management section, as the same as many other indicators you have used before.
Future Improvements:
For now I am satisfied with the work I have done, and I may apply it to several charts. It's welcome for any users to take a look at the codes and put modifications or improvements towards it. Currently most of the comments in the code are in Chinese language, since basically it's for Chinese speaking users, while the code itself and the parameter names should be pretty easy to understand in English. (I have been using English for writing in the past 8 years, hence this introduction is in English as well.)

Custom Candlestick MarkingsThis indicator allows you to filter candlesticks based on their body (the real body) and wick lengths. Specifically, it marks candlesticks based on the following criteria:
For Bearish Candles:
1. The close price is lower than the open price (indicating a bearish candle).
2. The difference between the high and the maximum of open and close is less than or equal to the specified upper wick length.
3. The absolute difference between the close and open is greater than or equal to the specified body height.
For Bullish Candles:
1. The close price is higher than the open price (indicating a bullish candle).
2. The difference between the maximum of open and close and the low is less than or equal to the specified lower wick length.
3. The absolute difference between the close and open is greater than or equal to the specified body height.
These conditions are used to filter and mark candlesticks that meet the specified criteria, allowing you to visually identify them on the chart. This can be useful for technical analysis and identifying specific candlestick patterns or conditions based on body and wick lengths.
Certainly, this indicator can help in identifying trends more easily. Specifically, by applying certain criteria based on the length of candlestick bodies and wicks, it becomes easier to visually capture changes in market trends and specific patterns.
For instance, you can use this indicator to identify candlestick patterns that match specific body heights or wick lengths. This makes it easier to detect signs of trend reversals or trend changes, and it can assist in making trading decisions when combined with trendlines or support and resistance levels.
However, it's common to use this indicator in conjunction with other technical analysis tools and indicators. Confirming trends and pinpointing entry points often requires multiple sources of information and analysis. In investing and trading, thorough research and careful strategy are essential.

Pure Morning 2.0 - Candlestick Pattern Doji StrategyThe new "Pure Morning 2.0 - Candlestick Pattern Doji Strategy" is a trend-following, intraday cryptocurrency trading system authored by devil_machine.
The system identifies Doji and Morning Doji Star candlestick formations above the EMA60 as entry points for long trades.
For best results we recommend to use on 15-minute, 30-minute, or 1-hour timeframes, and are ideal for high-volatility markets.
The strategy also utilizes a profit target or trailing stop for exits, with stop loss set at the lowest low of the last 100 candles. The strategy's configuration details, such as Doji tolerance, and exit configurations are adjustable.
In this new version 2.0, we've incorporated a new selectable filter. Since the stop loss is set at the lowest low, this filter ensures that this value isn't too far from the entry price, thereby optimizing the Risk-Reward ratio.
In the specific case of ALPINE, a 9% Take-Profit and and Stop-Loss at Lowest Low of the last 100 candles were set, with an activated trailing-stop percentage, Max Loss Filter is not active.
Name : Pure Morning 2.0 - Candlestick Pattern Doji Strategy
Author : @devil_machine
Category : Trend Follower based on candlestick patterns.
Operating mode : Spot or Futures (only long).
Trades duration : Intraday
Timeframe : 15m, 30m, 1H
Market : Crypto
Suggested usage : Short-term trading, when the market is in trend and it is showing high volatility .
Entry : When a Doji or Morning Doji Star formation occurs above the EMA60.
Exit : Profit target or Trailing stop, Stop loss on the lowest low of the last 100 candles.
Configuration :
- Doji Settings (tolerances) for Entry Condition
- Max Loss Filter (Lowest Low filter)
- Exit Long configuration
- Trailing stop
Backtesting :
⁃ Exchange: BINANCE
⁃ Pair: ALPINEUSDT
⁃ Timeframe: 30m
⁃ Fee: 0.075%
⁃ Slippage: 1
- Initial Capital: 10000 USDT
- Position sizing: 10% of Equity
- Start: 2022-02-28 (Out Of Sample from 2022-12-23)
- Bar magnifier: on
Disclaimer : Risk Management is crucial, so adjust stop loss to your comfort level. A tight stop loss can help minimise potential losses. Use at your own risk.
How you or we can improve? Source code is open so share your ideas!
Leave a comment and smash the boost button!
Thanks for your attention, happy to support the TradingView community.

Advanced Candlestick Pattern DetectorWhat Does This Indicator Do?
This indicator looks at the way price moves in the market using candlesticks (those red and green bars you see on charts). It tries to find special patterns like Bullish Engulfing, Hammer, Doji, and others. When one of these patterns shows up, the indicator checks a bunch of filters to decide if the pattern is strong enough to be a signal to buy or sell.
The Main Parts of the Indicator
1. Candlestick Pattern Detection
Bullish Engulfing:
Imagine you see a small down candle (red) and then a big up candle (green) that completely “covers” the red one. That’s a bullish engulfing pattern. It can signal that buyers are taking over.
Bearish Engulfing:
The opposite of bullish engulfing. A small up candle (green) is followed by a big down candle (red) that covers the previous candle. This suggests sellers might be in control.
Hammer & Shooting Star:
Hammer: A candle with a very short body and a long shadow at the bottom. It shows that buyers stepped in after a drop.
Shooting Star:
Similar to the hammer but with a long shadow on top. It can indicate that sellers are starting to push the price down.
Doji:
A candle with almost no body. This means the opening and closing prices are very close. It shows indecision in the market.
Harami Patterns (Bullish & Bearish):
These are two-candle patterns where the second candle is completely inside the body of the first candle. They signal that the previous trend might be about to change.
Morning Star & Evening Star:
These are three-candle patterns.
Morning Star:
Often seen at the bottom of a downtrend, it can signal a reversal to an uptrend.
Evening Star:
Seen at the top of an uptrend, it can signal that the price may soon go down.
2. Filters: Making the Signals Smarter
The indicator doesn’t just rely on patterns. It uses several “filters” to decide if a pattern is strong enough to trade on. Here’s what each filter does:
a. Adaptive Thresholds (ATR-Based)
What It Is:
The indicator uses something called ATR (Average True Range) to see how much the price is moving (volatility).
How It Works:
Instead of using fixed numbers to decide if a candle is a Hammer or a Doji, it adjusts these numbers based on current market activity.
User Settings:
Use Adaptive Thresholds: Turn this on to let the indicator adjust automatically.
Body Factor, Shadow Factor, Doji Factor: These numbers are multipliers that decide how small or big the body and shadows of the candle should be. You can change them if you want the indicator to be more or less sensitive.
b. Volume Filter
What It Is:
Volume shows how many trades are happening.
How It Works:
The filter checks if the current volume is higher than the average volume (multiplied by a set factor). This helps ensure that the signal isn’t coming from a very quiet market.
User Settings:
Use Volume Filter: Turn this on if you want to ignore signals when there’s not much trading.
Volume MA Period & Volume Multiplier: These settings determine what “normal” volume is and how much higher the current volume must be to count.
c. Multi-Timeframe Trend Filter
What It Is:
This filter looks at a bigger picture by using a moving average (MA) from a higher timeframe (for example, daily charts).
How It Works:
For a bullish (buy) signal, the indicator checks if the price is above this MA.
For a bearish (sell) signal, the price must be below the MA.
User Settings:
Use Multi-Timeframe Trend Filter: Enable or disable this filter.
Higher Timeframe for Trend: Choose which timeframe (like Daily) to use.
Trend MA Type (SMA or EMA) & Trend MA Period: Choose the type of moving average and how many candles to average.
d. Additional Trend Filters (ADX & RSI)
ADX Filter:
What It Is:
ADX stands for Average Directional Index. It measures how strong a trend is.
How It Works:
If the ADX is above a certain threshold, it means the trend is strong.
User Setting:
ADX Threshold: Set the minimum strength the trend should have.
RSI Filter:
What It Is:
RSI (Relative Strength Index) tells you if the price is overbought (too high) or oversold (too low).
How It Works:
For a buy signal, RSI should be low (under a set threshold).
For a sell signal, RSI should be high (above a set threshold).
User Settings:
RSI Buy Threshold & RSI Sell Threshold: These set the levels for buying or selling.
3. How the Final Signal Is Determined
For a signal (buy or sell) to be generated, the indicator first checks if one of the candlestick patterns is present. Then it goes through all these filters (trend, volume, ADX, RSI). Only if everything is in line will it show:
A BUY signal when all bullish conditions are met.
A SELL signal when all bearish conditions are met.
4. Visual Elements on the Chart
Trend MA Line:
A blue line is drawn on your chart showing the moving average from the higher timeframe (if you enable the trend filter). This helps you see the overall direction of the market.
Labels on the Chart:
When a signal is detected, you’ll see:
A BUY label below the candle (green).
A SELL label above the candle (red).
Background Colors:
The chart background might change slightly (green for bullish and red for bearish) to give you a quick visual cue.
Histogram:
At the bottom, there is a histogram that shows +1 for bullish signals, -1 for bearish signals, and 0 when there’s no clear signal.
5. Alerts
Alerts are built into the indicator so you can get a notification when a signal appears. The alert messages are fixed strings, meaning they always say something like “BUY signal on at price .” You can set up these alerts in TradingView to be notified via sound, email, or pop-up.
How to Use and Adjust the Filters
Deciding on Patterns:
You can choose which candlestick patterns you want to detect by toggling the options (e.g., Bullish Engulfing, Hammer, etc.).
Adjusting Adaptive Thresholds:
If you feel that the indicator is too sensitive (or not sensitive enough) during volatile times, adjust the Body Factor, Shadow Factor, and Doji Factor. These change how the indicator recognizes different candle shapes based on market movement.
Volume Filter Settings:
Use Volume Filter:
Turn this on if you want to ignore signals when there’s not enough trading activity.
Adjust the Volume MA Period and Volume Multiplier to change what “normal” volume is for your chart.
Multi-Timeframe Trend Filter Settings:
Choose a higher timeframe (like Daily) to see the bigger picture trend. Select the type of moving average (SMA or EMA) and its period. This filter ensures you only trade in the direction of the overall trend.
ADX & RSI Filters:
ADX:
Adjust the ADX Threshold if you want to change the minimum strength of the trend needed for a signal.
RSI:
Set the RSI Buy Threshold (for oversold conditions) and RSI Sell Threshold (for overbought conditions) to refine when a signal is valid.
Summary
This indicator is like having a smart assistant that not only looks for specific price patterns (candlesticks) but also checks if the overall market conditions are right using several filters. By combining:
Pattern Detection
Adaptive thresholds (based on ATR)
Volume Checks
Multi-Timeframe Trend Analysis
Additional Trend Strength and Overbought/Oversold Indicators (ADX & RSI)
...it helps you decide if it might be a good time to buy or sell. You can customize each part to fit your trading style, and with the built-in alerts, you can be notified when everything lines up.
Feel free to adjust the settings to see how each filter changes the signals on your chart. Experimenting with these will help you learn how the market behaves and how you can best use the indicator for your own strategy!

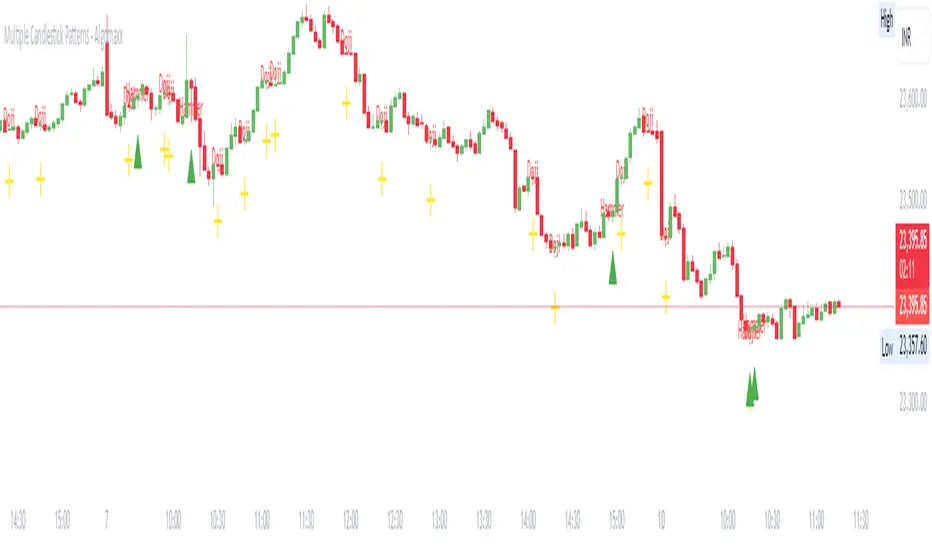
Multiple Candlestick Patterns - AlgomaxxA comprehensive candlestick pattern detection indicator that identifies seven major Japanese candlestick patterns in real-time. This indicator helps traders identify potential reversal and continuation patterns with customizable visual alerts and labels.
Features
Detects 7 major candlestick patterns:
Doji
Hammer
Shooting Star
Bullish Engulfing
Bearish Engulfing
Morning Star
Evening Star
Color-coded candlesticks for easy pattern identification
Customizable pattern indicators above/below candles
Optional pattern labels with adjustable position
Alert conditions for each pattern
Grouped settings for easy customization
Settings
General Settings
Lookback Period: Number of candles to analyze (default: 20)
Body Size Threshold: Minimum relative size for candle body (default: 0.6)
Pattern Settings
Toggle visibility for each pattern type:
Doji Pattern
Hammer Pattern
Shooting Star Pattern
Bullish Engulfing Pattern
Bearish Engulfing Pattern
Morning Star Pattern
Evening Star Pattern
Label Settings
Show Labels: Toggle pattern labels on/off
Label Text Color: Customize label color
Label Position: Choose between Left/Center/Right alignment
Label Offset: Adjust distance of labels from candles
Pattern Descriptions
Doji: Shows indecision when open and close prices are very close
Yellow color
Cross symbol below candle
Hammer: Potential bullish reversal with long lower shadow
Green color
Triangle up symbol below candle
Shooting Star: Potential bearish reversal with long upper shadow
Red color
Triangle down symbol above candle
Bullish Engulfing: Bullish reversal pattern where current green candle completely engulfs previous red candle
Light green color
Triangle up symbol below candle
Bearish Engulfing: Bearish reversal pattern where current red candle completely engulfs previous green candle
Light red color
Triangle down symbol above candle
Morning Star: Three-candle bullish reversal pattern
Seafoam green color
Triangle up symbol below candle
Evening Star: Three-candle bearish reversal pattern
Pink red color
Triangle down symbol above candle
How to Use
Add the indicator to your chart
Customize the settings based on your preferences:
Enable/disable specific patterns you want to monitor
Adjust label settings for better visibility
Set up alerts for patterns you want to be notified about
Pattern Recognition:
Watch for color changes in candlesticks indicating pattern formation
Look for shape indicators above/below candles
Read pattern labels for quick pattern identification
Trading Suggestions:
Use in conjunction with other technical indicators
Consider overall trend and support/resistance levels
Confirm patterns with volume and price action
Wait for pattern completion before making trading decisions
Tips
Patterns work best when used with multiple timeframes
Combine with trend lines and support/resistance levels
Use volume to confirm pattern strength
Consider market context and overall trend
Larger timeframes typically produce more reliable signals
Use alerts to avoid missing important pattern formations
Disclaimer
This indicator is for informational and educational purposes only. No guarantee is made regarding the accuracy of pattern detection or potential future price movements. Always use proper risk management and consider multiple factors before making trading decisions.
[GrandAlgo] Candlestick ThemesTransform your TradingView charts with Candlestick Themes, an indicator that customizes candlestick colors using a variety of stunning themes. Whether you’re seeking improved clarity, enhanced personalization, or a fresh visual appeal, this indicator has something for everyone.
Key Features
This indicator offers a wide selection of pre-defined themes:
TradingView Default: The classic, familiar look of TradingView charts.
GrandAlgo: Our exclusive brand theme, blending vibrancy and professionalism for an exceptional charting experience.
MetaTrader-Inspired Themes: Green on Black, Yellow on Black, and Black on White, designed to replicate the iconic MetaTrader aesthetics.
Green Black: A calming and balanced theme for focused trading.
Darkblue Red: A bold and impactful combination with rich tones.
Darkblue Black: A subtle, sleek palette perfect for minimalists.
Lightblue Red: A mix of warm and cool tones for balanced visuals.
Lightblue Red (Gradient): Adds smooth transitions for a modern feel.
Lightblue Black: Crisp and clean for improved readability.
Crimson to Calm: A gradient theme transitioning from bold to tranquil tones.
Robinhood: Inspired by the clean and vibrant look of the popular trading platform.
Warm & Cool Harmony: A seamless blend of warm and cool tones.
Valentine: Passionate reds and pinks for a romantic visual.
Christmas: Festive greens and reds to match the holiday spirit.
Grapes: A playful mix of purples and greens.
Desert: Warm, sandy hues inspired by desert landscapes.
Real Madrid: A sporty theme with iconic colors for fans.
This indicator ensures seamless integration with TradingView charts, offering personalized trading experience. Whether you're a seasoned trader or just starting, these themes will make your charts both functional and visually appealing.

HTF Candlestick Patterns [TradingView] vX by DGTCandlesticks are graphical representations of price movements for a given period of time. They are commonly formed by the opening, high, low, and closing prices of a financial instrument. They have their origins in the centuries-old Japanese rice trade and have made their way into modern day price charting.
It’s important to note that candlestick patterns aren’t necessarily a buy or sell signal by themselves. They are instead a way to look at market structure and a potential indication of an upcoming opportunity. It is always useful to look at candlestick patterns in context like any other market analysis tool and candlestick patterns are most useful when used in combination with other techniques. There are countless candlestick patterns that traders can use to identify areas of interest on a chart, where some candlestick patterns may provide insights into the balance between buyers and sellers, others may indicate a reversal, continuation, or indecision.
Reversal patterns are quite useful when used in context. Reversal patterns should form at the bottom of a downtrend or at the top of an uptrend. Otherwise, they are not a reversal patterns, but continuation patterns. Most reversal patterns require confirmation such as price move in the direction of reversal accompanied by appropriate trading volume. The reversal patterns can further be confirmed through other means of traditional technical analysis—like trend lines, momentum, oscillators, or volume indicators—to reaffirm buying or selling pressure. The patterns themselves do not guarantee that the trend will reverse. Investors should always confirm reversal by the subsequent price action before initiating a trade.
This study implements some of the most commonly used candlestick patterns in a context with directional movement indicator. On request users can adjust the strong trend threshold from dialog box, eighter can disabled correlation with directional movement indicator. To add additional sight to analysis the simple moving averages of 20, 50, 100 and 200 periods are added (configurable)
You may add additional indicators of your choice. Colored DMI, BB Cloud or Price Distance to its MAs may help
Enjoy it!
Disclaimer: The script is for informational and educational purposes only. Use of the script does not constitutes professional and/or financial advice. You alone the sole responsibility of evaluating the script output and risks associated with the use of the script. In exchange for using the script, you agree not to hold dgtrd tradingview user liable for any possible claim for damages arising from any decision you make based on use of the script

Reversal Candlestick PatternsReversal Candlestick Patterns
Reversal Candlestick Patterns is an indicator designed to detect classic candlestick reversal patterns with additional market context filtering.
The indicator identifies ten well-known reversal candlestick patterns and displays them directly on the chart as visual blocks. Each pattern is detected using its own logic, based on candle structure, position relative to local extremes, and the direction of the current trend.
Bullish patterns:
> Bullish Engulfing
> Morning Star
> Hammer
> Inverted Hammer
> Three White Soldiers
Bearish patterns:
> Bearish Engulfing
> Evening Star
> Hanging Man
> Shooting Star
> Three Black Crows
Pattern configuration
Detection of each individual pattern, its short name displayed on the chart, and the color of the highlighting block can be configured separately in the first two settings groups:
Bullish Patterns and Bearish Patterns .
This allows you to fully customize which patterns are used, how they are labeled, and how they are visually represented.
Trend filtering
The indicator includes an optional trend filter based on two Simple Moving Averages.
It is enabled using the Check Trend setting. The Trend Detection Length parameter is used simultaneously for several calculations:
> Length of the fast moving average
> Half of the slow moving average length
> Number of consecutive bars required to confirm trend direction
This approach helps filter out reversal patterns that form against a well-established trend.
External filters
The indicator supports external confirmation filters for bullish and bearish patterns. External filter settings are located in the External Filters group. For each filter, you can specify the value of an external indicator that must be met for a pattern to be confirmed. This allows flexible integration with oscillators, volume-based indicators, or custom scripts.
Visualization settings
Visualization settings control:
> Pattern name display
> Text size
> Block fill transparency
These settings affect only the visual presentation and do not influence the detection logic.
Alerts
The indicator provides two types of alerts:
1. Global alert for any detected pattern. Created by selecting “Any alert() function call” when setting up an alert.
2. Dedicated alert conditions for:
> Each individual pattern
> Any bullish pattern
> Any bearish pattern
Please note: if detection of a specific pattern is disabled in the settings, alerts for that pattern will not trigger.
Important note
Candlestick patterns should not be used as standalone trading signals. This indicator is intended to be used as part of a broader analysis, together with trend structure, key levels, volume, and other analytical tools.

All Candlestick Patterns on Backtest [By MUQWISHI]▋ INTRODUCTION :
The “All Candlestick Patterns on Backtest” indicator generates a table that offers a clear visualization of the historical return percentages for each candlestick pattern strategy over a specified time period. This table serves as an organized resource, serving as a launching point for in-depth research into candle formations. It may help to rectify any misconceptions surrounding candlestick patterns, refine trading approaches, and it could be foundation to make informed decisions in trading journey.
_______________________
▋ OVERVIEW:
_______________________
▋ CREDIT:
Credit to public technical “*All Candlestick Patterns*” indicator.
_______________________
▋ TABLE:
_______________________
▋ CHART:
_______________________
▋ INDICATOR SETTINGS:
#Section One: Table Setting
#Section Two: Backtest Setting
(1) Backtest Starting Period.
Note: If the datetime of the first candle on the chart is after the entreated datetime, the calculation will start from the first candle on the chart.
(2) Initial Equity ($).
(3) Leverage: Current Equity x Leverage Value.
(4) Entry Mode:
- “At Close”: Execute entry order as soon as the candle confirmed.
- “Breakout High (Low for Short)”: Stop limit buy order, entry order will be executed as soon as the next candle breakout the high of last pattern’s candle (low for short)
(5) Cancel Entry Within Bars: This option is applicable with {Entry Mode = Breakout High (Low for Short)}, to cancel the Entry Order if it's not executed within certain selected number of bars.
(6) Stoploss Range: the range refers to high of pattern - low of pattern.
(7) Risk:Reward: the calculation of risk:reward range start from entry price level. For example: A pattern triggered with range 10 points, and entry price is 100.
- For 1:1~risk:reward would the stoploss at 90 and takeprofit at 110.
- For 1:3~risk:reward would the stoploss at 90 and takeprofit at 130.
#Section Three: Technical & Candle Patterns
_______________________
▋ Comments:
This table was developed for research and educational purposes.
Candlestick patterns are almost similar as seen in “*All Candlestick Patterns*” indicator.
The table results should not be taken as a major concept to build a trading decision.
Personally, I see candlestick patterns as a means to comprehend the psychology of the market, and help to follow the price action.
Please let me know if you have any questions.
Thank you.

All Candlestick Patterns Screener [By MUQWISHI]▋ INTRODUCTION :
The Candlestick Patterns Screener has been designed to offer an advanced monitoring solution for up to 40 symbols. Utilizing a log screener style, it efficiently gathers information on confirmed candlestick pattern occurrences and presents it in an organized table. This table includes essential details such as the symbol name, signal price, and the corresponding candlestick pattern name.
_______________________
▋ OVERVIEW:
_______________________
▋ CREDIT:
Credit to public technical “*All Candlestick Patterns*” indicator.
_______________________
▋ USAGE:
_______________________
▋ Final Comments:
For best performance, add the Candlestick Patterns Screener on active symbol chart like QQQ, SPY, AAPL, BTCUSDT, ES, EURUSD or …etc.
Candlestick patterns are not a major concept to build a trading decision.
Personally, I see candlestick patterns as a means to comprehend the psychology of the market, and help to follow the price action.
Please let me know if you have any questions.
Thank you.

Volume-Enhanced Candlestick Patterns 1
Overview
Scans for four major candlestick reversal patterns:
Harami
Engulfing
Morning/Evening Star
Piercing Line/Dark Cloud Cover
Underlying logic assumes that, at a turning point, the dominant side (bulls or bears) often delivers a “final” push—either a last surge of buying or selling—before the reversal truly takes hold.
Pattern Toggles
Each individual pattern can be turned on or off in the inputs.
Enable only the patterns you want to monitor to reduce chart clutter and speed up performance.
Volume Filter Toggle
On: Requires volume-based exhaustion or climax to confirm each pattern.
Off: Relies purely on price-action candlestick logic (no volume checks).
Grouped Labels & Confluence
When one or more patterns trigger on the same bar close, a single label is drawn:
Grouping multiple confirmed patterns on one bar increases confluence and signal strength.
Climax Volume × Multiplier
Adjusting this input affects signal frequency and conviction:
Higher multiplier → fewer signals but with stronger volume confirmation
Lower multiplier → more signals, each with a looser volume requirement
Alerts
Built-in alert condition for each individual pattern (bullish/bearish Harami, Engulfing, Star, Piercing, Dark Cloud Cover), so you can receive real-time notifications whenever a confirmation occurs.
Follow for Weekly Scripts
If you find this helpful, please hit Follow and 🚀button —I release a new scripts every week.
Disclaimer
Not Financial Advice. This script is for educational and research purposes only.
Use as Part of a Larger System. It should not be used in isolation; combine it with your own risk management rules, additional indicators, and broader market analysis.
No Guarantees. Candlestick patterns and volume filters can improve signal quality, but they do not guarantee profitable trades. Always perform your own due diligence before entering any position.

Fibonacci Candlestick - AYNETHow It Works
Inputs:
ltf_timeframe: Specify the timeframe for candlestick data (e.g., 1H, 4H).
Fibonacci Levels:
Toggle Fibonacci level visibility (show_fib_levels).
Customize Fibonacci line color (fib_color) and width (fib_width).
Candlestick Data:
Fetches open, high, low, and close prices for the specified timeframe using request.security.
Fibonacci Levels:
Calculates standard Fibonacci retracement levels (0.0, 23.6%, 38.2%, 50%, 61.8%, 78.6%, 100%) for each candle's high-low range.
Draws horizontal lines for each level using line.new.
Candlestick Visualization:
Plots lower timeframe candles with customizable bullish and bearish colors.
Key Features
Dynamic Fibonacci Levels:
Fibonacci levels are recalculated for each candlestick's high-low range.
Levels update dynamically with new candles.
Candlestick Overlay:
Visualizes candlestick data from the specified timeframe directly on the current chart.
Customizable Appearance:
Configure colors for Fibonacci levels, candlestick bodies, and wicks.
Use Cases
Microstructure Analysis:
Analyze individual candlesticks with their Fibonacci retracements for potential support/resistance zones.
Multi-Timeframe Trading:
Overlay candlestick and Fibonacci data from a lower timeframe onto a higher timeframe chart.
Let me know if you'd like further enhancements or explanations! 😊

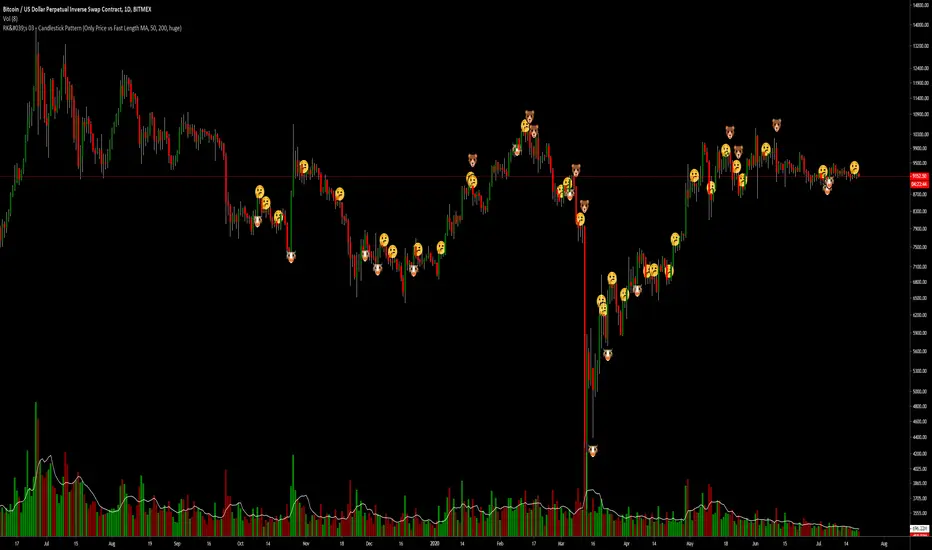
RK's 03 - Candlestick PatternThis code is just a combination of all TradingView's Candlestick Pattern.
I mix all the TV Candlestick Patterns Indicator from the TradingView in Indicator.
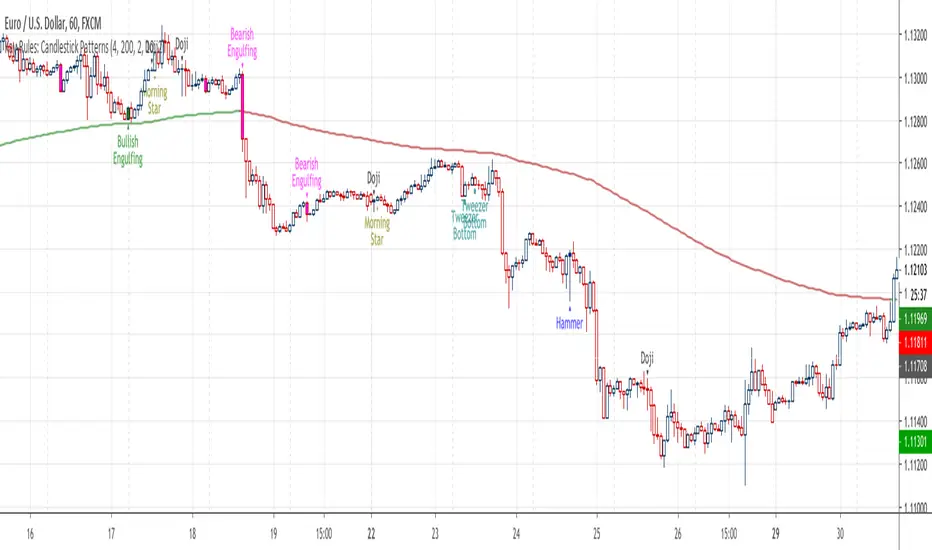
Kay-Rules: Candlestick PatternsThis indicator will mark 5 different candlestick patterns:
(1) bullish & bearish engulfing
(2) hammer & shooting star doji
(3) dragonfly & gravestone doji
(4) morning & evening star doji
(5) bottom & top tweezer
You may follow candlestick trading strategy by Rayner Teo here
Common Candlestick PatternsCommon Candlestick Patters Highlighter.
- TLS: Three Line Strike (Bearish and Bullish)
- AB: Advance Block
- IB: Inside Bar

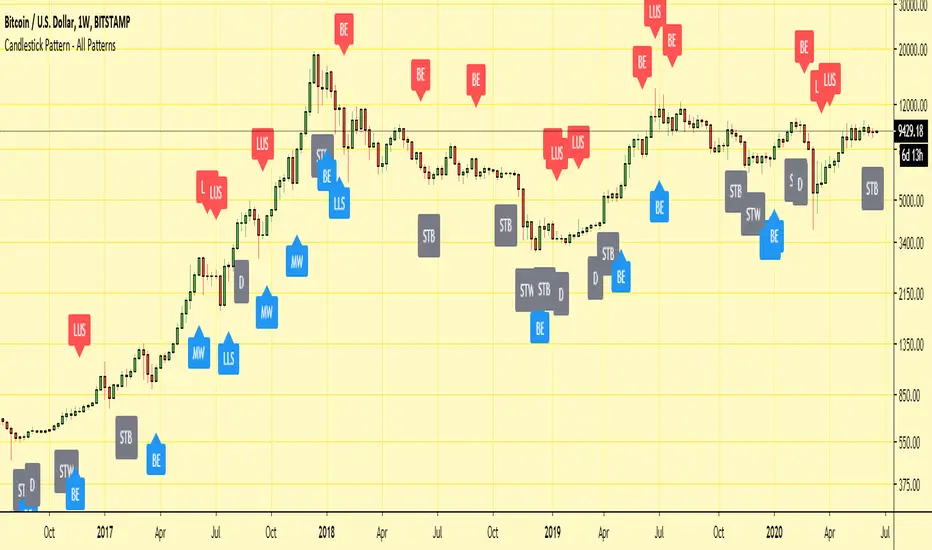
Candlestick Pattern - All PatternsHi,
Here I have collated all of the in-built TradingView candlestick patterns into one indicator.
It works on all time frames and can be useful for candlestick traders to quickly spot patterns forming on any chart.
It also allows for all individual patterns to be set up as seperate alerts within the same indicator.
Any issues/suggestions/requests let me know.
Enjoy!
Weekend Filter Candlestick [odnac]Custom Candlestick Chart with Weekend Visibility Toggle
This indicator customizes the appearance of candlesticks by using a dark gray theme for better visibility.
Additionally, it provides an option to hide weekend candles, allowing traders to focus on weekday price action.
Features:
✅ Dark gray candlestick design for a clean and minimalistic look.
✅ Weekend hiding option – Users can enable or disable weekend candles with a simple toggle.
✅ Helps traders avoid weekend noise and focus on key market movements.
How to Use:
Add the indicator to your chart.
Use the "Hide Weekend Candles" setting to toggle weekend visibility.
When enabled, weekend candles will be hidden for a cleaner chart.
When disabled, all candles, including weekends, will be displayed.
This indicator is useful for traders who prefer to analyze weekday trends without unnecessary weekend fluctuations. 🚀

200 MAPD - Relative Price with candlesticks and divergenceThis is a MAPD (moving average percent difference) indicator that plots the results in candlestick format and with an option to show divergencies of a specific look back period. It's built with 200 moving average, which cannot be adjusted. A divergence is when the actual asset price moves in the opposite direction than the MAPD.
MAPD measures the percent difference of the asset price from the moving average, in this case, 200 moving average.
MAPD is my favorite indicator because it's an leading indicator, capable of predicting upcoming directions pretty accurately if you learn how to use it and how it works on your specific asset. With candlesticks instead of line you can also apply your own price action techniques.
I created this to be somewhat of a substitute for the actual price of the asset, meaning that price action analysis should be applied on this indicator and asset price is used as a secondary to spot divergencies.
The chart showing on this description is my own discretionary plotting of technical aspects. Divergencies will be enabled per default, but my preference is to have them off and plot my own analysis. And turn them on to get an overview from time to time. You can also change the look back period for the divergencies as you like.
I would say it works best from 1 hour to 1 day, maybe 1 week if you're bottom fishing in a big bear trend.
If you try it out and like it i would love to hear how you find it useful in the comments, will be helpful for me and others :)

Combine & Merge Candlesticks + EMACombine & Merge Candlesticks with EMA
You can do the following:-
1 min - look back 5 (5 min) up to 15 (15 min)
5 min - look back 3 (15 min) up to 12 (1 hour)
15 min - look back 4 (1 hour) up to 16 ( 4 hours)
1 hour - look back 4 (4 hours) up to 8 (8 hours - 1 trading session)
4 hour - look back 2 (8 hours - 1 trading session) up to 6 ( 1 Day)
1 day - look back 5 ( 1 week)

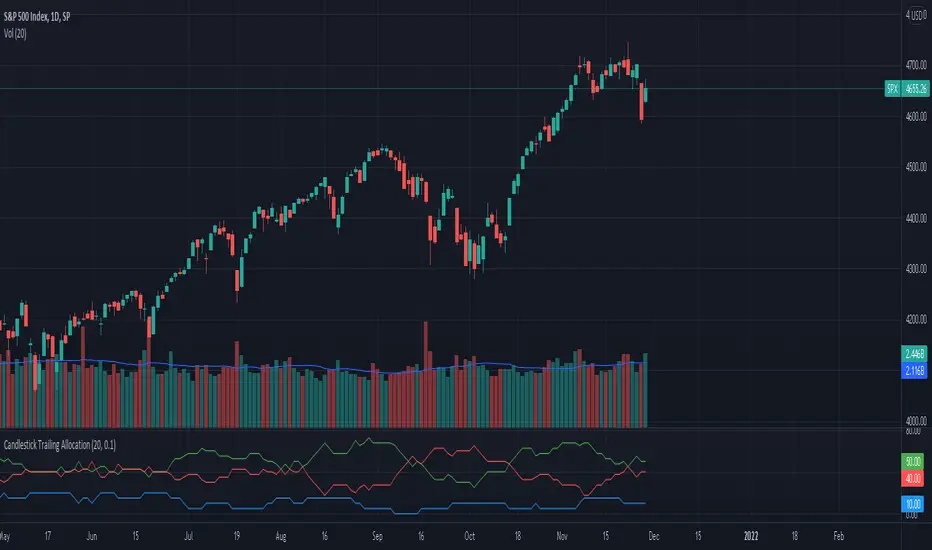
Candlestick Trailing AllocationA simple indicator that calculates the sum of 'Up'(green), 'Down'(red), and 'Doji'(near Doji) candlesticks and portrays the same in an allocation format in percentage. And since it is allocation-based, the total will never exceed 100% of the defined Length period.
The equation is Green + Red + Doji = Total Candles; where total candles = length
When calculating the allocation part, the doji candles are subtracted from the sum of green and red, and the new value is divided by the length period.
For example, the green line = (sum of all green candles - doji / 2) / length; the reason to divide doji by 2 is to eliminate the redundancy it can cause.
When the green line crosses above the red line, the number of green candles is more than red in the defined length period. Similarly, when the red line crossed above the green, there were more red candles than green in that period.
The Doji line shows if any doji or near doji candles have appeared. It acts as a form of resistance against the green and red candles.
There's also the option to change the value of the doji's weight. Default is at 0.1.
The indicator does not show trend nor momentum, even though it may replicate some of its behavior from time to time. It is purely showing the allocation of the number of candles classified as green, red, and doji within the length provided.
Strategy: Candlestick Wick Analysis with Volume Conditions
This strategy focuses on analyzing the wicks (or shadows) of candlesticks to identify potential trading opportunities based on candlestick structure and volume. Based on these criteria, it places stop orders at the extremities of the wicks when certain conditions are met, thus increasing the chances of capturing significant price movements.
Trading Criteria
Volume Conditions:
The strategy checks if the volume of the current candle is higher than that of the previous three candles. This ensures that the observed price movement is supported by significant volume, increasing the probability that the price will continue in the same direction.
Wick Analysis:
Upper Wick:
If the upper wick of a candle represents more than 90% of its body size and is longer than the lower wick, this indicates that the price tested a resistance level before pulling back.
Order Placement: In this case, a Buy Stop order is placed at the upper extremity of the wick. This means that if the price rises back to this level, the order will be triggered, and the trader will take a buy position.
SL Management: A stop-loss is then placed below the lowest point of the same candle. This protects the trader by limiting losses if the price falls back after the order is triggered.
Lower Wick:
If the lower wick of a candle is longer than the upper wick and represents more than 90% of its body size, this indicates that the price tested a support level before rising.
Order Placement: In this case, a Sell Stop order is placed at the lower extremity of the wick. Thus, if the price drops back to this level, the order will be triggered, and the trader will take a sell position.
SL Management: A stop-loss is then placed above the highest point of the same candle. This ensures risk management by limiting losses if the price rebounds upward after the order is triggered.
Strategy Advantages
Responsiveness to Price Movements: The strategy is designed to detect significant price movements based on the market's reaction around support and resistance levels. By placing stop orders directly at the wick extremities, it allows capturing strong movements in the direction indicated by the candles.
Securing Positions: Using stop-losses positioned just above or below key levels (wicks) provides better risk management. If the market doesn't move as expected, the position is automatically closed with a limited loss.
Clear Visual Indicators: Symbols are displayed on the chart at the points where orders have been placed, making it easier to understand trading decisions. This helps to quickly identify the support or resistance levels tested by the price, as well as potential entry points.
Conclusion
The strategy is based on the idea that large wicks signal areas where buyers or sellers have tested significant price levels before temporarily retreating. By placing stop orders at the extremities of these wicks, the strategy allows capturing price movements when they confirm, while limiting risks through strategically placed stop-losses. It thus offers a balanced approach between capturing potential profit and managing risk.
This description emphasizes the idea of capturing significant market movements with stop orders while providing a clear explanation of the logic and risk management. It’s tailored for publication on TradingView and highlights the robustness of the strategy.
