Adaptive Harmonic Forecast [LuxAlgo]The Adaptive Harmonic Forecast indicator decomposes price action into multiple cyclical components and a linear trend to forecast future market movement.
By extracting the most dominant frequencies from recent price data, the tool projects a multi-harmonic model into the future to identify potential reversal points and trend continuations.
🔶 USAGE
The indicator provides a mathematical projection of price action based on the assumption that markets exhibit cyclical behavior. Users can utilize the forecast to anticipate upcoming shifts in momentum or to identify the underlying trend direction.
It is important to note that the forecast is dynamic and recalculates on the most recent bar; therefore, it is best used to confirm momentum shifts when price action aligns with the projected harmonic direction.
🔹 Historical Fit & Forecast
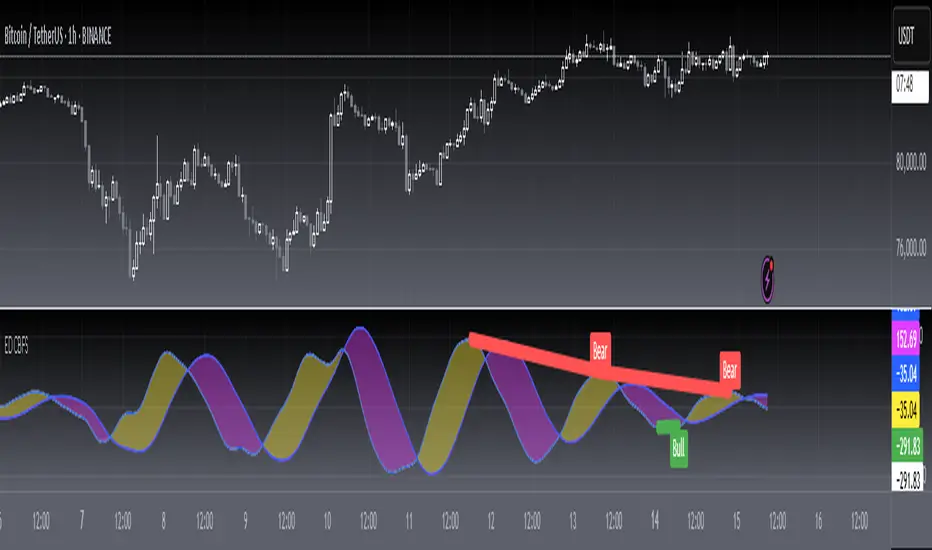
The script displays a solid line over the historical lookback period, representing how well the harmonic model fits the actual price data. Beyond the current bar, a dotted line extends the forecast. This forecast is color-coded: green represents projected upward movement, while red represents projected downward movement. The forecast should be viewed primarily as a timing tool rather than an exact price target, as it projects where the "rhythm" of the market is heading based on current harmonics.
🔹 Trend Line & Reversal Markers
A linear trend line is calculated alongside the sinusoids to show the overall bias (slope) of the lookback period. Additionally, the indicator can plot reversal markers (dots) at the specific points where the forecasted cycles reach a peak or trough. These markers highlight potential future turning points where the composite cycles converge to create a local maximum or minimum.
🔹 Detected Cycles Table
The "Detected Cycles" dashboard allows traders to identify if current price action is dominated by short-term "noise" cycles or larger "structural" cycles. By observing the period lengths (in bars), users can determine the frequency of market swings. If the detected periods are small relative to the lookback, the market is in a high-frequency state; if they are large, the market is exhibiting more stable, long-term cyclicality.
🔶 DETAILS
The script operates through a two-step mathematical process involving spectral analysis and matrix-based regression:
Periodogram Logic (Cycle Detection): The indicator first detrends the data within the lookback window using a linear fit. It then performs a spectral analysis by scanning a range of periods to calculate "spectral power" (the correlation between price and a specific frequency). It identifies "spectral peaks" where price variance is most concentrated, ensuring that only the most meaningful cycles are selected for modeling rather than random noise.
Multi-Harmonic OLS Regression: Once the dominant periods are identified, the script uses Ordinary Least Squares (OLS) regression to solve for the coefficients of a linear combination of basis functions. Specifically, it constructs a model consisting of multiple sine and cosine waves (representing the cycles) and a first-order polynomial (representing the trend). By solving the normal equation using matrix math, the script finds the optimal amplitudes and phases that minimize the squared error against historical price. This composite model is then solved for future time coordinates to create the extrapolation.
🔶 SETTINGS
🔹 Settings
Fit Lookback (N): Determines the number of historical bars used to analyze cycles and fit the model.
Extrapolation Bars: Sets how many bars into the future the forecast should extend.
Number of Sinusoids: The maximum number of individual cycles to include in the composite model (1-10).
🔹 Automatic Cycle Detection
Min Period: The shortest cycle length (in bars) the algorithm is allowed to detect.
🔹 Visuals
Show Reversal Dots: Toggles the markers at forecasted local highs and lows.
Dot Size: Adjusts the visual scale of the reversal markers.
Show Detected Periods: Toggles the data table showing the lengths of the dominant cycles.
🔹 Trend Line
Show Trend Line: Toggles the display of the underlying linear regression line.
Trend Line Color: Sets the color for the historical and projected trend line.
Indicatore Pine Script®