BTC Transaction Indicator Name: "Bitcoin On-Chain Volume & Dynamic Parabolic Curve Signals"
Purpose:
This indicator is designed for Bitcoin traders and long-term holders. It combines the analysis of Bitcoin's on-chain transaction volume with price action to generate "Whale" and "Bear" signals. Additionally, it features a unique dynamic parabolic curve that acts as a visual support line, adapting its visibility based on price interaction with a key Exponential Moving Average (EMA).
Key Components:
On-Chain Volume Analysis:
Utilizes Estimated Transaction Volume (ETRAV) data from the Bitcoin blockchain.
Calculates fast and slow Simple Moving Averages (SMAs) of this volume.
Identifies volume trends (up/down) and significant volume increases/decreases.
Employs fixed thresholds (2,500,000 for low volume and 25,000,000 for high volume) to define key activity levels, similar to how historical on-chain analysis defined accumulation and distribution zones.
Price Action Analysis:
Calculates fast and slow SMAs of the price.
Detects price trends (up/down), recoveries, and declines based on these price SMAs.
"Whale" and "Bear" Signals:
Whale Signals (Buy-side): Generated when there's an upward volume trend, significant volume increase, and a downward price trend followed by price recovery. These indicate potential accumulation phases.
Bear Signals (Sell-side): Generated when there's a downward volume trend, significant volume decrease, and an upward price trend followed by price decline. These indicate potential distribution phases.
Visuals: Both types of signals are plotted as small, colored circles directly on the price chart, with corresponding text labels ("Whale," "Buy," "Bear," "Sell," "Price Recovering," "Price Declining").
Dynamic Parabolic Curve:
Concept: A green parabolic (exponential) curve that serves as a dynamic visual support line.
Activation: The curve starts drawing automatically only when the price crosses over the EMA 500 (Exponential Moving Average of 500 periods). The curve's starting point is set at a user-defined percentage below the EMA 500 value at that exact crossover point.
Visibility: The curve remains visible and continues its trajectory only as long as the price stays above the EMA 500.
Deactivation: The curve disappears instantly if the price falls below or equals the EMA 500. It will only reappear if the price crosses above the EMA 500 again.
Customization: The curve's steepness (Tasa Crecimiento Curva) and its initial distance from the EMA 500 (Inicio Curva % por debajo de EMA500) are adjustable.
Dynamic Label: A "Parabólico" text label is plotted near the center of the active curve segment, with an adjustable vertical offset to ensure it stays visually appealing below the curve.
What is PLOTTED on the chart:
The small, colored circle signals for Whale/Buy and Bear/Sell activity.
The green dynamic parabolic curve.
What is NOT PLOTTED:
EMA 200, EMA 500 lines (though they are calculated internally for logic).
Raw volume data or volume Moving Averages (these are only used for signal calculation, not plotted).
Ideal for:
Bitcoin traders and investors focused on long-term trends and cycle analysis, who want visual cues for accumulation/distribution phases based on on-chain activity, complemented by a unique, dynamically appearing parabolic support curve.
Important Notes:
Relies on the availability of external on-chain data (QUANDL:BCHAIN) within TradingView.
Functions best on a daily timeframe for optimal on-chain data relevance.
Cerca negli script per "Cycle"

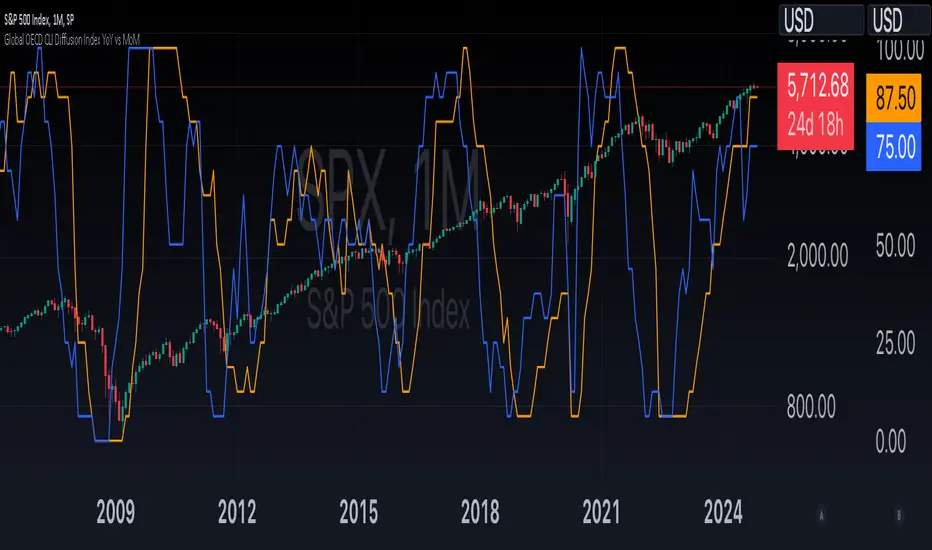
Global OECD CLI Diffusion Index YoY vs MoMThe Global OECD Composite Leading Indicators (CLI) Diffusion Index is used to gauge the health and directional momentum of the global economy and anticipate changes in economic conditions. It usually leads turning points in the economy by 6 - 9 months.
How to read: Above 50% signals economic expansion across the included countries. Below 50% signals economic contraction.
The diffusion index component specifically shows the proportion of countries with positive economic growth signals compared to those with negative or neutral signals.
The OECD CLI aggregates data from several leading economic indicators including order books, building permits, and consumer and business sentiment. It tracks the economic momentum and turning points in the business cycle across 38 OECD member countries and several other Non-OECD member countries.
Payday Anomaly StrategyThe "Payday Effect" refers to a predictable anomaly in financial markets where stock returns exhibit significant fluctuations around specific pay periods. Typically, these are associated with the beginning, middle, or end of the month when many investors receive wages and salaries. This influx of funds, often directed automatically into retirement accounts or investment portfolios (such as 401(k) plans in the United States), temporarily increases the demand for equities. This phenomenon has been linked to a cycle where stock prices rise disproportionately on and around payday periods due to increased buy-side liquidity.
Academic research on the payday effect suggests that this pattern is tied to systematic cash flows into financial markets, primarily driven by employee retirement and savings plans. The regularity of these cash infusions creates a calendar-based pattern that can be exploited in trading strategies. Studies show that returns on days around typical payroll dates tend to be above average, and this pattern remains observable across various time periods and regions.
The rationale behind the payday effect is rooted in the behavioral tendencies of investors, specifically the automatic reinvestment mechanisms used in retirement funds, which align with monthly or semi-monthly salary payments. This regular injection of funds can cause market microstructure effects where stock prices temporarily increase, only to stabilize or reverse after the funds have been invested. Consequently, the payday effect provides traders with a potentially profitable opportunity by predicting these inflows.
Scientific Bibliography on the Payday Effect
Ma, A., & Pratt, W. R. (2017). Payday Anomaly: The Market Impact of Semi-Monthly Pay Periods. Social Science Research Network (SSRN).
This study provides a comprehensive analysis of the payday effect, exploring how returns tend to peak around payroll periods due to semi-monthly cash flows. The paper discusses how systematic inflows impact returns, leading to predictable stock performance patterns on specific days of the month.
Lakonishok, J., & Smidt, S. (1988). Are Seasonal Anomalies Real? A Ninety-Year Perspective. The Review of Financial Studies, 1(4), 403-425.
This foundational study explores calendar anomalies, including the payday effect. By examining data over nearly a century, the authors establish a framework for understanding seasonal and monthly patterns in stock returns, which provides historical support for the payday effect.
Owen, S., & Rabinovitch, R. (1983). On the Predictability of Common Stock Returns: A Step Beyond the Random Walk Hypothesis. Journal of Business Finance & Accounting, 10(3), 379-396.
This paper investigates predictability in stock returns beyond random fluctuations. It considers payday effects among various calendar anomalies, arguing that certain dates yield predictable returns due to regular cash inflows.
Loughran, T., & Schultz, P. (2005). Liquidity: Urban versus Rural Firms. Journal of Financial Economics, 78(2), 341-374.
While primarily focused on liquidity, this study provides insight into how cash flows, such as those from semi-monthly paychecks, influence liquidity levels and consequently impact stock prices around predictable pay dates.
Ariel, R. A. (1990). High Stock Returns Before Holidays: Existence and Evidence on Possible Causes. The Journal of Finance, 45(5), 1611-1626.
Ariel’s work highlights stock return patterns tied to certain dates, including paydays. Although the study focuses on pre-holiday returns, it suggests broader implications of predictable investment timing, reinforcing the calendar-based effects seen with payday anomalies.
Summary
Research on the payday effect highlights a repeating pattern in stock market returns driven by scheduled payroll investments. This cyclical increase in stock demand aligns with behavioral finance insights and market microstructure theories, offering a valuable basis for trading strategies focused on the beginning, middle, and end of each month.

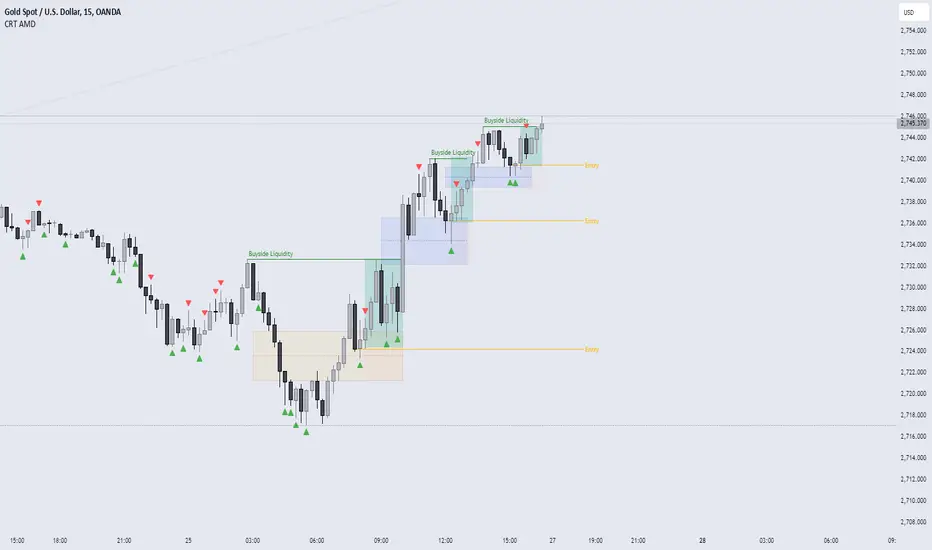
CRT AMD indicatorThis indicator is based on the Power of three (Accumulation Manipulation Distribution) Cycle, by marking the candle that Sweep the low or high of the previous candle and then closed back inside the range of the previous candle, indicating a possibility of a Manipulation or Reversal.
Combining the indicator with HTF Array and LTF Setup Entry will significantly improve the accuracy.
BTC x M2 Divergence (Weekly)### Why the "M2 Money Supply vs BTC Divergence with Normalized RSI" Indicator Should Work
IMPORTANT
- Weekly only indicator
- Combine it with BTC Halving Cycle Profit for better results
The "M2 Money Supply vs BTC Divergence with Normalized RSI" indicator leverages the relationship between macroeconomic factors (M2 money supply) and Bitcoin price movements, combined with technical analysis tools like RSI, to provide actionable trading signals. Here's a detailed rationale on why this indicator should be effective:
1. **Macroeconomic Influence**:
- **M2 Money Supply**: Represents the total money supply, including cash, checking deposits, and easily convertible near money. Changes in M2 reflect liquidity in the economy, which can influence asset prices, including Bitcoin.
- **Bitcoin Sensitivity to Liquidity**: Bitcoin, being a digital asset, often reacts to changes in liquidity conditions. An increase in money supply can lead to higher asset prices as more money chases fewer assets, while a decrease can signal tightening conditions and lower prices.
2. **Divergence Analysis**:
- **Economic Divergence**: The indicator calculates the divergence between the percentage changes in M2 and Bitcoin prices. This divergence can highlight discrepancies between Bitcoin's price movements and broader economic conditions.
- **Market Inefficiencies**: Large divergences may indicate inefficiencies or imbalances that could lead to price corrections or trends. For example, if M2 is increasing (indicating more liquidity) but Bitcoin is not rising proportionately, it might suggest a potential upward correction in Bitcoin's price.
3. **Normalization and Smoothing**:
- **Normalized Divergence**: Normalizing the divergence to a consistent scale (-100 to 100) allows for easier comparison and interpretation over time, making the signals more robust.
- **Smoothing with EMA**: Applying Exponential Moving Averages (EMAs) to the normalized divergence helps to reduce noise and identify the underlying trend more clearly. This double-smoothed divergence provides a clearer signal by filtering out short-term volatility.
4. **RSI Integration**:
- **RSI as a Momentum Indicator**: RSI measures the speed and change of price movements, indicating overbought or oversold conditions. Normalizing the RSI and incorporating it into the divergence analysis helps to confirm the strength of the signals.
- **Combining Divergence with RSI**: By using RSI in conjunction with divergence, the indicator gains an additional layer of confirmation. For instance, a bullish divergence combined with an oversold RSI can be a strong buy signal.
5. **Dynamic Zones and Sensitivity**:
- **Good DCA Zones**: Highlighting zones where the divergence is significantly positive (good DCA zones) indicates periods where Bitcoin might be undervalued relative to economic conditions, suggesting good buying opportunities.
- **Red Zones**: Marking zones with extremely negative divergence, combined with RSI confirmation, identifies potential market tops or bearish conditions. This helps traders avoid buying into overbought markets or consider selling.
- **Peak Detection**: The sensitivity setting for detecting upside down peaks allows for early identification of potential market bottoms, providing timely entry points for traders.
6. **Visual Cues and Alerts**:
- **Clear Visualization**: The plots and background colors provide immediate visual feedback, making it easier for traders to spot significant conditions without deep analysis.
- **Alerts**: Built-in alerts for key conditions (good DCA zones, red zones, sell signals) ensure traders can act promptly based on the indicator's signals, enhancing the practicality of the tool.
### Conclusion
The "M2 Money Supply vs BTC Divergence with Normalized RSI" indicator integrates macroeconomic data with technical analysis to offer a comprehensive view of Bitcoin's market conditions. By analyzing the divergence between M2 money supply and Bitcoin prices, normalizing and smoothing the data, and incorporating RSI for momentum confirmation, the indicator provides robust signals for identifying potential buying and selling opportunities. This holistic approach increases the likelihood of capturing significant market movements and making informed trading decisions.

Financial Astrology Jupiter DeclinationJupiter moving from South declination minima toward the North maxima and during all the travel from North maxima to zero declination produced the strong bullish long term trend, this coincide with other planets declinations observations, in general, we noted that when a planet is in North declination (above zero boundary) this strengthen the planet force and produces more strong price effects.
This Jupiter declination pattern needs more research in others markets, will be great to get the participation from more financial astrologers that could research this declination cycle in other markets and share feedback with us.
Note: The Jupiter declination indicator is based on an ephemeris array that covers years 2010 to 2030, prior or after this years the declination is not available, this daily ephemeris are based on UTC time so in order to align properly with the price bars times you should set UTC as your chart reference timezone.
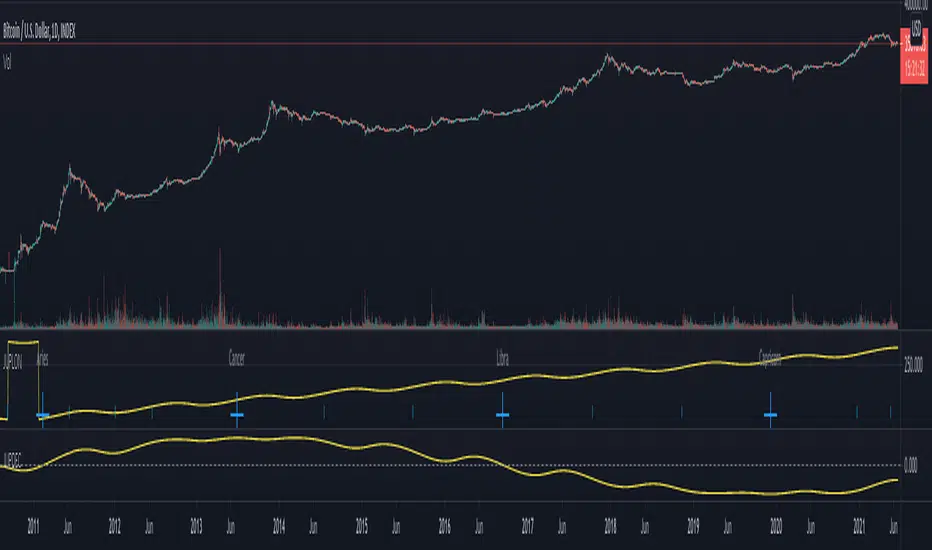
Financial Astrology Sun DeclinationExtreme Sun declinations occurs at the solstices of summer and fall which correspond to the entry of Sun into Cancer and Capricorn respectively. At this extreme points we can observe that many markets tend to produce corrections. Is very interesting to see that when Sun reach the lowest and highest declination extremes. this events correlates very close to price corrections, is not an infalible rule, don't repeat for all observations but in many occurrences during all the historical data that we have of BTCUSD since 2010 have happened.
Is very likely that this same pattern repeats in others markets so will be great to get the participation of other financial astrologers that could research this cycle and share feedback with us.
Note: The Sun declination indicator is based on an ephemeris array that covers years 2010 to 2030, prior or after this years the declination is not available, this daily ephemeris are based on UTC time so in order to align properly with the price bars times you should set UTC as your chart reference timezone.

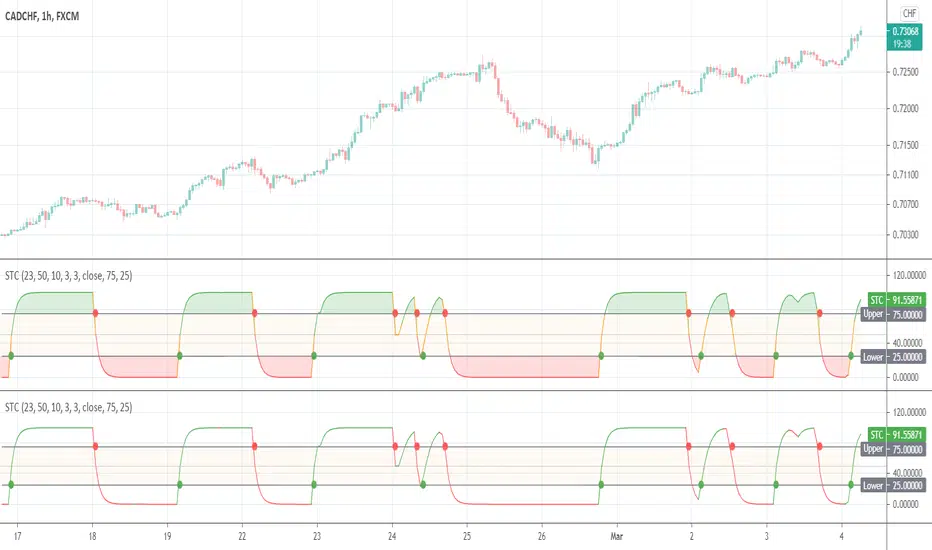
Schaff Trend CycleThis indicator was originally developed by Doug Schaff in the 1990s (published in 2008).
Ehlers Cyber Cycle⭐ Ehlers Cyber Cycle
Description (Copy/Paste for Publishing)
The Ehlers Cyber Cycle is a classic digital signal–processing (DSP) oscillator developed by John F. Ehlers, designed to extract the true cyclic component from price while minimizing lag.
This simplified implementation uses the Cyber Cycle formula (price minus smoothing) along with a fast trigger line to generate clean, low-lag reversal signals.
How It Works
• Price is smoothed using a 6-period EMA
• Cyber Cycle = raw cycle component = price – smooth
• A 3-period EMA trigger line acts as a confirmation filter
• Signals are generated on Cyber/Trigger crossovers
• Zero line helps identify positive/negative cycle states
Features
✔ Low-lag cycle oscillator
✔ Automatic buy/sell crossover signals
✔ Zero-line state shift detection
✔ Extremely lightweight and responsive
✔ Works on all assets and timeframes
✔ Perfect for mean-reversion or cycle-based timing
Use Cases
• Reversal timing
• Cycle confirmation
• Early trend detection
• Filtering noise in choppy markets
• Combining with Ehlers-based indicators (Fisher Transform, Roofing Filter, MESA, etc.)
A clean, fast, and accurate cycle tool for traders who want a simple Ehlers oscillator with strong signal clarity.

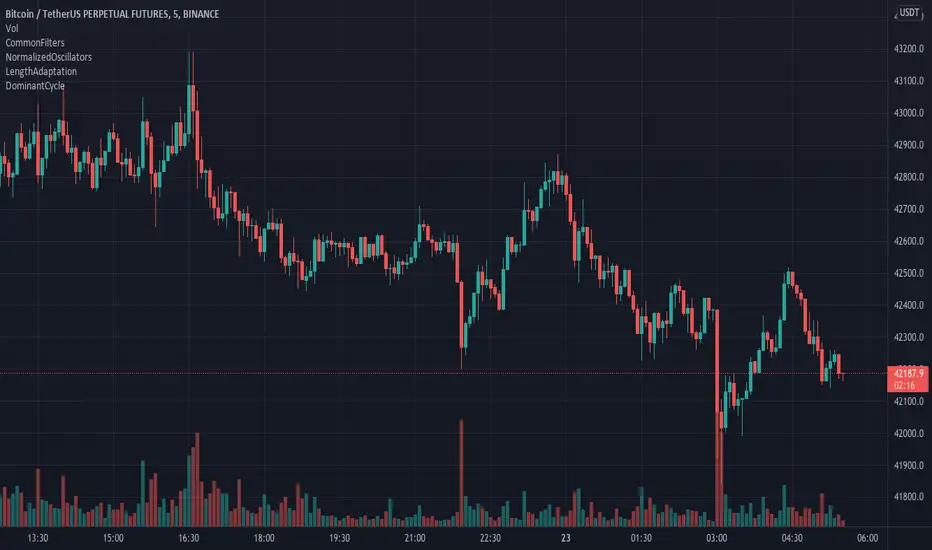
DominantCycleCollection of Dominant Cycle estimators. Length adaptation used in the Adaptive Moving Averages and the Adaptive Oscillators try to follow price movements and accelerate/decelerate accordingly (usually quite rapidly with a huge range). Cycle estimators, on the other hand, try to measure the cycle period of the current market, which does not reflect price movement or the rate of change (the rate of change may also differ depending on the cycle phase, but the cycle period itself usually changes slowly). This collection may become encyclopaedic, so if you have any working cycle estimator, drop me a line in the comments below. Suggestions are welcome. Currently included estimators are based on the work of John F. Ehlers
mamaPeriod(src, dynLow, dynHigh) MESA Adaptation - MAMA Cycle
Parameters:
src : Series to use
dynLow : Lower bound for the dynamic length
dynHigh : Upper bound for the dynamic length
Returns: Calculated period
Based on MESA Adaptive Moving Average by John F. Ehlers
Performs Hilbert Transform Homodyne Discriminator cycle measurement
Unlike MAMA Alpha function (in LengthAdaptation library), this does not compute phase rate of change
Introduced in the September 2001 issue of Stocks and Commodities
Inspired by the @everget implementation:
Inspired by the @anoojpatel implementation:
paPeriod(src, dynLow, dynHigh, preHP, preSS, preHP) Pearson Autocorrelation
Parameters:
src : Series to use
dynLow : Lower bound for the dynamic length
dynHigh : Upper bound for the dynamic length
preHP : Use High Pass prefilter (default)
preSS : Use Super Smoother prefilter (default)
preHP : Use Hann Windowing prefilter
Returns: Calculated period
Based on Pearson Autocorrelation Periodogram by John F. Ehlers
Introduced in the September 2016 issue of Stocks and Commodities
Inspired by the @blackcat1402 implementation:
Inspired by the @rumpypumpydumpy implementation:
Corrected many errors, and made small speed optimizations, so this could be the best implementation to date (still slow, though, so may revisit in future)
High Pass and Super Smoother prefilters are used in the original implementation
dftPeriod(src, dynLow, dynHigh, preHP, preSS, preHP) Discrete Fourier Transform
Parameters:
src : Series to use
dynLow : Lower bound for the dynamic length
dynHigh : Upper bound for the dynamic length
preHP : Use High Pass prefilter (default)
preSS : Use Super Smoother prefilter (default)
preHP : Use Hann Windowing prefilter
Returns: Calculated period
Based on Spectrum from Discrete Fourier Transform by John F. Ehlers
Inspired by the @blackcat1402 implementation:
High Pass, Super Smoother and Hann Windowing prefilters are used in the original implementation
phasePeriod(src, dynLow, dynHigh, preHP, preSS, preHP) Phase Accumulation
Parameters:
src : Series to use
dynLow : Lower bound for the dynamic length
dynHigh : Upper bound for the dynamic length
preHP : Use High Pass prefilter (default)
preSS : Use Super Smoother prefilter (default)
preHP : Use Hamm Windowing prefilter
Returns: Calculated period
Based on Dominant Cycle from Phase Accumulation by John F. Ehlers
High Pass and Super Smoother prefilters are used in the original implementation
doAdapt(type, src, len, dynLow, dynHigh, chandeSDLen, chandeSmooth, chandePower, preHP, preSS, preHP) Execute a particular Length Adaptation or Dominant Cycle Estimator from the list
Parameters:
type : Length Adaptation or Dominant Cycle Estimator type to use
src : Series to use
len : Reference lookback length
dynLow : Lower bound for the dynamic length
dynHigh : Upper bound for the dynamic length
chandeSDLen : Lookback length of Standard deviation for Chande's Dynamic Length
chandeSmooth : Smoothing length of Standard deviation for Chande's Dynamic Length
chandePower : Exponent of the length adaptation for Chande's Dynamic Length (lower is smaller variation)
preHP : Use High Pass prefilter for the Estimators that support it (default)
preSS : Use Super Smoother prefilter for the Estimators that support it (default)
preHP : Use Hann Windowing prefilter for the Estimators that support it
Returns: Calculated period (float, not limited)
doEstimate(type, src, dynLow, dynHigh, preHP, preSS, preHP) Execute a particular Dominant Cycle Estimator from the list
Parameters:
type : Dominant Cycle Estimator type to use
src : Series to use
dynLow : Lower bound for the dynamic length
dynHigh : Upper bound for the dynamic length
preHP : Use High Pass prefilter for the Estimators that support it (default)
preSS : Use Super Smoother prefilter for the Estimators that support it (default)
preHP : Use Hann Windowing prefilter for the Estimators that support it
Returns: Calculated period (float, not limited)
Medium Term Weighted Stochastic (STPMT) by DGTLa Stochastique Pondérée Moyen Terme (STPMT) , or Mᴇᴅɪᴜᴍ Tᴇʀᴍ Wᴇɪɢʜᴛᴇᴅ Sᴛᴏᴄʜᴀꜱᴛɪᴄꜱ created by Eric Lefort in 1999, a French trader and author of trading books
█ The STPMT indicator is a tool which concerns itself with both the direction and the timing of the market. The STPMT indicator helps the trader with:
The general trend by observing the level around which the indicator oscillates
The changes of direction in the market
The timing to open or close a position by observing the oscillations and by observing the relative position of the STPMT versus its moving average
STPMT Calculation
stpmt = (4,1 * stoch(5, 3) + 2,5 * stoch(14, 3) + stoch(45, 14) + 4 * stoch(75, 20)) / 11.6
Where the first argument of the stoch function representation above is period (length) of K and second argument smoothing period of K. The result series is then plotted as red line and its moving average as blue line. By default disabled gray lines are the components of the STPMT
The oscillations of the STPMT around its moving average define the timing to open a position as crossing of STMP line and moving average line in case when both trends have same direction. The moving average determines the direction.
Long examples
█ Tʜᴇ CYCLE Iɴᴅɪᴄᴀᴛᴏʀ is derived from the STPMT. It is
cycle = stpmt – stpmt moving average
It is indicates more clearly all buy and sell opportunities. On the other hand it does not give any information on market direction. The Cycle indicator is a great help in timing as it allows the trader to more easily see the median length of an oscillation around the average point. In this way the traders can simply use the time axis to identify both a favorable price and a favorable moment. The Cycle Indicator is presented as histogram
The Lefort indicators are not a trading strategy. They are tools for different purposes which can be combined and which can serve for trading all instruments (stocks, market indices, forex, commodities…) in a variety of time frames. Hence they can be used for both day trading and swing trading.
👉 For whom that would like simple version of the Cycle indicator on top of the main price chart with signals as presented below.
Please note that in the following code STMP moving average direction is not considered and will plot signals regardless of the direction of STMP moving average. It is not a non-repainting version too.
here is pine code for the overlay version
// © dgtrd
//@version=4
study("Medium Term Weighted Stochastic (STPMT) by DGT", "STPMT ʙʏ DGT ☼☾", true, format.price, 2, resolution="")
i_maLen = input(9 , "Stoch MA Length", minval=1)
i_periodK1 = input(5 , "K1" , minval=1)
i_smoothK1 = input(3 , "Smooth K1", minval=1)
i_weightK1 = input(4.1 , "Weight K1", minval=1, step=.1)
i_periodK2 = input(14 , "K2" , minval=1)
i_smoothK2 = input(3 , "Smooth K2", minval=1)
i_weightK2 = input(2.5 , "Weight K2", minval=1, step=.1)
i_periodK3 = input(45 , "K3" , minval=1)
i_smoothK3 = input(14 , "Smooth K3", minval=1)
i_weightK3 = input(1. , "Weight K3", minval=1, step=.1)
i_periodK4 = input(75 , "K4" , minval=1)
i_smoothK4 = input(20 , "Smooth K4", minval=1)
i_weightK4 = input(4. , "Weight K4", minval=1, step=.1)
i_data = input(false, "Components of the STPMT")
//------------------------------------------------------------------------------
// stochastic function
f_stoch(_periodK, _smoothK) => sma(stoch(close, high, low, _periodK), _smoothK)
//------------------------------------------------------------------------------
// calculations
// La Stochastique Pondérée Moyen Terme (STPMT) or Medium Term Weighted Stochastics calculation
stpmt = (i_weightK1 * f_stoch(i_periodK1, i_smoothK1) + i_weightK2 * f_stoch(i_periodK2, i_smoothK2) + i_weightK3 * f_stoch(i_periodK3, i_smoothK3) + i_weightK4 * f_stoch(i_periodK4, i_smoothK4)) / (i_weightK1 + i_weightK2 + i_weightK3 + i_weightK4)
stpmt_ma = sma(stpmt, i_maLen) // STPMT Moving Average
cycle = stpmt - stpmt_ma // Cycle Indicator
//------------------------------------------------------------------------------
// plotting
plotarrow(change(sign(cycle)), "STPMT Signals", color.green, color.red, 0, maxheight=41)
alertcondition(cross(cycle, 0), title="Trading Opportunity", message="STPMT Cycle : Probable Trade Opportunity\n{{exchange}}:{{ticker}}->\nPrice = {{close}},\nTime = {{time}}")

[blackcat] L2 Ehlers Cyber CycleLevel: 2
Background
John F. Ehlers introuced Cyber Cycle Indicator in his "Cybernetic Analysis for Stocks and Futures" chapter 4 on 2004.
Function
Trading the Cyber Cycle Indicator is straightforward. Buy when the at this point. Sell when the Cycle line crosses under the Trigger line. You are at the bottom of the cycle at this point. Sell when the Cycle line crosses under the Trigger line. You are at the top of the cycle in this case. To be sure, there are crossings at other than the cyclic turning points. Many of these can be eliminated by discretionary traders using their experience or others of their favorite tools. One of the more interesting aspects of the Cyber Cycle is that it was developed simultaneously with the Instantaneous Trendline. They are opposite sides of the same coin because the total frequency content of the market being analyzed is in one indicator or the other. This is important because the conventional methods of using moving averages and oscillators can be dispensed with.
Key Signal
Cycle ---> Cyber Cycle fast line
Cycle (2) ---> Cyber Cycle slow line
Pros and Cons
100% John F. Ehlers definition translation of original work, even variable names are the same. This help readers who would like to use pine to read his book. If you had read his works, then you will be quite familiar with my code style.
Remarks
The 24th script for Blackcat1402 John F. Ehlers Week publication.
Readme
In real life, I am a prolific inventor. I have successfully applied for more than 60 international and regional patents in the past 12 years. But in the past two years or so, I have tried to transfer my creativity to the development of trading strategies. Tradingview is the ideal platform for me. I am selecting and contributing some of the hundreds of scripts to publish in Tradingview community. Welcome everyone to interact with me to discuss these interesting pine scripts.
The scripts posted are categorized into 5 levels according to my efforts or manhours put into these works.
Level 1 : interesting script snippets or distinctive improvement from classic indicators or strategy. Level 1 scripts can usually appear in more complex indicators as a function module or element.
Level 2 : composite indicator/strategy. By selecting or combining several independent or dependent functions or sub indicators in proper way, the composite script exhibits a resonance phenomenon which can filter out noise or fake trading signal to enhance trading confidence level.
Level 3 : comprehensive indicator/strategy. They are simple trading systems based on my strategies. They are commonly containing several or all of entry signal, close signal, stop loss, take profit, re-entry, risk management, and position sizing techniques. Even some interesting fundamental and mass psychological aspects are incorporated.
Level 4 : script snippets or functions that do not disclose source code. Interesting element that can reveal market laws and work as raw material for indicators and strategies. If you find Level 1~2 scripts are helpful, Level 4 is a private version that took me far more efforts to develop.
Level 5 : indicator/strategy that do not disclose source code. private version of Level 3 script with my accumulated script processing skills or a large number of custom functions. I had a private function library built in past two years. Level 5 scripts use many of them to achieve private trading strategy.

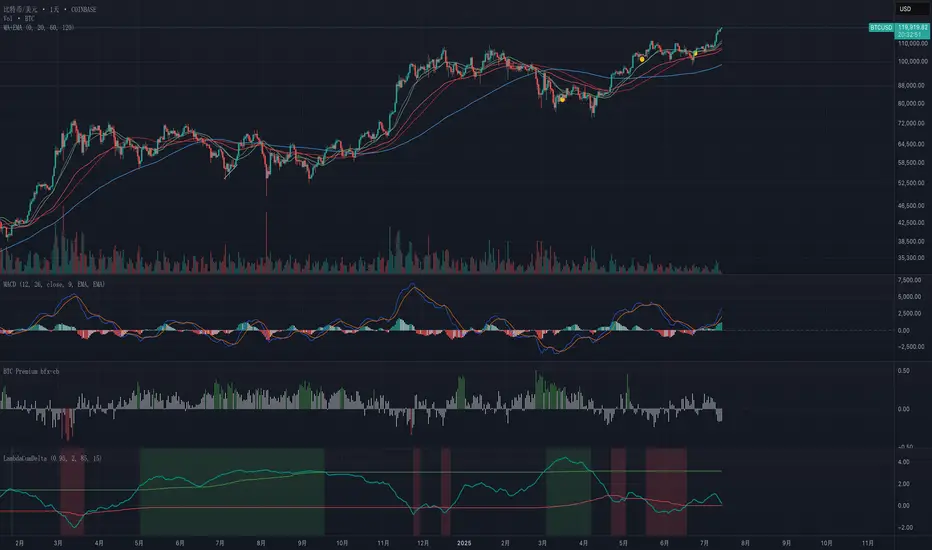
Exponential-Decay Cumulative Spread (Cycle-Tuned)## Indicator Overview
**Exponential-Decay Cumulative Spread (Cycle-Tuned)** – short title **LambdaCumDelta** – tracks the percentage spread between CEXs BTC spot prices.
By clipping outliers, applying an exponential-decay running sum, and comparing that sum to rolling percentile bands, the script flags potential **cycle bottoms** and **cycle tops** whenever the cumulative spread stays beyond extreme thresholds for three consecutive bars.
---
### Core Logic
1. **Price Spread**
`spread_pct = (cexA – cexB) / cexB × 100`.
2. **Outlier Suppression**
* Calculates the **90-day standard deviation σ** of `spread_pct`.
* Uses a **clip coefficient `k_clip`** (0.5–5.0) to cap the spread at `±k_clip × σ`, damping single-day anomalies.
3. **Exponential-Decay Sum**
* Applies a decay factor **λ** (0.50–0.999):
```
CumΔₜ = spread_clipₜ + λ × CumΔₜ₋₁
```
* Larger λ → longer memory half-life.
4. **Rolling Percentile Bands**
* Uses a **365-bar window** to derive dynamic percentile thresholds.
* Upper / Lower bands are set by **perc\_hi** and **perc\_lo** (e.g., 85 % and 15 %).
5. **Signal Definition**
* **Bullish** (cycle bottom): `CumΔ` above the upper band for **3 straight bars**.
* **Bearish** (cycle top): `CumΔ` below the lower band for **3 straight bars**.
---
### Chart Elements
| Plot | Style | Meaning |
| --------------- | ----------------- | ----------------------------------- |
| **CumΔ** | Teal thick line | Exponential-decay cumulative spread |
| Upper Threshold | Green thin line | Rolling upper percentile |
| Lower Threshold | Red thin line | Rolling lower percentile |
| Background | Faded green / red | Bullish / bearish signal zone |
---
### Key Inputs
| Input | Default | Purpose |
| -------------------- | ------- | ------------------------------- |
| **Decay factor λ** | 0.95 | Memory length of CumΔ |
| **Clip coefficient** | 2.0 | Multiple of σ for outlier cap |
| **Upper percentile** | 85 | Cycle-bottom trigger percentile |
| **Lower percentile** | 15 | Cycle-top trigger percentile |
---
### Practical Tips
1. **Timing bias**
* Green background often precedes mean-reversion of the spread – consider scaling into longs or covering shorts.
* Red background suggests stretched positive spread – consider trimming longs or lightening exposure.
2. **Combine with volume, trend filters (MA, MACD, etc.)** to weed out false extremes.
3. Designed for **daily charts**; ensure both exchange feeds are synchronized.
---
### Alerts
Two built-in `alertcondition`s fire when bullish or bearish criteria are met, enabling push / email / webhook notifications.
---
### Disclaimer
This script is for educational and research purposes only and is **not** financial advice. Test thoroughly and trade at your own risk.
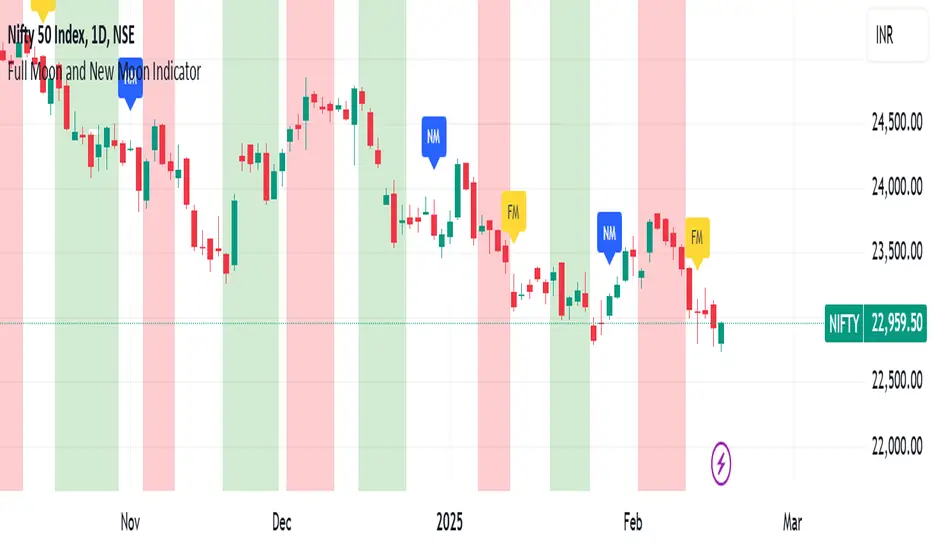
Full Moon and New Moon IndicatorThe Full Moon & New Moon Indicator is a custom Pine Script indicator which marks Full Moon (Pournami) and New Moon (Amavasya) events on the price chart. This indicator helps traders who incorporate lunar cycles into their market analysis, as certain traders believe these cycles influence market sentiment and price action. The current script is added for the year 2024 and 2025 and the dates are considered as per the Telugu calendar.
Features
✅ Identifies and labels Full Moon & New Moon days on the chart for the year 2024 and 2025
How it Works!
On a Full Moon day, it places a yellow label ("Pournami") above the corresponding candle.
On a New Moon day, it places a blue label ("Amavasya") above the corresponding candle.
Example Usage
When a Full Moon label appears, check for potential trend reversals or high volatility.
When a New Moon label appears, watch for market consolidation or a shift in sentiment.
Combine with candlestick patterns, support/resistance, or momentum indicators for a stronger trading setup.
🚀 Add this indicator to your TradingView chart and explore the market’s reaction to lunar cycles! 🌕
Roberts Pi Cycle Top and Bottom Indicator BTCIndicator Overview
The Pi Cycle Top Indicator has historically been effective in picking out the timing of market cycle highs to within 3 days.
It uses the 111 day moving average (111DMA) and a newly created multiple of the 350 day moving average, the 350DMA x 2.
This updated indicator is based on the original x2 Daily Simple Moving Average Pi Cycle Top Indicator for BTCUSD but with the addition of a 3rd 350 SMA
Standard Pi Cycle SMA = 350*2 SMA + 111 SMA
Updated Pi Cycle SMA = 350*2 SMA + 111 SMA + 350 SMA
How It Can Be Used / How to Read:
Chart should be used on BTCUSD only
Chart should be set to Daily Timeframe only
Buy signal RED SMA crosses up over WHITE SMA
Sell Signal RED SMA crosses up over GREEN SMA (a vetical yellow line will indicate the cycle top)

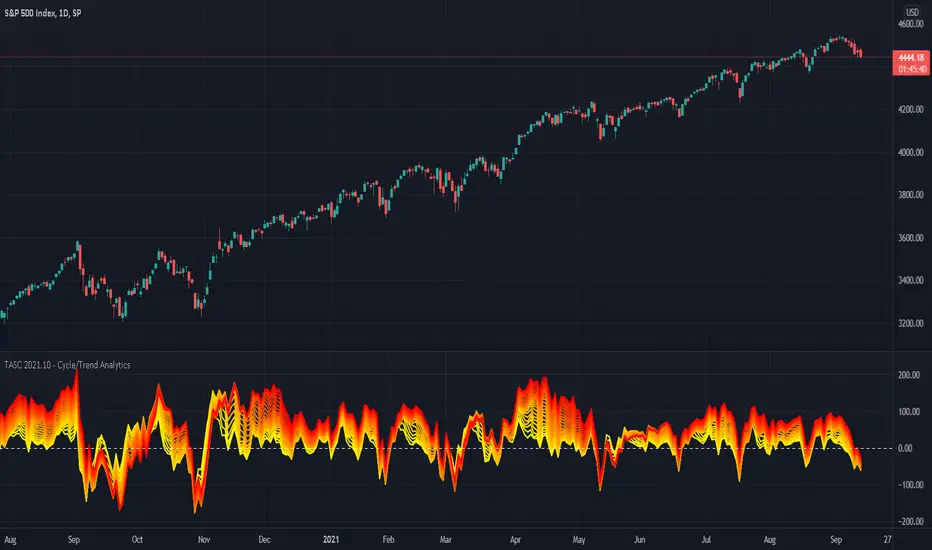
TASC 2021.10 - Cycle/Trend AnalyticsPresented here is code for the "Cycle/Trend Analytics" indicator originally conceived by John Ehlers. This is another one of TradingView's first code releases published in the October 2021 issue of Trader's Tips by Technical Analysis of Stocks & Commodities (TASC) magazine.
This indicator, referred to as "CTA" in later explanations, has a companion indicator that is discussed in the article entitled MAD Moving Average Difference , authored by John Ehlers. He's providing an innovative double dose of indicator code for the month of October 2021.
Modes of Operation
CTA has two modes defined as "trend" and "cycle". Ehlers' intention from what can be gathered from the article is to portray "the strength of the trend" in trend mode on real data. Cycle mode exhibits the response of the bank of calculations when a hypothetical sine wave is utilized as price. When cycle mode is chosen, two other lines will be displayed that are not shown in trend mode. A more detailed explanation of the indicator's technical functionality and intention can be found in the original Cycle/Trend Analytics And The MAD Indicator article, which requires a subscription.
Computational Functionality
The CTA indicator only has one adjustment in the indicator "Settings" for choice of modes. The default mode of operation is "trend". Trend mode applies raw price data to the bank of plots, while the cycle mode employs a sinusoidal oscillator set to a cycle period of 30 bars. These are passed to multiple SMAs, which are then subtracted from the original source data. The result is a fascinating display of plots embellished with vivid array of gradient color on real data or the hypothetical sine wave.
Related Information
• SMA
• color.rgb()
Join TradingView
[blackcat] L2 Ehlers Inverse Fisher Cyber CycleLevel: 2
Background
John F. Ehlers introuced the Inverse Fisher Transform of Cyber Cycle in May, 2004.
Function
"The Inverse Fisher Transform ," describes the calculation and use of the inverse Fisher transform by Dr . Ehlers in 2004. The transform is applied to any indicator with a known probability distribution function, but this script offers a sample transforms: Cyber Cycle . I have created inputs for the trigger levels for entry and exit so that the user may adjust these levels as desired.
In his article, Dr . Ehlers states the inverse Fisher transform can work with any oscillator, and that values between -1 and 1 are more suited for the transform calculations. Here is one version of the inverse Fisher transform of Cyber Cycle . This version takes the highest and lowest value of the Cyber Cycle and normalizes the scale to a range of -1 to 1. John Ehlers shows how to use the inverse Fisher transform ( IFT ) to compress oscillator-type indicators to give clear trading indications of when to buy or sell. The IFT is a nonlinear transformation that changes the probability distribution, so for example, unbounded indicators can be transformed into bounded indicators with a high probability of being either +1 or -1.
Key Signal
ICycle--> Inverse Fisher Transform of Cyber Cycle fast line
Trigger--> Inverse Fisher Transform of Cyber Cycle slow line
Pros and Cons
100% John F. Ehlers definition translation, even variable names are the same. This help readers who would like to use pine to read his book.
Remarks
The 69th script for Blackcat1402 John F. Ehlers Week publication.
Readme
In real life, I am a prolific inventor. I have successfully applied for more than 60 international and regional patents in the past 12 years. But in the past two years or so, I have tried to transfer my creativity to the development of trading strategies. Tradingview is the ideal platform for me. I am selecting and contributing some of the hundreds of scripts to publish in Tradingview community. Welcome everyone to interact with me to discuss these interesting pine scripts.
The scripts posted are categorized into 5 levels according to my efforts or manhours put into these works.
Level 1 : interesting script snippets or distinctive improvement from classic indicators or strategy. Level 1 scripts can usually appear in more complex indicators as a function module or element.
Level 2 : composite indicator/strategy. By selecting or combining several independent or dependent functions or sub indicators in proper way, the composite script exhibits a resonance phenomenon which can filter out noise or fake trading signal to enhance trading confidence level.
Level 3 : comprehensive indicator/strategy. They are simple trading systems based on my strategies. They are commonly containing several or all of entry signal, close signal, stop loss, take profit, re-entry, risk management, and position sizing techniques. Even some interesting fundamental and mass psychological aspects are incorporated.
Level 4 : script snippets or functions that do not disclose source code. Interesting element that can reveal market laws and work as raw material for indicators and strategies. If you find Level 1~2 scripts are helpful, Level 4 is a private version that took me far more efforts to develop.
Level 5 : indicator/strategy that do not disclose source code. private version of Level 3 script with my accumulated script processing skills or a large number of custom functions. I had a private function library built in past two years. Level 5 scripts use many of them to achieve private trading strategy.
Ehlers Adaptive Cyber Cycle Indicator [LazyBear]Another famous Ehlers indicator.
This is the adaptive version of Ehlers' Cyber Cycle (CC) (already published, check "More info" below). Idea behind making something "adaptive" is to calculate it using dynamic cycle period inputs instead of static setting. In adaptive cyber cycle, Ehlers uses the dominant cycle period as the length in computation of alpha.
According to Ehlers this should be more responsive than the non-adaptive version. Buy and sell signals should often occur one bar earlier than for the non-adaptive version.
I have the usual options in place. Check out plain CC for comparison.
More info:
- Cyber Cycle Indicator:
- Cybernetic Analysis for Stocks and Futures (Ehlers)
List of my public indicators: bit.ly
List of my app-store indicators: blog.tradingview.com

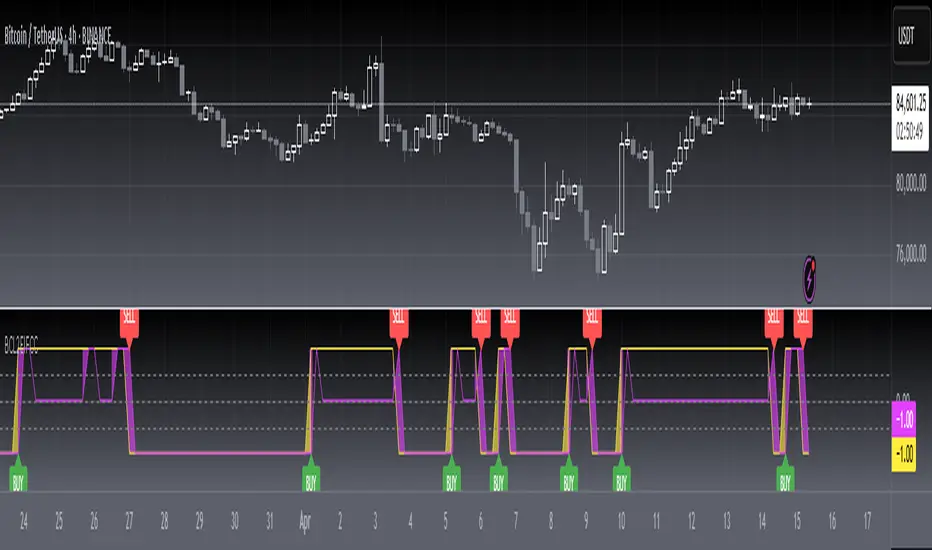
Power RSI Segment Runner [CHE] Power RSI Segment Runner — Tracks RSI momentum across higher timeframe segments to detect directional switches for trend confirmation.
Summary
This indicator calculates a running Relative Strength Index adapted to segments defined by changes in a higher timeframe, such as daily closes, providing a smoothed view of momentum within each period. It distinguishes between completed segments, which fix the final RSI value, and ongoing ones, which update in real time with an exponential moving average filter. Directional switches between bullish and bearish momentum trigger visual alerts, including overlay lines and emojis, while a compact table displays current trend strength as a progress bar. This segmented approach reduces noise from intra-period fluctuations, offering clearer signals for trend persistence compared to standard RSI on lower timeframes.
Motivation: Why this design?
Standard RSI often generates erratic signals in choppy markets due to constant recalculation over fixed lookback periods, leading to false reversals that mislead traders during range-bound or volatile phases. By resetting the RSI accumulation at higher timeframe boundaries, this indicator aligns momentum assessment with broader market cycles, capturing sustained directional bias more reliably. It addresses the gap between short-term noise and long-term trends, helping users filter entries without over-relying on absolute overbought or oversold thresholds.
What’s different vs. standard approaches?
- Baseline Reference: Diverges from the classic Wilder RSI, which uses a fixed-length exponential moving average of gains and losses across all bars.
- Architecture Differences:
- Segments momentum resets at higher timeframe changes, isolating calculations per period instead of continuous history.
- Employs persistent sums for ups and downs within segments, with on-the-fly RSI derivation and EMA smoothing.
- Integrates switch detection logic that clears prior visuals on reversal, preventing clutter from outdated alerts.
- Adds overlay projections like horizontal price lines and dynamic percent change trackers for immediate trade context.
- Practical Effect: Charts show discrete RSI endpoints for past segments alongside a curved running trace, making momentum evolution visually intuitive. Switches appear as clean, extendable overlays, reducing alert fatigue and highlighting only confirmed directional shifts, which aids in avoiding whipsaws during minor pullbacks.
How it works (technical)
The indicator begins by detecting changes in the specified higher timeframe, such as a new daily bar, to define segment boundaries. At each boundary, it finalizes the prior segment's RSI by summing positive and negative price changes over that period and derives the value from the ratio of those sums, then applies an exponential moving average for smoothing. Within the active segment, it accumulates ongoing ups and downs from price changes relative to the source, recalculating the running RSI similarly and smoothing it with the same EMA length.
Points for the running RSI are collected into an array starting from the segment's onset, forming a curved polyline once sufficient bars accumulate. Comparisons between the running RSI and the last completed segment's value determine the current direction as long, short, or neutral, with switches triggering deletions of old visuals and creation of new ones: a label at the RSI pane, a vertical dashed line across the RSI range, an emoji positioned via ATR offset on the price chart, a solid horizontal line at the switch price, a dashed line tracking current close, and a midpoint label for percent change from the switch.
Initialization occurs on the first bar by resetting accumulators, and visualization gates behind a minimum bar count since the segment start to avoid early instability. The trend strength table builds vertically with filled cells proportional to the rounded RSI value, colored by direction. All drawing objects update or extend on subsequent bars to reflect live progress.
Parameter Guide
EMA Length — Controls the smoothing applied to the running RSI; higher values increase lag but reduce noise. Default: 10. Trade-offs: Shorter settings heighten sensitivity for fast markets but risk more false switches; longer ones suit trending conditions for stability.
Source — Selects the price data for change calculations, typically close for standard momentum. Default: close. Trade-offs: Open or high/low may emphasize gaps, altering segment intensity.
Segment Timeframe — Defines the higher timeframe for segment resets, like daily for intraday charts. Default: D. Trade-offs: Shorter frames create more frequent but shorter segments; longer ones align with major cycles but delay resets.
Overbought Level — Sets the upper threshold for potential overbought conditions (currently unused in visuals). Default: 70. Trade-offs: Adjust for asset volatility; higher values delay bearish warnings.
Oversold Level — Sets the lower threshold for potential oversold conditions (currently unused in visuals). Default: 30. Trade-offs: Lower values permit deeper dips before signaling bullish potential.
Show Completed Label — Toggles labels at segment ends displaying final RSI. Default: true. Trade-offs: Enables historical review but can crowd charts on dense timeframes.
Plot Running Segment — Enables the curved polyline for live RSI trace. Default: true. Trade-offs: Visualizes intra-segment flow; disable for cleaner panes.
Running RSI as Label — Displays current running RSI as a forward-projected label on the last bar. Default: false. Trade-offs: Useful for quick reads; may overlap in tight scales.
Show Switch Label — Activates RSI pane labels on directional switches. Default: true. Trade-offs: Provides context; omit to minimize pane clutter.
Show Switch Line (RSI) — Draws vertical dashed lines across the RSI range at switches. Default: true. Trade-offs: Marks reversal bars clearly; extends both ways for reference.
Show Solid Overlay Line — Projects a horizontal line from switch price forward. Default: true. Trade-offs: Acts as dynamic support/resistance; wider lines enhance visibility.
Show Dashed Overlay Line — Tracks a dashed line from switch to current close. Default: true. Trade-offs: Shows price deviation; thinner for subtlety.
Show Percent Change Label — Midpoint label tracking percent move from switch. Default: true. Trade-offs: Quantifies progress; centers dynamically.
Show Trend Strength Table — Displays right-side table with direction header and RSI bar. Default: true. Trade-offs: Instant strength gauge; fixed position avoids overlap.
Activate Visualization After N Bars — Delays signals until this many bars into a segment. Default: 3. Trade-offs: Filters immature readings; higher values miss early momentum.
Segment End Label — Color for completed RSI labels. Default: 7E57C2. Trade-offs: Purple tones for finality.
Running RSI — Color for polyline and running elements. Default: yellow. Trade-offs: Bright for live tracking.
Long — Color for bullish switch visuals. Default: green. Trade-offs: Standard for uptrends.
Short — Color for bearish switch visuals. Default: red. Trade-offs: Standard for downtrends.
Solid Line Width — Thickness of horizontal overlay line. Default: 2. Trade-offs: Bolder for emphasis on key levels.
Dashed Line Width — Thickness of tracking and vertical lines. Default: 1. Trade-offs: Finer to avoid dominance.
Reading & Interpretation
Completed segment RSIs appear as static points or labels in purple, indicating the fixed momentum at period close—values drifting toward the upper half suggest building strength, while lower half implies weakness. The yellow curved polyline traces the live smoothed RSI within the current segment, rising for accumulating gains and falling for losses. Directional labels and lines in green or red flag switches: green for running momentum exceeding the prior segment's, signaling potential uptrend continuation; red for the opposite.
The right table's header colors green for long, red for short, or gray for neutral/wait, with filled purple bars scaling from bottom (low RSI) to top (high), topped by the numeric value. Overlay elements project from switch bars: the solid green/red line as a price anchor, dashed tracker showing pullback extent, and percent label quantifying deviation—positive for alignment with direction, negative for counter-moves. Emojis (up arrow for long, down for short) float above/below price via ATR spacing for quick chart scans.
Practical Workflows & Combinations
- Trend Following: Enter long on green switch confirmation after a higher high in structure; filter with table strength above midpoint for conviction. Pair with volume surge for added weight.
- Exits/Stops: Trail stops to the solid overlay line on pullbacks; exit if percent change reverses beyond 2 percent against direction. Use wait bars to confirm without chasing.
- Multi-Asset/Multi-TF: Defaults suit forex/stocks on 1H-4H with daily segments; for crypto, shorten EMA to 5 for volatility. Scale segment TF to weekly for daily charts across indices.
- Combinations: Overlay on EMA clouds for confluence—switch aligning with cloud break strengthens signal. Add volatility filters like ATR bands to debounce in low-volume regimes.
Behavior, Constraints & Performance
Signals confirm on bar close within segments, with running polyline updating live but gated by minimum bars to prevent flicker. Higher timeframe changes may introduce minor repaints on timeframe switches, mitigated by relying on confirmed HTF closes rather than intrabar peeks. Resource limits cap at 500 labels/lines and 50 polylines, pruning old objects on switches to stay efficient; no explicit loops, but array growth ties to segment length—suitable for up to 500-bar histories without lag.
Known limits include delayed visualization in short segments and insensitivity to overbought/oversold levels, as thresholds are inputted but not actively visualized. Gaps in source data reset accumulators prematurely, potentially skewing early RSI.
Sensible Defaults & Quick Tuning
Start with EMA length 10, daily segments, and 3-bar wait for balanced responsiveness on hourly charts. For excessive switches in ranging markets, increase wait bars to 5 or EMA to 14 to dampen noise. If signals lag in trends, drop EMA to 5 and use 1H segments. For stable assets like indices, widen to weekly segments; tune colors for dark/light themes without altering logic.
What this indicator is—and isn’t
This tool serves as a momentum visualization and switch detector layered over price action, aiding trend identification and confirmation in segmented contexts. It is not a standalone trading system, predictive model, or risk calculator—always integrate with broader analysis, position sizing, and stop-loss discipline. View it as an enhancement for discretionary setups, not automated alerts without validation.
Disclaimer
The content provided, including all code and materials, is strictly for educational and informational purposes only. It is not intended as, and should not be interpreted as, financial advice, a recommendation to buy or sell any financial instrument, or an offer of any financial product or service. All strategies, tools, and examples discussed are provided for illustrative purposes to demonstrate coding techniques and the functionality of Pine Script within a trading context.
Any results from strategies or tools provided are hypothetical, and past performance is not indicative of future results. Trading and investing involve high risk, including the potential loss of principal, and may not be suitable for all individuals. Before making any trading decisions, please consult with a qualified financial professional to understand the risks involved.
By using this script, you acknowledge and agree that any trading decisions are made solely at your discretion and risk.
Do not use this indicator on Heikin-Ashi, Renko, Kagi, Point-and-Figure, or Range charts, as these chart types can produce unrealistic results for signal markers and alerts.
Best regards and happy trading
Chervolino

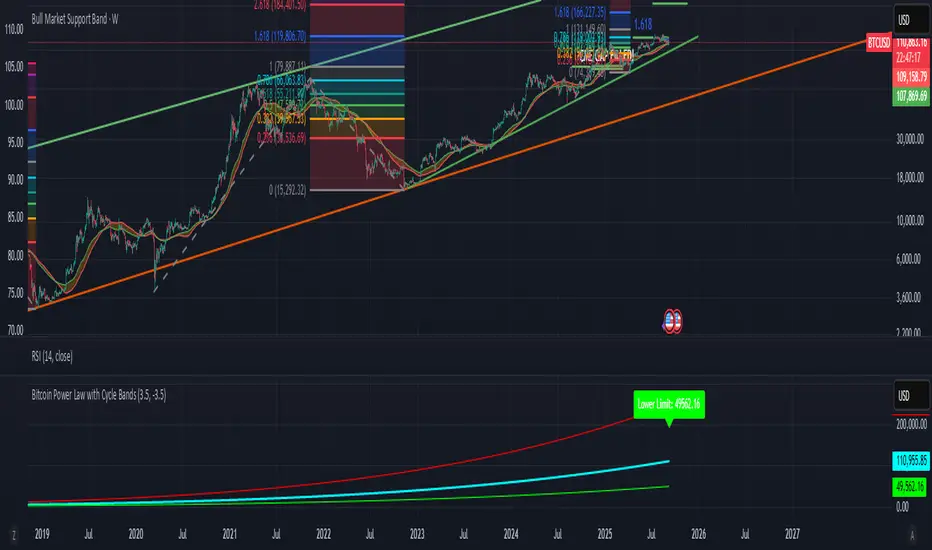
Bitcoin Power Law with Cycle BandsBitcoin Power Law with Cycle Bands DescriptionUnlock the power of Bitcoin’s long-term trends with the Bitcoin Power Law with Cycle Bands script, exclusively available through Bitcoin Wealth Edge! This custom TradingView indicator, built for Pine Script v6, models Bitcoin’s price behavior using a 96% R² power law trendline, derived from days since its genesis (January 3, 2009). Designed to predict cycle tops and bottoms, it features:Power Law Trendline: A cyan line representing fair value (e.g., ~$111,000 as of September 2025), based on a logarithmic regression with adjustable coefficients (a = -17.02, b = 5.83).
Cycle Bands: Adjustable red (upper) and green (lower) bands, defaulting to 3.5x and -3.5x multipliers, aligning with historical peaks (e.g., $69K in 2021) and troughs (e.g., $16K in 2022).
Dynamic Labels: Real-time labels displaying fair value, upper limit ($180K), and lower limit ($40K), updated on the last bar for quick insights.
Follow @HodlerRanch
for updates!
Harmonic BloomHarmonic Bloom - Advanced Geometric Analysis
Building upon my previous Fibonacci inspired indicator "TrendZone", Harmonic Bloom is a sophisticated geometric trading indicator inspired by W.D. Gann's legendary market geometry principles. It reveals market structure through three key pivot points and dynamic angular analysis, creating powerful harmonic intersections for precision trading.
🎯 Core Features:
📍 Three-Point Gann System:
Set 3 custom pivot points to define your analysis timeframe
Automatic trend detection (bullish/bearish) between pivots
Dynamic geometric box construction following Gann's square principles
📐 Gann-Style 45° Angle Projections:
Pivot 2 Line: Follows trend direction (up if bullish, down if bearish)
Pivot 3 Line: Creates opposition (opposite direction to Pivot 2)
Corner Line: Mirrors Pivot 2 from appropriate box corner
All angles project forward using Gann's 1x1 (45°) methodology for future price targets
⚡ POWER OF HARMONIC INTERSECTIONS:
Confluence Zones: Where multiple 45° angles intersect create the strongest support/resistance
Geometric Harmony: Intersections represent natural market turning points
Time-Price Balance: Following Gann's principle that time and price must be in harmony
Multiple Timeframe Resonance: Intersection points often align across different timeframes
High-Probability Reversals: Markets frequently respect these geometric intersection levels
📊 Customizable Retracement Levels:
8 fully configurable levels (default: 0.0, 0.25, 0.5, 0.75, 1.0, 1.25, 1.5, 1.75)
Choose between 25% or 50% trendline alignment
Individual style controls for each level
🔢 Advanced Gann Analytics:
Fibonacci sequence detection in bar counts (Gann studied natural number sequences)
Numerology sum analysis on pivot prices (Gann's mystical number approach)
Special highlighting for significant numbers
Optional on-chart labels for key metrics
📈 Trading Applications:
✅ Support/Resistance: Use retracement levels for entry/exit points
✅ Gann Angles: 45° lines show momentum direction and strength following Gann's time-price theory
✅ Intersection Trading: Most powerful signals occur at harmonic intersections where multiple angles converge
✅ Price Targets: Forward projections provide future price objectives using Gann's geometric principles
✅ Market Geometry: Identify harmonic patterns and geometric confluences
✅ Time Analysis: Fibonacci-based bar counting for timing decisions (Gann emphasized time cycles)
🌟 Why Harmonic Intersections Are So Powerful:
Gann believed that markets move in geometric harmony, and when multiple angles intersect, they create "magnetic price levels" where:
Maximum Energy Convergence: Multiple geometric forces meet at one point
Natural Turning Points: Markets respect these intersections as natural support/resistance
Time-Price Synchronicity: Intersections often coincide with significant time cycles
Multi-Dimensional Confirmation: Price, time, and geometry align simultaneously
⚙️ Highly Customizable:
All colors, widths, and styles adjustable
Toggle any feature on/off independently
Extend projections beyond the analysis box
Choose your preferred visual presentation
Perfect for traders who use Gann theory, geometric analysis, harmonic patterns, and mathematical market structure. The true power lies in trading the intersection points where multiple harmonic angles converge - these represent the market's most significant geometric turning points.

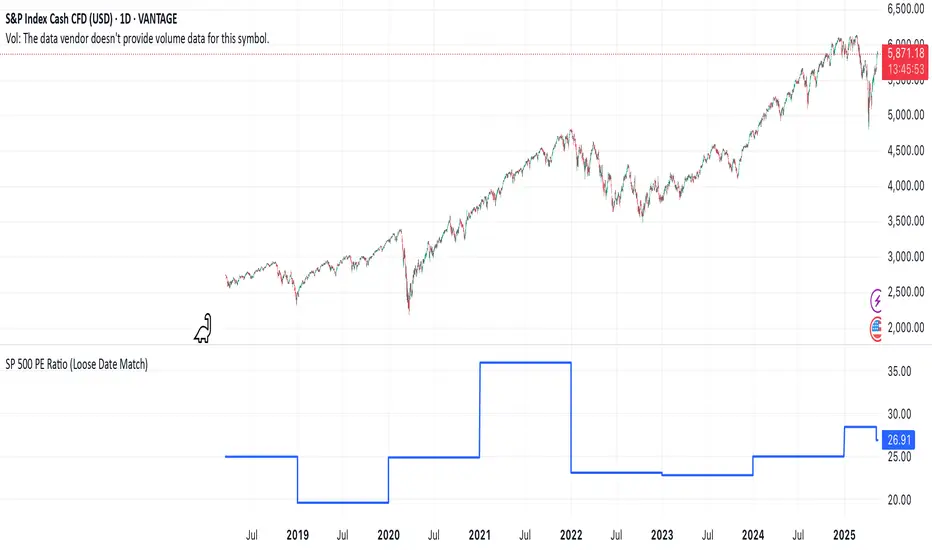
SP 500 PE Ratio (Loose Date Match)📈 **S&P 500 PE Ratio (from Excel Data)**
This custom indicator visualizes the historical S&P 500 Price-to-Earnings (PE) Ratio loaded from Excel. Each data point represents a snapshot of the market valuation at a specific time, typically on an annual or quarterly basis.
🔹 **What it does:**
- Plots the PE ratio values on the chart aligned with historical dates
- Uses stepwise or linear rendering to account for missing trading days
- Helps identify valuation cycles and extremes (e.g., overvalued vs undervalued)
🔍 **Use case:**
- Long-term market analysis
- Compare PE trends with price performance
- Spot long-term entry/exit zones based on valuation
🛠️ Future plans:
- Add value zone highlighting (e.g., PE > 30 = red, PE < 15 = green)
- Support for dynamic datasets (via Google Sheets or Notion)
Category: `Breadth indicators`, `Cycles`
💡 Source: Manually imported data (can be replaced with any custom macro data series)
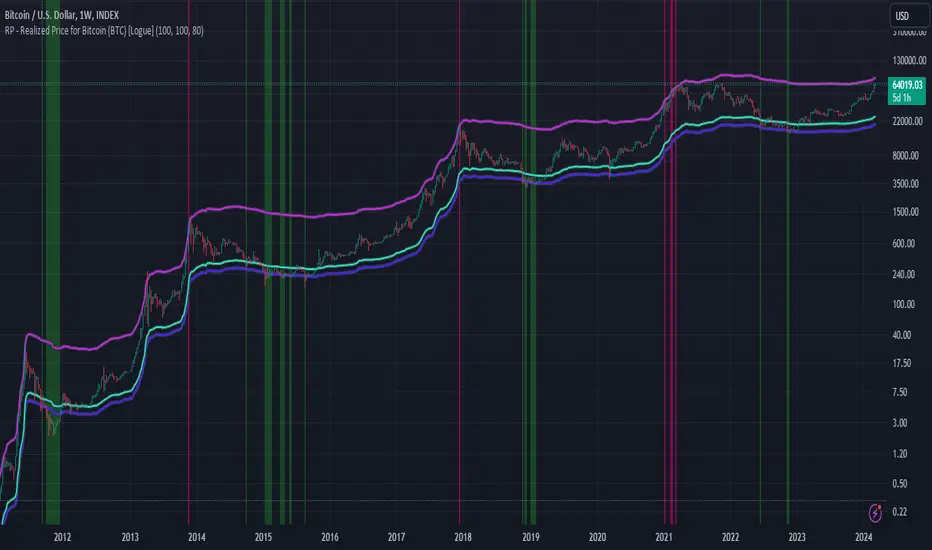
RP - Realized Price for Bitcoin (BTC) [Logue]Realized Price (RP) - The RP is summation of the value of each BTC when it last moved divided by the total number of BTC in circulation. This gives an estimation of the average "purchase" price of BTC on the bitcoin network based on when it was last transacted. This indicator tells us if the average network participant is in a state of profit or loss. This indicator is normally used to detect BTC bottoms, but an extension can be used to detect when the bitcoin network is "highly" overvalued. Because the "strength" of the BTC tops has decreased over the cycles, a logarithmic function for the extension was created by fitting past cycles as log extension = slope * time + intercept. This indicator triggers when the BTC price is above the realized price extension. For the bottoms, the RP is shifted downwards at a default value of 80%. The slope, intercept, and RP bottom shift can all be modified in the script.