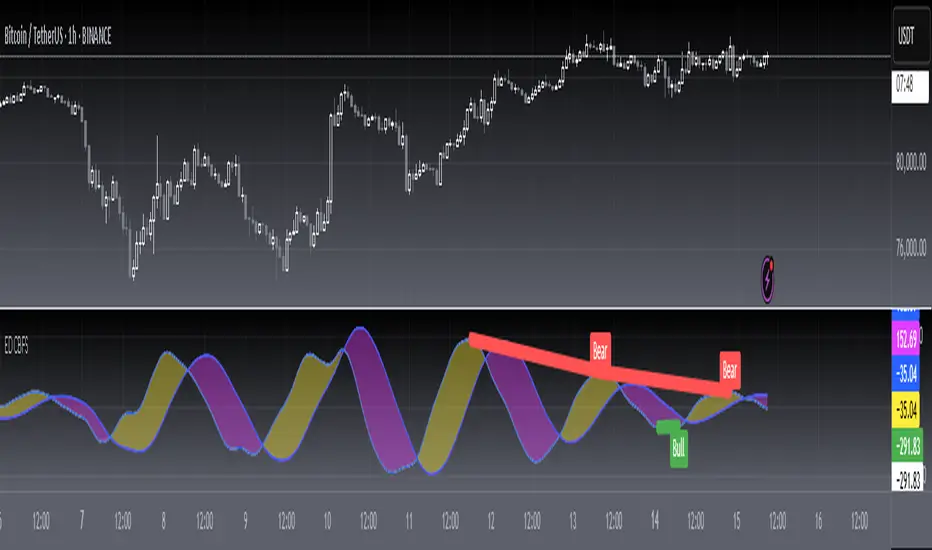
Cerca negli script per "Cycle"
RSI Trend Cycle [JMX]RSI Trend cycle applies fast stochastics and a cyclic component to smooth out RSI movements and make reading of RSI trends dramatically easier.
Works on any timeframe.
Usage:
- LONG on cross from 0 upwards
- SHORT on cross from 100 downwards
Works best if:
traded in the prevailing direction of a market. If the market trend is bullish (like SPY) then you LONG from 0 and step aside on cross down from 100.
Used at an interval lower than the one you want to trade (i.e., 1h for intra-day trends, 1d for weekly trends)
Paired with an exit signal of your choice (i.e., trendline)
Ichimoku BoxIntroducing Ichimoku Box Indicator:
Key Features:
Customizable Box Periods: Adjustable box periods with default settings of 9, 26, and 52.
Shifted Span A and Span B Points: Easily adjustable shifts and colors.
Additional Box Option: Capability to add an extra box for more detailed analysis.
High and Low Markers: Identifies the highest and lowest candle within each box with distinct markers.
Candle Countdown Timer: Displays the remaining candles before a box loses its high or low.
Drag-and-Drop Functionality: Move boxes to any position on the chart with a vertical line.
Automatic Box Drawing: When the indicator is first applied, a vertical line appears on the mouse cursor, and clicking on any point automatically draws the boxes.
How It Works:
The indicator allows users to visualize Ichimoku periods as boxes, highlighting key price levels and shifts in market structure. It simplifies the analysis process by providing visual cues and customizable settings for enhanced flexibility.
NF_PLASMA_SURGE 🧩 NF_PLASMA_SURGE (NightFury Systems)
Author: Lachin M. Akhmedov (aka NightFury)
⚙️ A volumetric impulse oscillator detecting real candle energy through body density, directional momentum, and normalized volatility thrust.
🧠 Core Concept:
Not another RSI. Not another MACD.
NF_PLASMA_SURGE isolates true directional impulse by measuring the physics of price:
Body Energy → how much of each candle’s range is real movement.
Volume Thrust → amplifies strong participation only.
Volatility Normalization → filters emotional spikes and fake momentum.
⚡ Outputs:
Toxic Green = Real buy impulse (surge ignition)
Red Inferno = Real sell impulse (energy drain)
⚡ marks = Charged bursts detected (|z| > threshold)
💫 Synergy:
Designed to integrate with NF_CYBER_FURY as its ignition companion —
Cyber powers the reactor; Plasma lights the core.
🧩 Recommended Stack:
NF_CYBER_FURY + NF_PLASMA_SURGE = The NightFury Reactor System
OPEX VIXEX datesUpdated ohlocracy's OPEX script till 2030
These dates are for standard equity, index, and ETF options expiration managed by OCC, with monthly expirations usually on the third Friday and weekly expirations on other Fridays, except holidays which cause adjustments to Thursdays or nearby trading days.
Quarterly options expiration dates in the US stock market are on the last trading day of the quarter, usually the last business day of March, June, September, and December.
These dates are the last trading day of each quarter, accounting for weekends and holidays when the market is closed. When the last calendar day falls on a weekend, the expiration is set to the last prior trading day.
The VIX monthly expiration is on the Wednesday prior to the stock market monthly opex (third Friday). When holidays affect these days, the expiration shifts to the business day before.
Timebender – 369 PivotsTimebender – 369 Pivots is a clean visual study that marks swing highs and lows with numeric “369-sequence” digits derived from time.
Each digit is automatically color-coded into Accumulation (1 – 3), Manipulation (4 – 6), and Distribution (7 – 9) phases, helping traders identify rhythm and symmetry in market structure.
Labels float above or below bars for clear visibility and never overlap price, allowing smooth zoom and multi-timeframe use.
This base model focuses on clarity, precision, and efficient plotting — no toggles, no clutter — a stable foundation for future Timebender builds.
Gold Market Cap vs BTC Market Cap Ratio
What the script calculates
Gold market cap: XAUUSD spot price × total above-ground stock (converted to troy ounces) in trillions USD.
BTC market cap: Live data from TradingView's CRYPTOCAP:BTC symbol, which provides Bitcoin's circulating market cap (already in USD, converted to trillions here).
Ratio: Gold market cap ÷ BTC market cap (e.g., 1.0 means gold market cap equals BTC; 2.0 means gold is twice BTC's market cap)
Timebender - Fractal CloseTimebender – Fractal Close displays which higher-timeframe candles (Daily, Weekly, Monthly) are scheduled to close within the next 24 hours — helping traders anticipate potential volatility and liquidity shifts around key session or higher-TF closes.
It automatically scans:
• Daily: 1D → 11D
• Weekly: 1W → 3W
• Monthly: 1M → 12M
The detected timeframes are shown in a compact on-chart table that can be positioned anywhere (top, middle, bottom — left, center, or right). You can also customize text color, background, and font size for visual clarity.
Use it to align intraday setups with higher-timeframe structure, or to prepare for major session transitions as multiple fractal closes converge.
Timebender - 90 Minute KillzonesTimebender – 90 Minute Killzones
This indicator divides each trading day into sixteen 90-minute blocks based on New York Time.
Each zone is color-coded by session:
🔴 Asian
🟢 London
🔵 New York AM
🟣 New York PM
It helps visualize recurring intraday rhythms and session overlaps without adding signals or bias.
Includes an optional Daily Close Line (18:00 NYT) to mark the end of the trading day, now zoom-safe and toggleable.
Built for structure, clarity, and visual balance — nothing more, nothing less.
Session times for London (UTC 07:00–16:00 UTC)Session times for London (UTC 07:00–16:00 UTC). Shows the trading hours for the London Session Mon-Fri
Delmar - Ichimoku & 3-8 Trap Ribbon ConceptsDelmar - Ichimoku & 3-8 Trap Ribbon Concepts
Indicator Description
The Delmar - Ichimoku & 3-8 Trap Ribbon Concepts indicator combines the traditional Ichimoku Kinkō Hyō system with a custom 3-8 Trap Ribbon candlestick coloring scheme. This powerful tool helps traders identify trends, momentum, and potential reversal points on any TradingView chart. The Ichimoku components provide a comprehensive view of price action, while the 3-8 Trap Ribbon enhances visualization by coloring candlesticks based on their position relative to key Ichimoku lines.
Key Features
Ichimoku Kinkō Hyō: Plots five lines (Tenkan Sen, Tenkan Sen Short, Kijun Sen, Chikou Span, Senkou Span A & B) and the Kumo (cloud) to identify trends, support/resistance, and momentum.
3-8 Trap Ribbon: Colors candlesticks based on the close price’s position relative to the Tenkan Sen Short (3 periods), Tenkan Sen (9 periods), and Kijun Sen (26 periods), highlighting bullish, bearish, or neutral market conditions.
Customizable Settings: Toggle visibility of Ichimoku lines and Kumo, and adjust calculation periods to suit different timeframes or markets.
Alerts: Generates alerts when candlestick colors change, signaling potential trend shifts or trading opportunities.
How to Use the Indicator
Adding the Indicator
Open TradingView: Log in to your TradingView account and navigate to the chart for your desired asset (e.g., stock, forex, crypto).
Access Indicators: Click the “Indicators, Metrics & Strategies” button (fx icon) at the top of the chart.
Search for the Indicator: Type “Delmar - Ichimoku & 3-8 Trap Ribbon Concepts” in the search bar and select it from the list of published indicators.
Add to Chart: Click the indicator name to apply it to your chart.
Configuring Settings
Once added, customize the indicator via the Settings panel:
Ichimoku Kinkō Hyō Group:
Show Ichimoku Lines: Enable/disable the display of Tenkan Sen, Tenkan Sen Short, Kijun Sen, and Chikou Span (default: enabled).
Show Kumo: Toggle the Kumo (cloud) formed by Senkou Span A and B (default: enabled).
Tenkan Sen Length: Set the period for Tenkan Sen calculation (default: 9).
Tenkan Sen Short Length: Set the period for the short Tenkan Sen (default: 3).
Kijun Sen Length: Set the period for Kijun Sen (default: 26).
Senkou Span B Length: Set the period for Senkou Span B (default: 52).
Chikou & Senkou Offset: Adjust the offset for Chikou Span (past) and Senkou Spans (future) (default: 26).
Adjust these settings based on your trading style or timeframe (e.g., shorter periods for intraday, longer for swing trading).
Interpreting the Indicator
Ichimoku Components:
Tenkan Sen (Red): Short-term trend (default 9 periods). Above Kijun Sen = bullish, below = bearish.
Tenkan Sen Short (Light Red): Ultra-short-term trend (default 3 periods) for faster signals.
Kijun Sen (Blue): Medium-term trend (default 26 periods). Acts as dynamic support/resistance.
Chikou Span (Gray): Close price plotted 26 periods back. Above past price = bullish, below = bearish.
Kumo (Cloud): Formed by Senkou Span A and B. Green cloud = bullish (Span A > Span B), red = bearish (Span A < Span B). Price above Kumo = bullish trend, below = bearish.
3-8 Trap Ribbon (Candlestick Colors):
Dark Green: Close is above all three lines (Tenkan Sen Short, Tenkan Sen, Kijun Sen) → Strong bullish momentum.
Light Green: Close is below Tenkan Sen Short but above Tenkan Sen and Kijun Sen → Moderate bullish signal.
Yellow: Close is between Tenkan Sen and Kijun Sen → Neutral or consolidation.
Dark Red: Close is below all three lines → Strong bearish momentum.
Light Red: Close is above Tenkan Sen Short but below Tenkan Sen and Kijun Sen → Moderate bearish signal.
Gray: Default for undefined conditions.
Setting Up Alerts
The indicator includes an alert system to notify you when candlestick colors change, indicating potential trend shifts.
Open Alert Menu: Click the “Alert” button (bell icon) on the TradingView toolbar.
Select the Indicator: Choose “Delmar - Ichimoku & 3-8 Trap Ribbon Concepts” as the condition.
Configure Alert:
Set the condition to “Any alert() function call” to capture color change alerts (e.g., “Candle color changed to Dark Green”).
Choose your notification method (e.g., email, SMS, webhook, or TradingView notification).
Set the frequency to “Once Per Bar Close” to avoid multiple alerts per bar.
Create Alert: Save the alert and ensure it’s active.
Use these alerts to monitor key market shifts, such as entering/exiting a trend or spotting consolidation.
Trading Strategies
Trend Following:
Bullish: Enter long when price is above the Kumo, Chikou Span is above past price, and candles are Dark Green or Light Green.
Bearish: Enter short when price is below the Kumo, Chikou Span is below past price, and candles are Dark Red or Light Red.
Reversal Signals:
Look for Tenkan Sen crossing above/below Kijun Sen, combined with a color change (e.g., from Yellow to Dark Green for bullish reversal).
Confirm reversals when price breaks through the Kumo with a color shift (e.g., Dark Red to Yellow or Light Green).
Consolidation: Yellow candles indicate price is between Tenkan Sen and Kijun Sen, suggesting a range-bound market. Avoid trend-based trades until a breakout occurs.
Combine with other indicators (e.g., RSI, volume) for confirmation.
Tips for Optimal Use
Timeframes: Use on higher timeframes (e.g., 1H, 4H, Daily) for swing trading, or lower timeframes (e.g., 5M, 15M) for day trading.
Markets: Works well on trending markets (forex, stocks, crypto). Adjust period lengths for volatile assets.
Customization: Experiment with Tenkan Sen Short (e.g., 3–5 periods) and offset values to match market speed.
Backtesting: Test the indicator on historical data to validate signals before live trading.
Limitations
Lagging Indicators: Ichimoku components are based on historical data, so signals may lag in fast-moving markets.
False Signals: Yellow candles (consolidation) may occur frequently in choppy markets, requiring confirmation from other tools.
Performance: On low-end devices, rendering the Kumo and multiple lines may slow down if zoomed out over large datasets.
Support
For questions or suggestions, contact the indicator author via TradingView’s messaging system or check the script’s comment section for updates. Happy trading!
Wyckoff Stage Approximator (MTF Alerts)Wyckoff Stage Approximator (MTF Context)
This indicator is a powerful tool designed for traders who use a top-down, multi-timeframe approach based on Wyckoff principles. Its primary function is to identify the market's current stage—consolidation (Stage 1) or trend (Stage 2)—on a higher Context (C) timeframe and project that analysis onto your lower Validation (V) and Entry (E) charts.
This ensures you are always trading in alignment with the "big picture" trend, preventing you from taking low-probability trades based on lower-timeframe noise.
Core Concept: Top-Down Analysis
The script solves a common problem for multi-timeframe traders: losing sight of the primary trend. By locking the background color to your chosen Context timeframe (e.g., 15-minute), you are constantly reminded of the market's true state.
🟡 Yellow Background (Stage 1): The Context timeframe is in consolidation. This is a time to be patient and wait for a clear directional bias to emerge.
🟢 Green Background (Stage 2 - Markup): The Context timeframe is in a confirmed uptrend. This is your green light to look for bullish pullback opportunities on your lower timeframes.
🔴 Red Background (Stage 2 - Markdown): The Context timeframe is in a confirmed downtrend. This is your signal to look for bearish rally opportunities.
How It Works
The indicator uses a combination of moving averages and trend strength to objectively define each stage:
Trend Alignment: It checks if the 5 EMA, 10 EMA, and 20 EMA are properly stacked above or below the 50 SMA to determine the potential trend direction.
Trend Strength: It uses the ADX to measure the strength of the trend. A trend is only confirmed as Stage 2 if the ADX is above a user-defined threshold (default is 23), filtering out weak or choppy moves.
Stage Definition: Any period that is not a confirmed, strong Stage 2 Markup or Markdown is classified as a Stage 1 consolidation phase.
Key Features
Multi-Timeframe (MTF) Projection: Select your master "Context" timeframe, and its analysis will be displayed on any chart you view.
Customizable Inputs: Easily adjust the moving average lengths and ADX threshold to fit your specific strategy and the asset you are trading.
Clear Visual Cues: The intuitive background coloring makes it easy to assess the market environment at a glance.
Stage Transition Alerts: Set up specific alerts to be notified the moment your Context timeframe shifts from a Stage 1 consolidation to a Stage 2 trend, ensuring you never miss a potential setup.
How to Use This Indicator
Add the indicator to your chart.
In the settings, set the "Context Timeframe" to your highest timeframe (e.g., "15" for 15-minute).
Create alerts for the "Stage 1 -> Stage 2" conditions.
When you receive an alert, it signals that a potential trend is beginning on your Context chart.
Switch to your lower Validation and Entry timeframes. The background color will confirm the higher-timeframe trend, giving you the confidence to look for your specific entry patterns.
Disclaimer: This tool is designed for confluence and environmental analysis. It is not a standalone signal generator. It should be used in conjunction with your own price action, volume, or order flow analysis to validate trade entries.
AlfaCrypto_ATC_versionALFA TRADE CLUB is a version of the indicator that Ms. Neslihan explained in the link below.
www.youtube.com
The Crypteller LEVELSAutomatically shows key highs and lows from the previous day, week, and month — no need to mark them manually.
Keeps your chart clean — only the latest levels are visible.
Works on any timeframe, so you can instantly see where major liquidity sits.
Relative Volume at TimeIt tells you whether current trading activity is unusually high or low compared to typical levels at that same time in past sessions.
For example:
A reading of 2.0 means volume is twice the usual amount for this moment in the trading day.
A reading below 1.0 means volume is quieter than normal.
Swing Line Gabriel__ionescuEMA for swing trading, to be used for trend continuations. If you message me on IG, I'll tell you how to make entries using the moving average.