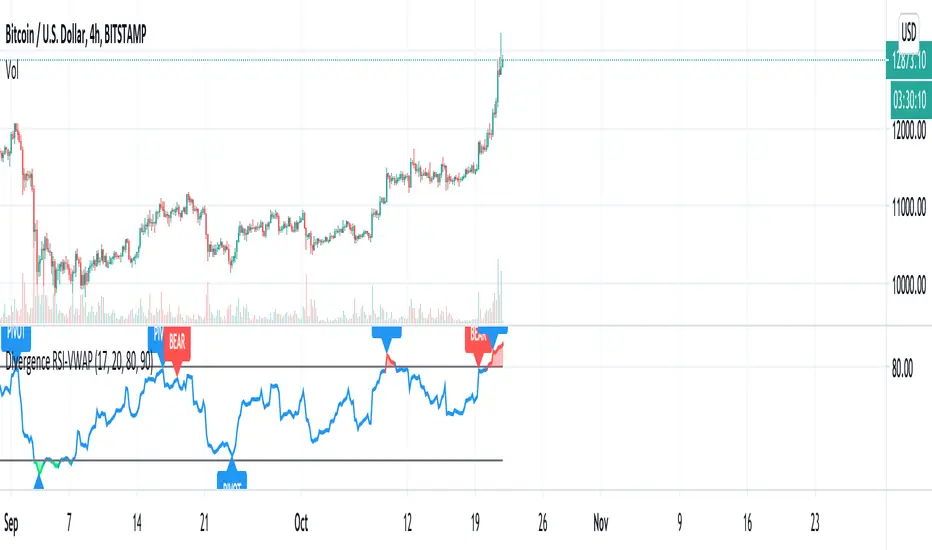
Divergence RSI-VWAPCombination of the script from XaviZ of RSI-VWAP and divergence detector from Libertus.
Cerca negli script per "Divergence"
Divergence of Market Breadth & Price deduction indicatorHow it begin?
Traders and investors use market breadth in order to assess the index’s overall health. Market breadth can be a reliable, if not an accurate, indicator of an upcoming price rise in the index. Similarly, it can also provide early warning signs for a future price decline.
What is it?
market breadth in this case refer to percentage of stocks above 20 Simple Moving Average,which could be used as a barometer for the market.
How it works?
This paticular indicator compare the divergence of Nasdaq 100 and Russell 2000 percentage of stocks above 20 Simple Moving Average.
This indicator also include a deduction price method ,which is inspired from LEI & LoneCapital


Price/OBV divergenceShows agreement or disagreement between the direction of the the price and the on-balance volume. When they disagree, the price is supposed to follow the OBV (or so they say.)

High & Low Oscillator 13x8 CrossOscillator for various uses, divergence versus price action and "0" crossing of trend/move change among others. Use with caution

LX Rsi Divergence BarsThis script colours the bars when they are below or boyond a specified RSI threshold

Turbo Oscillator [RunRox]Introducing Turbo Oscillator by RunRox, our new indicator that combines a multitude of useful and unique features, which we will detail in this post.
List of Advanced Technologies:
Real-Time Divergences: Detects discrepancies between price movements and oscillator indicators to forecast potential price reversals.
Real-Time Hidden Divergences: We identify hidden divergences in real-time. These are not the standard type of divergences; they are opposite to regular divergences, providing unique insights into potential market movements.
Overbought and Oversold Zones: Identifies areas where the market is potentially overextended, suggesting possible entry and exit points.
Signal Line: Indicates the market direction, helping traders to quickly understand current trends.
Money Flow Histogram: Shows the flow of money into and out of the market, providing insights into buying and selling pressure.
Predicted Reversal Zones: Pinpoints areas where the market might experience reversals, aiding in strategic planning and risk management. These zones also serve as potential areas for taking profits, enhancing their utility for exit strategy planning.
Customizable Alerts: You can flexibly set up alerts for any events detected by our indicator, ensuring you stay informed about critical market movements.
To begin with, I would like to describe the difference between classic divergences and hidden divergences.
As you can see, these are opposite situations. Our oscillator identifies both types of divergences and displays them in real-time.
Divergences can serve as points where the price might reverse in the opposite direction, making both classic and hidden divergences powerful tools for spotting reversal points. I'll show a few examples of how divergences are used in our oscillator.
Classic Divergences - which we identify in real-time. As you can see, the price often reacts strongly to the formation of these divergences, frequently changing its direction.
Hidden Divergences - we also observe frequent movement in the opposite direction on the chart. The advantage of our indicator is that we show divergences in real-time without delays, allowing you to react immediately to trend changes.
Overbought and Oversold Zones - These zones allow you to see trend changes when the price is clearly overbought or oversold. When the color changes from a contrasting shade to a neutral one, you can observe the trend shift. The lines work by combining the positivity/negativity of the histogram, the positivity/negativity of the signal line, and the direction of the signal line (red/green). This sophisticated interaction provides precise insights into market conditions, making it an invaluable tool for traders.
Signal Line - This provides insights into trend changes and price reversals. The points on the line better indicate the beginning of a trend shift. These points can vary in size, offering a clearer understanding of the strength of the emerging trend. This feature works in combination with RSI, Stochastic, and MFI. RSI and MFI are top-tier indicators, while Stochastic adds responsiveness and sensitivity to trend changes, ensuring you capture every market movement accurately and promptly.
Money Flow Histogram - As shown in the example, our histogram displays the divergence between money flow and the actual price. You can see that while the price is rising, the money flow is decreasing, indicating insufficient demand for the asset and an imminent trend change. This feature uses MFI with an extended period, providing a more comprehensive and accurate analysis of market conditions. The extended period enhances the reliability of the Money Flow Index, making it an essential tool for identifying subtle shifts in market dynamics.
Predicted Reversal Zones - We automatically identify potential price reversal zones and display them above our overbought and oversold zones. In cases of strong overbought or oversold conditions, we detect potential price pullbacks and mark the beginning of a trend change. This helps you better identify trend shifts. We recommend considering these zones as potential take profit points for your trades.
Customizable Alerts - Our flexible alert system allows you to receive notifications only for the events you are interested in. These can include:
1. Classic Divergences
2. Hidden Divergences
3. Overbought or Oversold conditions on the status line
4. Strong Overbought or Oversold conditions on the status line
5. Signals from the signal line
6. Reversal zones in any direction
Our oscillator is a unique indicator that provides a comprehensive understanding of price movements. It can be used as a standalone tool for analyzing price action.
Here are a few examples of using our Oscillator in practice:
In the example above, you can see three conditions that have formed for a potential trade:
1. Clear overbought condition with a formed reversal point.
2. Decreasing Money Flow Index diverging from the rising price.
3. Formed classic divergence.
The entry point could be the formed divergence, while the exit point could be the overbought condition at the bottom of the oscillator along with the reversal points.
Here's another example of using hidden divergence, where you can see three conditions for a potential trade:
1. Overbought zone
2. Formed hidden divergence
3. Start of bearish movement indicated by the signal line
You can enter the trade either when the hidden divergence forms or wait for confirmation of the trend change by the signal line and enter the trade when the corresponding signal forms on the signal line. The exit point could be the opposite reversal point or the formation of a new hidden divergence.
We have demonstrated a few examples of how you can use our indicator, but we are confident that you will find many more applications in your own strategies.
Oscillator offers a variety of customizable parameters to tailor the indicator to your trading preferences. Here’s what our settings include:
Signal Line
Turn On/Off: Enable or disable the signal line.
Length: Set the length period for the signal line calculation.
Smooth: Adjust the smoothing level of the signal line for more accurate display.
Histogram
Turn On/Off: Enable or disable the histogram.
Length: Set the length period for the histogram calculation.
Smooth: Adjust the smoothing level of the histogram.
Other
Show Divergence Line: Display divergence lines on the chart.
Show Hidden Divergence: Display hidden divergences.
Show Status Line: Show the status line indicating overbought or oversold conditions.
Show TP Signal: Display signals for take profit.
Show Reversal Points: Display potential trend reversal points.
Delete Broken Divergence Lines: Remove broken divergence lines from the chart.
Alerts Customization
Signal Line Bull/Bear: Set alerts for bullish or bearish signals from the signal line.
TP Bull/Bear: Set alerts for take profit signals.
Status Bull/Bear: Set alerts for bullish or bearish status conditions.
Status Bull+/Bear+: Set enhanced alerts for stronger bullish or bearish status conditions.
Divergence Bull/Bear: Set alerts for bullish or bearish divergences.
Hidden Divergence Bull/Bear: Set alerts for hidden bullish or bearish divergences.
With these comprehensive settings, you can fine-tune the Oscillator to perfectly fit your trading strategy and preferences.
Our indicator utilizes technologies such as RSI, Stochastic, and Money Flow Index, with numerous enhancements from our team. It includes exclusive features such as real-time detection of hidden and classic divergences, identification of reversal points using our unique methodology, and much more.
Disclaimer:
While we consider our Turbo Oscillator to be an excellent tool, it is important to understand that past performance is not indicative of future results. We recommend approaching market analysis comprehensively, using a combination of tools and techniques to make well-informed trading decisions. Always consider the full range of market data and risks when using any trading indicator.

Overheat Oscillator with DivergenceIndicator Description
The Overheat Oscillator with Divergence is an advanced technical indicator designed for the TradingView platform, assisting traders in identifying potential market reversal points by analyzing price momentum and volume, as well as detecting divergences. The indicator combines trend strength assessment with signal smoothing to provide clear indications of market overheat or oversold conditions. An optional divergence detection feature allows for the identification of discrepancies between price movement and the oscillator's value, which may signal upcoming trend changes.
The indicator is displayed in a separate panel below the price chart and offers visual cues through a color gradient, horizontal reference lines, and a dynamic market sentiment table. Users can customize numerous parameters, such as calculation periods, sentiment thresholds, line colors, and visualization styles, making the indicator a versatile tool for various trading strategies.
How the Indicator Works
The indicator is based on the following key components:
Oscillator Calculations
The indicator analyzes price candles, assigning a score based on their nature. A bullish candle (when the closing price is higher than the opening price) receives a score of +1.0, while a bearish candle (when the closing price is lower than the opening price) receives a score of -1.0. This scoring reflects the strength of price movement over a given period.
The score is modified by a volume multiplier (default: 2.0) if the candle's volume exceeds the volume's simple moving average (SMA, default: calculated over 20 candles). This ensures that candles with higher volume have a greater impact on the oscillator's value, better capturing significant market movements driven by increased trading activity. For example, a bullish candle with high volume may receive a score of +2.0 instead of +1.0, amplifying the bullish signal.
The scores are summed over a specified number of candles (default: 20), normalized to a 0–100 range, and then smoothed using a simple moving average (SMA, default: 5 periods) to reduce noise and improve signal clarity.
Color Gradient
The oscillator's values are visualized using a color gradient that changes based on the oscillator's level:
Green: Market cooldown (values below the Gradient Min threshold).
Yellow: Neutral sentiment (values between Gradient Min and Gradient Yellow).
Orange: Elevated activity (values between Gradient Yellow and Gradient Orange).
Red: Market overheat (values above Gradient Orange).
The color gradient is applied as the background in the oscillator panel, facilitating quick assessment of market sentiment.
Reference Levels
The indicator displays customizable horizontal lines for key thresholds (e.g., Overheat Threshold, Oversold Threshold, Gradient Min, Yellow, Orange, Max). These lines are visible only at the height of the last few oscillator candles, preventing chart clutter and helping users focus on current values.
Users can also define three custom horizontal lines with selectable styles (solid, dotted, dashed) and colors. These lines serve as auxiliary tools, e.g., for marking personal support/resistance levels, but do not affect the oscillator's signals or background colors.
Market Sentiment
The indicator displays sentiment labels in a table located in the top-right corner of the panel, dynamically updating based on the oscillator's value:
Cooled: Values below Gradient Yellow (default: 35).
Neutral: Values between Gradient Yellow and Gradient Orange (default: 60).
Excited: Values between Gradient Orange and Overheat Threshold (default: 70).
Overheated: Values above Overheat Threshold (default: 70).
The Overheat Threshold and Oversold Threshold are critical for displaying the "Overheated" and "Cooled" labels in the sentiment table, enabling users to quickly identify extreme market conditions. The labels update when key thresholds are crossed, and their colors match the oscillator's gradient.
Divergence Detection
The indicator offers optional detection of regular bullish and bearish divergences:
Bullish Divergence: Occurs when the price forms a lower low, but the oscillator forms a higher low, suggesting a weakening downtrend.
Bearish Divergence: Occurs when the price forms a higher high, but the oscillator forms a lower high, suggesting a weakening uptrend.
Divergences are marked on the chart with labels ("Bull" for bullish, "Bear" for bearish) and lines indicating pivot points. They are calculated with a delay equal to the Lookback Right setting (default: 5 candles), meaning signals appear after pivot confirmation in the specified lookback period. The indicator also generates alerts for users when a divergence is detected.
Indicator Settings
Main Settings (SETTINGS)
Period Length: Specifies the number of candles used for oscillator calculations (default: 20).
Volume SMA Period: The period for the volume's simple moving average (default: 20).
Volume Multiplier: Multiplier applied to candle scores when volume exceeds the average (default: 2.0).
SMA Length: The period for smoothing the oscillator with a simple moving average (default: 5).
Thresholds (THRESHOLDS)
Overheat Threshold: Level indicating market overheat (default: 70). This value determines when the sentiment table displays the "Overheated" label, signaling a potential peak in an uptrend.
Oversold Threshold: Level indicating market cooldown (default: 30). This value determines when the sentiment table displays the "Cooled" label, signaling a potential bottom in a downtrend.
Gradient Min (Green): Lower threshold for the green gradient (default: 20).
Gradient Yellow Threshold: Threshold for the yellow gradient (default: 35).
Gradient Orange Threshold: Threshold for the orange gradient (default: 60).
Gradient Max (Red): Upper threshold for the red gradient (default: 70).
Visualization (VISUALIZATION)
Signal Line Color: Color of the oscillator line (default: dark red, RGB(5, 0, 0)).
Show Reference Lines: Enables/disables the display of threshold lines (default: enabled).
Divergence Settings (DIVERGENCE SETTINGS)
Calculate Divergence: Enables/disables divergence detection (default: disabled).
Lookback Right: Number of candles back for pivot analysis (default: 5).
Lookback Left: Number of candles to the left for pivot analysis (default: 5).
Line Style (STYLE)
Custom Line 1, 2, 3 Value: Levels for custom horizontal lines (default: 70, 50, 30).
Custom Line 1, 2, 3 Color: Colors for custom lines (default: black, RGB(0, 0, 0)).
Custom Line 1, 2, 3 Style: Line styles (solid, dotted, dashed; default: dashed, dotted, dashed).
How to Use the Indicator
Adding to the Chart
Add the indicator to your TradingView chart by searching for "Overheat Oscillator with Divergence."
Configure the settings according to your trading strategy.
Signal Interpretation
Overheated: Values above the Overheat Threshold (default: 70) in the sentiment table may indicate a potential uptrend peak.
Cooled: Values below the Oversold Threshold (default: 30) in the sentiment table may suggest a potential downtrend bottom.
Divergences:
Bullish: Look for "Bull" labels on the chart, indicating potential upward reversals (calculated with a Lookback Right delay).
Bearish: Look for "Bear" labels, indicating potential downward reversals (calculated with a Lookback Right delay).
Customization
Experiment with settings such as period length, volume multiplier, or gradient thresholds to tailor the indicator to your trading style (e.g., scalping, medium-term trading).
Usage Examples
Scalping: Set a shorter period (e.g., Period Length = 10, SMA Length = 3) and monitor rapid sentiment changes and divergences on lower timeframes (e.g., 5-minute charts).
Medium-Term Trading: Use default settings or increase Period Length (e.g., 30) and SMA Length (e.g., 7) for more stable signals on hourly or daily charts.
Reversal Detection: Enable divergence detection and observe "Bull" or "Bear" labels in conjunction with overheat/cooled levels in the sentiment table.
Notes
The indicator performs best when used in conjunction with other technical analysis tools, such as support/resistance lines, moving averages, or Fibonacci levels.
Divergences may serve as early signals but do not always guarantee immediate trend reversals—confirmation with other indicators is recommended.
Test different settings on historical data to find the optimal configuration for your chosen market and timeframe.

RSI Divergence ProjectionRSI Divergence Projection
Go beyond traditional, lagging indicators with this advanced RSI Divergence tool. It not only identifies four types of confirmed RSI divergence but also introduces a unique, forward-looking engine. This engine spots potential divergences as they form on the current candle and then projects the exact price threshold required to validate them.
Our core innovation is the Divergence Projection Line, a clean, clutter-free visualization that extends this calculated price target into the future, providing a clear and actionable level for your trading decisions.
The Core Logic: Understanding RSI Divergence
For those new to the concept, RSI Divergence is a powerful tool used to spot potential market reversals or continuations. It occurs when the price of an asset is moving in the opposite direction of the Relative Strength Index (RSI). This indicator automatically detects and plots four key types:
Regular Bullish Divergence: Price prints a lower low, but the RSI prints a higher low. This often signals that bearish momentum is fading and a potential reversal to the upside is near.
Hidden Bullish Divergence: Price prints a higher low, but the RSI prints a lower low. This is often seen in an uptrend and can signal a continuation of the bullish move.
Regular Bearish Divergence: Price prints a higher high, but the RSI prints a lower high. This suggests that bullish momentum is weakening and a potential reversal to the downside is coming.
Hidden Bearish Divergence: Price prints a lower high, but the RSI prints a higher high. This is often seen in a downtrend and can signal a continuation of the bearish move.
Confirmed divergences are plotted with solid-colored lines on the price chart and marked with a "B" (Bearish/Bullish) or "HB" (Hidden Bearish/Hidden Bullish) label.
The Core Innovation: The Divergence Projection
This is where the indicator truly shines and sets itself apart. Instead of waiting for a pivot point to be confirmed, our engine analyzes the current, unclosed candle.
Potential Divergence Detection: When the indicator notices that the current price and RSI are setting up for a potential divergence against the last confirmed pivot, it will draw a dashed line on the chart. This gives you a critical head-start before the signal is confirmed.
The Projection Line (Our Innovation): This is the game-changer. Rather than cluttering your chart with messy labels, the indicator calculates the exact closing price the next candle needs to achieve to make the current RSI level equal to the RSI of the last pivot.
It then projects a clean, horizontal dashed line at this price level into the future.
Attached to the end of this line is a single, consolidated label that tells you the type of potential divergence and the exact threshold price.
This unique visualization transforms a vague concept into a precise, actionable price target, completely free of chart clutter.
How to Use This Indicator
1. Trading Confirmed Divergences:
Look for the solid lines and the "B" or "HB" labels that appear after a candle has closed and a pivot is confirmed.
A Regular Bullish divergence can be an entry signal for a long position, often placed after the confirmation candle closes.
A Regular Bearish divergence can be an entry signal for a short position.
Hidden Divergences can be used as confirmation to stay in a trade or to enter a trade in the direction of the prevailing trend.
2. Using the Divergence Projection for a Tactical Advantage:
When a dashed line appears on the current price action, you are seeing a potential divergence in real-time.
Look to the right of the current candle for the Projection Line. The price level of this line is your key level to watch.
Example (Potential Bullish Divergence): You see a dashed green line forming from a previous low to the current lower low. To the right, you see a horizontal line projected with a label: "Potential Bull Div | Thresh: 10,750.50".
Interpretation: This means that if the next candle closes below 10,750.50, the RSI will not be high enough to form a divergence. However, if the price pushes up and the next candle closes above 10,750.50, the bullish divergence remains intact and is more likely to be confirmed. This gives you a concrete price level to monitor for entry or exit decisions.
How the Projection Engine Works: A Deeper Dive
To fully trust this tool, it's helpful to understand the logic behind it. The projection engine is not based on guesswork or repainting; it's based on a precise mathematical reverse-engineering of the RSI formula.
The Concept: The engine calculates the "tipping point." The Threshold Price is the exact closing price at which the new RSI value would be identical to the RSI value of the previous pivot point. It answers the question: "For this potential divergence to remain valid, where does the next candle need to close?"
The Technicals: The script takes the target RSI from the last pivot, reverse-engineers the formula to find the required average gain/loss ratio, and then solves for the one unknown variable: the gain or loss needed on the next candle. This required price change is then added to or subtracted from the previous close to determine the exact threshold price.
This calculation provides the precise closing price needed to hit our target, which is then plotted as the clean and simple Projection Line on your chart.
Features and Customization
- RSI Settings: Adjust the RSI period and source.
- Divergence Detection: Fine-tune the pivot lookback periods and the min/max range for detecting divergences.
- Price Source: Choose whether to detect divergences using candle Wicks or Bodies.
- Display Toggles: Enable or disable any of the four divergence types, as well as the entire projection engine, to keep your chart as clean as you need it.
Summary of Advantages
- Proactive Signals: Get ahead of the market by seeing potential divergences before they are confirmed.
- Unprecedented Clarity: Our unique Projection Line eliminates chart clutter from overlapping labels.
- Actionable Data: The threshold price provides a specific, objective level to watch, removing guesswork.
- Fully Customizable: Tailor the indicator's settings to match any timeframe or trading strategy.
- All-in-One Tool: No need for a separate RSI indicator; everything you need is displayed directly and cleanly on the price action.
We hope this tool empowers you to make more informed and timely trading decisions. Happy trading

Dual Volume Divergence LineDual Volume Divergence Line (DVD/Line)
🔹 Overview
The Dual Volume Divergence Line (DVD/Line) is a custom Pine Script™ indicator designed to identify potential trend reversals and continuations by analyzing volume and price divergences. This script is inspired by the original concept of the Dual Volume Divergence Index (DVDI) by DonovanWall and has been modified and enhanced by keremertem. Special thanks to DonovanWall for the original concept. The indicator combines volume-based calculations with price action to generate signals for bullish and bearish divergences, both normal and hidden. Below is a detailed breakdown of its components and functionality.
🔹 Key Features of the DVD/Line Indicator
1. Dual Volume Divergence Calculation:
- The indicator calculates two primary volume-based indices: the Positive Volume Index (PVI) and the Negative Volume Index (NVI).
- PVI measures the impact of volume on price when the price increases, while NVI measures the impact when the price decreases.
- These indices are used to detect divergences between volume and price, which can signal potential reversals or continuations.
2. Customizable Inputs:
- DVD Sampling Period: Adjusts the sensitivity of the indicator by controlling the lookback period for calculating the volume-weighted moving averages (VWMA) of PVI and NVI.
- Band Width: Defines the range for calculating the upper and lower bands, which act as dynamic support and resistance levels.
- Source: Allows users to select the price source (e.g., `hlc3`, `close`, etc.) for calculations.
3. Volume-Weighted Moving Averages (VWMA):
- Instead of using traditional moving averages, the script employs VWMA to smooth the PVI and NVI signals. This ensures that the indicator is more responsive to changes in volume.
4. Upper and Lower Bands:
- The upper and lower bands are calculated using the Root Mean Square (RMS) of the highest and lowest values of the DVD line over a user-defined period. These bands help identify overbought and oversold conditions.
5. Divergence Detection:
- The script identifies four types of divergences:
- Normal Bullish Divergence: Occurs when price makes a lower low, but the DVD line makes a higher low.
- Hidden Bullish Divergence: Occurs when price makes a higher low, but the DVD line makes a lower low.
- Normal Bearish Divergence: Occurs when price makes a higher high, but the DVD line makes a lower high.
- Hidden Bearish Divergence: Occurs when price makes a lower high, but the DVD line makes a higher high.
- These divergences are visually highlighted on the chart using labels.
6. Customizable Divergence Selection:
- Users can choose between two types of divergence calculations:
- DVDI: Based on the raw divergence values.
- DVD Line: Based on the smoothed DVD line.
7. Visual Enhancements:
- The DVD line is plotted with a color-coded scheme: blue when the DVD line is above its signal line (bullish) and pink when it is below (bearish).
- The upper and lower bands are displayed as step lines, making it easier to identify key levels.
🔹 How the Indicator Works
1. Volume-Based Calculations:
- The script starts by calculating the PVI and NVI based on the selected price source and volume data.
- PVI increases when the price rises, while NVI decreases when the price falls. These indices are then smoothed using VWMA to generate signals.
2. DVD Line Calculation:
- The DVD line is derived by combining the divergences of PVI and NVI. It is further smoothed using a Weighted Moving Average (WMA) and a linear regression line for trend analysis.
3. Divergence Detection:
- The script identifies pivot points in the DVD line and compares them with price action to detect divergences.
- Normal divergences indicate potential reversals, while hidden divergences suggest trend continuations.
4. Dynamic Bands:
- The upper and lower bands are calculated using RMS, which provides a more accurate representation of volatility compared to standard deviation or fixed-width bands.
5. Labeling:
- Divergences are labeled directly on the chart with clear text and color coding:
🟢 Bullish Divergence: Green label with "Bull".
🟩 Bearish Divergence: Red label with "Bear".
🔴 Hidden Bullish Divergence: Lime label with "hid.".
🟧 Hidden Bearish Divergence: Orange label with "hid.".
🔹 Unique Aspects of This Script
1. Volume-Weighted Smoothing:
- Unlike traditional divergence indicators that rely on simple moving averages, this script uses VWMA and WMA to ensure that volume plays a significant role in signal generation.
2. Dynamic Bands with RMS:
- The use of RMS for calculating bands provides a more adaptive and accurate representation of market conditions, especially in volatile markets.
3. Flexible Divergence Selection:
- Users can choose between raw divergence values (DVDI) or smoothed values (DVD Line), allowing for greater customization based on trading style.
4. Comprehensive Divergence Detection:
- The script detects both normal and hidden divergences, providing a complete picture of potential trend reversals and continuations.
5. User-Friendly Visuals:
- The color-coded DVD line and cross-style bands make it easy to interpret the indicator at a glance.
🔹 How to Use the Indicator
1. Trend Identification:
- Use the Middle Band and its color to identify the current trend. A green line suggests bullish momentum, while a red line indicates bearish momentum. Additionally, a bullish momentum may be indicated when the DVD line crosses up, and a bearish momentum may be indicated when it crosses down the Middle Band.
2. Divergence Trading:
- Look for divergences between the DVD line and price action. Normal divergences can be used for counter-trend trades, while hidden divergences can confirm trend continuations.
3. Band Breakouts:
- Monitor the upper and lower bands for potential breakout or reversal signals. A break above the upper band may indicate overbought conditions, while a break below the lower band may suggest oversold conditions.
4. Customization:
- Adjust the sampling period and band width to suit different timeframes and trading strategies. Shorter periods are more sensitive, while longer periods provide smoother signals.
🔹 Conclusion
The Dual Volume Divergence Line (DVD/Line) is a powerful and versatile indicator that combines volume analysis with price action to generate actionable trading signals. Its unique use of volume-weighted smoothing, dynamic bands, and comprehensive divergence detection sets it apart from traditional divergence indicators. Whether you're a day trader or a long-term investor, this tool can help you identify high-probability trading opportunities with greater accuracy and confidence.
📌 Disclaimer: This script is for educational purposes only and does not constitute financial advice. Always conduct your own analysis before making trading decisions.

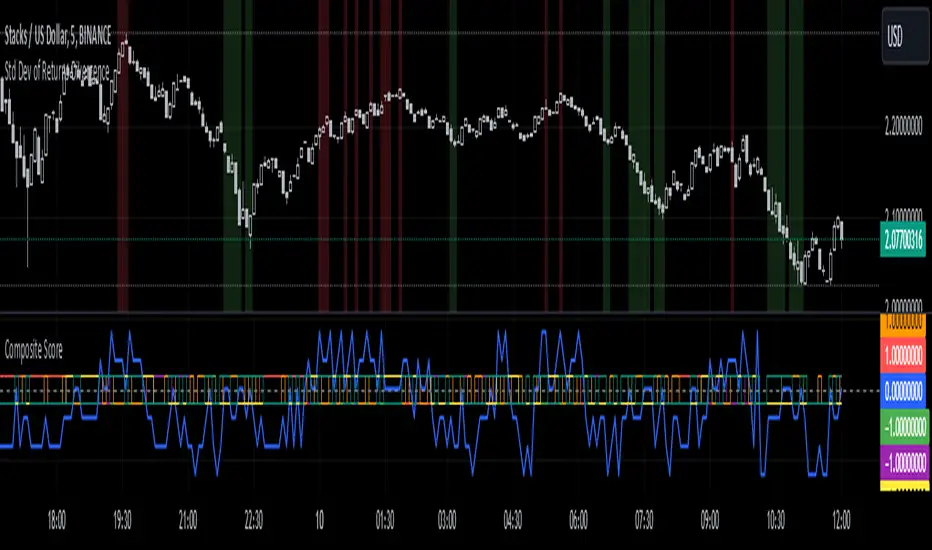
Standard Deviation of Returns: DivergencePurpose:
The "Standard Deviation of Returns: Divergence" indicator is designed to help traders identify potential trend reversals or continuation signals by analyzing divergences between price action and the statistical volatility of returns. Divergences can signal weakening momentum in the prevailing trend, offering insight into potential buying or selling opportunities.
Key Components
1. Returns Calculation:
* The indicator uses logarithmic returns (log(close / close )) to measure relative price changes in a normalized manner.
* Log returns are more effective than simple price differences when analyzing data across varying price levels, as they account for percentage-based changes.
2. Standard Deviation of Returns:
* The script computes the standard deviation of returns over a user-defined lookback period (ta.stdev(returns, lookback)).
* Standard deviation measures the dispersion of returns around their average, effectively quantifying market volatility.
* A higher standard deviation indicates increased volatility, while lower standard deviation reflects a calmer market.
3. Price Action:
* Detects higher highs (new peaks in price) and lower lows (new troughs in price) over the lookback period.
* Price trends are compared to the behavior of the standard deviation.
4. Divergence Detection:
A divergence occurs when price action (higher highs or lower lows) is not confirmed by a corresponding movement in standard deviation:
Bullish Divergence: Price makes a lower low, but the standard deviation does not, signaling potential upward momentum.
Bearish Divergence: Price makes a higher high, but the standard deviation does not, signaling potential downward momentum.
5. Visual Cues:
The script highlights divergence regions directly on the chart:
Green Background: Indicates a bullish divergence (potential buy signal).
Red Background: Indicates a bearish divergence (potential sell signal).
How It Works
Inputs:
* The user specifies the lookback period (lookback) for calculating the standard deviation and detecting divergences.
Calculation:
* Each bar’s returns are computed and used to calculate the standard deviation over the specified lookback period.
* The indicator evaluates price highs/lows and compares these with the highest and lowest values of the standard deviation within the same lookback period.
Highlight of Divergences:
When divergences are detected:
Bullish Divergence: The background of the chart is shaded green.
Bearish Divergence: The background of the chart is shaded red.
Trading Application
Bullish Divergence:
* Occurs when the market is oversold, or downward momentum is weakening.
* Suggests a potential reversal to an uptrend, signaling a buying opportunity.
Bearish Divergence:
* Occurs when the market is overbought, or upward momentum is weakening.
* Suggests a potential reversal to a downtrend, signaling a selling opportunity.
Contextual Use:
* Use this indicator in conjunction with other technical tools like RSI, MACD, or moving averages to confirm signals.
* Effective in volatile or ranging markets to help anticipate shifts in momentum.
Summary
The "Standard Deviation of Returns: Divergence" indicator is a robust tool for spotting divergences that can signal weakening market trends. It combines statistical volatility with price action analysis to highlight key areas of potential reversals. By integrating this tool into your trading strategy, you can gain additional confirmation for entries or exits while keeping a close watch on momentum shifts.
Disclaimer: This is not a financial advise; please consult your financial advisor for personalized advice.
RSI Trendlines and Divergences█OVERVIEW
The "RSI Trendlines and Divergences" indicator is an advanced technical analysis tool that leverages the Relative Strength Index (RSI) to draw trendlines and detect divergences. Designed for traders seeking precise market signals, the indicator identifies key pivot points on the RSI chart, draws trendlines between pivots, and detects bullish and bearish divergences. It offers flexible settings, background coloring for breakout signals, and divergence labels, supported by alerts for key events. The indicator is universal and works across all markets (stocks, forex, cryptocurrencies) and timeframes.
█CONCEPTS
The indicator was developed to provide an alternative signal source for the RSI oscillator. Trendline breakouts and bounces off trendlines offer a broader perspective on potential price behavior. Combining these with traditional RSI signal interpretation can serve as a foundation for creating various trading strategies.
█FEATURES
- RSI and Pivot Calculation: Calculates RSI based on the selected source price (default: close) with a customizable period (default: 14). Identifies pivot points on RSI and price for trendlines and divergences.
- RSI Trendlines: Draws trendlines connecting RSI pivots (upper for downtrends, lower for uptrends) with optional extension (default: 30 bars). The trendline appears and generates a signal only after the first RSI crossover. Lines are colored (red for upper, green for lower).
- Trendline Fill: Widens the trendline with a tolerance margin expressed in RSI points, reducing signal noise and visually highlighting trend zones. Breaking this zone is a condition for generating signals, minimizing false signals. The tolerance margin can be increased or decreased.
- Divergence Detection: Identifies bullish and bearish divergences based on RSI and price pivots, displaying labels (“Bull” for bullish, “Bear” for bearish) with adjustable transparency. Divergence labels appear with a delay equal to the specified pivot length (default: 5). Higher values yield stronger signals but with greater delay.
- Breakout Signals: Generates signals when RSI crosses the trendline (bullish for upper lines, bearish for lower lines), with background coloring for signal confirmation.
- Alerts: Built-in alerts for:
Detection of bullish and bearish divergences.
Upper trendline crossover (bullish signal).
Lower trendline crossover (bearish signal).
- Customization: Allows adjustment of RSI length, pivot settings, line colors, fills, labels, and transparency of signals and background.
█HOW TO USE
Add the indicator to your TradingView chart via the Pine Editor or Indicators menu.
Configuring Settings.
RSI Settings
- RSI Length: Period for RSI calculation (default: 14).
- SMA Length: Period for RSI moving average (default: 9).
- Source: Source price for RSI (default: close).
Pivot Settings for Trend
- Left Bars for Pivot: Number of bars back for detecting pivots (default: 10).
- Right Bars for Pivot: Number of bars forward for confirming pivots (default: 10).
- Extension after Second Pivot: Number of bars to extend the trendline (default: 30, 0 = none). Extension increases the number of signals, while shortening reduces them.
- Tolerance: Deviation in RSI points to widen the breakout margin, reducing signal noise (default: 3.0).
Divergence Settings
- Enable Divergence Detection: Enables/disables divergence detection (default: enabled).
- Pivot Length for Divergence: Pivot period for divergences (default: 5).
Style Settings
- Upper Trendline Color: Color for downtrend lines (default: red).
- Upper Fill Color: Fill color for upper lines (default: red, transparency 70).
- Lower Trendline Color: Color for uptrend lines (default: green).
- Lower Fill Color: Fill color for lower lines (default: green, transparency 70).
- SMA Color: Color for RSI moving average (default: yellow).
- Bullish Divergence Color: Color for bullish labels (default: green).
- Bearish Divergence Color: Color for bearish labels (default: red).
- Text Color: Color for label text (default: white).
- Divergence Label Transparency: Transparency of labels (0-100, default: 40).
- Signal Background Transparency: Transparency of breakout signal background (0-100, default: 80).
Interpreting Signals
- Trendlines: Upper lines (red) indicate RSI downtrends, lower lines (green) indicate uptrends. The trendline appears and generates a signal only after the first RSI crossover. Trendline breakouts suggest potential trend reversals.
- Divergences: “Bull” labels indicate bullish divergence (potential rise), “Bear” labels indicate bearish divergence (potential decline), with a delay based on pivot length (default: 5). Divergences serve as confirmation or warning of trend reversal, not as standalone signals.
- Signal Background: Green background signals bullish breakouts, red background signals bearish breakouts.
- RSI Levels: Horizontal lines at 70 (overbought), 50 (midline), and 30 (oversold) help assess market zones.
- Alerts: Set up alerts in TradingView for divergences or trendline breakouts.
Combining with Other Tools: Use with support/resistance levels, Fibonacci levels, or other indicators for signal confirmation.
█APPLICATIONS
The "RSI Trendlines and Divergence" indicator is designed to identify trends and potential reversal points, supporting both trend-following and reversal strategies:
- Trend Confirmation: Trendlines indicate the RSI trend direction, with breakouts signaling potential reversals. The indicator is functional in traditional RSI usage, allowing classic RSI interpretation (e.g., returning from overbought/oversold zones). Combining trendline breakouts with RSI signal levels, such as a return from overbought or oversold zones paired with a trendline breakout, strengthens the signal.
- Divergence Detection: Divergences serve as confirmation or warning of trend reversal, not as standalone signals.
█NOTES
- Adjust settings (e.g., RSI length, pivots, tolerance) to suit your trading style and timeframe.
- Combine with other technical analysis tools to enhance signal accuracy.

Ergodic Market Divergence (EMD)Ergodic Market Divergence (EMD)
Bridging Statistical Physics and Market Dynamics Through Ensemble Analysis
The Revolutionary Concept: When Physics Meets Trading
After months of research into ergodic theory—a fundamental principle in statistical mechanics—I've developed a trading system that identifies when markets transition between predictable and unpredictable states. This indicator doesn't just follow price; it analyzes whether current market behavior will persist or revert, giving traders a scientific edge in timing entries and exits.
The Core Innovation: Ergodic Theory Applied to Markets
What Makes Markets Ergodic or Non-Ergodic?
In statistical physics, ergodicity determines whether a system's future resembles its past. Applied to trading:
Ergodic Markets (Mean-Reverting)
- Time averages equal ensemble averages
- Historical patterns repeat reliably
- Price oscillates around equilibrium
- Traditional indicators work well
Non-Ergodic Markets (Trending)
- Path dependency dominates
- History doesn't predict future
- Price creates new equilibrium levels
- Momentum strategies excel
The Mathematical Framework
The Ergodic Score combines three critical divergences:
Ergodic Score = (Price Divergence × Market Stress + Return Divergence × 1000 + Volatility Divergence × 50) / 3
Where:
Price Divergence: How far current price deviates from market consensus
Return Divergence: Momentum differential between instrument and market
Volatility Divergence: Volatility regime misalignment
Market Stress: Adaptive multiplier based on current conditions
The Ensemble Analysis Revolution
Beyond Single-Instrument Analysis
Traditional indicators analyze one chart in isolation. EMD monitors multiple correlated markets simultaneously (SPY, QQQ, IWM, DIA) to detect systemic regime changes. This ensemble approach:
Reveals Hidden Divergences: Individual stocks may diverge from market consensus before major moves
Filters False Signals: Requires broader market confirmation
Identifies Regime Shifts: Detects when entire market structure changes
Provides Context: Shows if moves are isolated or systemic
Dynamic Threshold Adaptation
Unlike fixed-threshold systems, EMD's boundaries evolve with market conditions:
Base Threshold = SMA(Ergodic Score, Lookback × 3)
Adaptive Component = StDev(Ergodic Score, Lookback × 2) × Sensitivity
Final Threshold = Smoothed(Base + Adaptive)
This creates context-aware signals that remain effective across different market environments.
The Confidence Engine: Know Your Signal Quality
Multi-Factor Confidence Scoring
Every signal receives a confidence score based on:
Signal Clarity (0-35%): How decisively the ergodic threshold is crossed
Momentum Strength (0-25%): Rate of ergodic change
Volatility Alignment (0-20%): Whether volatility supports the signal
Market Quality (0-20%): Price convergence and path dependency factors
Real-Time Confidence Updates
The Live Confidence metric continuously updates, showing:
- Current opportunity quality
- Market state clarity
- Historical performance influence
- Signal recency boost
- Visual Intelligence System
Adaptive Ergodic Field Bands
Dynamic bands that expand and contract based on market state:
Primary Color: Ergodic state (mean-reverting)
Danger Color: Non-ergodic state (trending)
Band Width: Expected price movement range
Squeeze Indicators: Volatility compression warnings
Quantum Wave Ribbons
Triple EMA system (8, 21, 55) revealing market flow:
Compressed Ribbons: Consolidation imminent
Expanding Ribbons: Directional move developing
Color Coding: Matches current ergodic state
Phase Transition Signals
Clear entry/exit markers at regime changes:
Bull Signals: Ergodic restoration (mean reversion opportunity)
Bear Signals: Ergodic break (trend following opportunity)
Confidence Labels: Percentage showing signal quality
Visual Intensity: Stronger signals = deeper colors
Professional Dashboard Suite
Main Analytics Panel (Top Right)
Market State Monitor
- Current regime (Ergodic/Non-Ergodic)
- Ergodic score with threshold
- Path dependency strength
- Quantum coherence percentage
Divergence Metrics
- Price divergence with severity
- Volatility regime classification
- Strategy mode recommendation
- Signal strength indicator
Live Intelligence
- Real-time confidence score
- Color-coded risk levels
- Dynamic strategy suggestions
Performance Tracking (Left Panel)
Signal Analytics
- Total historical signals
- Win rate with W/L breakdown
- Current streak tracking
- Closed trade counter
Regime Analysis
- Current market behavior
- Bars since last signal
- Recommended actions
- Average confidence trends
Strategy Command Center (Bottom Right)
Adaptive Recommendations
- Active strategy mode
- Primary approach (mean reversion/momentum)
- Suggested indicators ("weapons")
- Entry/exit methodology
- Risk management guidance
- Comprehensive Input Guide
Core Algorithm Parameters
Analysis Period (10-100 bars)
Scalping (10-15): Ultra-responsive, more signals, higher noise
Day Trading (20-30): Balanced sensitivity and stability
Swing Trading (40-100): Smooth signals, major moves only Default: 20 - optimal for most timeframes
Divergence Threshold (0.5-5.0)
Hair Trigger (0.5-1.0): Catches every wiggle, many false signals
Balanced (1.5-2.5): Good signal-to-noise ratio
Conservative (3.0-5.0): Only extreme divergences Default: 1.5 - best risk/reward balance
Path Memory (20-200 bars)
Short Memory (20-50): Recent behavior focus, quick adaptation
Medium Memory (50-100): Balanced historical context
Long Memory (100-200): Emphasizes established patterns Default: 50 - captures sufficient history without lag
Signal Spacing (5-50 bars)
Aggressive (5-10): Allows rapid-fire signals
Normal (15-25): Prevents clustering, maintains flow
Conservative (30-50): Major setups only Default: 15 - optimal trade frequency
Ensemble Configuration
Select markets for consensus analysis:
SPY: Broad market sentiment
QQQ: Technology leadership
IWM: Small-cap risk appetite
DIA: Blue-chip stability
More instruments = stronger consensus but potentially diluted signals
Visual Customization
Color Themes (6 professional options):
Quantum: Cyan/Pink - Modern trading aesthetic
Matrix: Green/Red - Classic terminal look
Heat: Blue/Red - Temperature metaphor
Neon: Cyan/Magenta - High contrast
Ocean: Turquoise/Coral - Calming palette
Sunset: Red-orange/Teal - Warm gradients
Display Controls:
- Toggle each visual component
- Adjust transparency levels
- Scale dashboard text
- Show/hide confidence scores
- Trading Strategies by Market State
- Ergodic State Strategy (Primary Color Bands)
Market Characteristics
- Price oscillates predictably
- Support/resistance hold
- Volume patterns repeat
- Mean reversion dominates
Optimal Approach
Entry: Fade moves at band extremes
Target: Middle band (equilibrium)
Stop: Just beyond outer bands
Size: Full confidence-based position
Recommended Tools
- RSI for oversold/overbought
- Bollinger Bands for extremes
- Volume profile for levels
- Non-Ergodic State Strategy (Danger Color Bands)
Market Characteristics
- Price trends persistently
- Levels break decisively
- Volume confirms direction
- Momentum accelerates
Optimal Approach
Entry: Breakout from bands
Target: Trail with expanding bands
Stop: Inside opposite band
Size: Scale in with trend
Recommended Tools
- Moving average alignment
- ADX for trend strength
- MACD for momentum
- Advanced Features Explained
Quantum Coherence Metric
Measures phase alignment between individual and ensemble behavior:
80-100%: Perfect sync - strong mean reversion setup
50-80%: Moderate alignment - mixed signals
0-50%: Decoherence - trending behavior likely
Path Dependency Analysis
Quantifies how much history influences current price:
Low (<30%): Technical patterns reliable
Medium (30-50%): Mixed influences
High (>50%): Fundamental shift occurring
Volatility Regime Classification
Contextualizes current volatility:
Normal: Standard strategies apply
Elevated: Widen stops, reduce size
Extreme: Defensive mode required
Signal Strength Indicator
Real-time opportunity quality:
- Distance from threshold
- Momentum acceleration
- Cross-validation factors
Risk Management Framework
Position Sizing by Confidence
90%+ confidence = 100% position size
70-90% confidence = 75% position size
50-70% confidence = 50% position size
<50% confidence = 25% or skip
Dynamic Stop Placement
Ergodic State: ATR × 1.0 from entry
Non-Ergodic State: ATR × 2.0 from entry
Volatility Adjustment: Multiply by current regime
Multi-Timeframe Alignment
- Check higher timeframe regime
- Confirm ensemble consensus
- Verify volume participation
- Align with major levels
What Makes EMD Unique
Original Contributions
First Ergodic Theory Trading Application: Transforms abstract physics into practical signals
Ensemble Market Analysis: Revolutionary multi-market divergence system
Adaptive Confidence Engine: Institutional-grade signal quality metrics
Quantum Coherence: Novel market alignment measurement
Smart Signal Management: Prevents clustering while maintaining responsiveness
Technical Innovations
Dynamic Threshold Adaptation: Self-adjusting sensitivity
Path Memory Integration: Historical dependency weighting
Stress-Adjusted Scoring: Market condition normalization
Real-Time Performance Tracking: Built-in strategy analytics
Optimization Guidelines
By Timeframe
Scalping (1-5 min)
Period: 10-15
Threshold: 0.5-1.0
Memory: 20-30
Spacing: 5-10
Day Trading (5-60 min)
Period: 20-30
Threshold: 1.5-2.5
Memory: 40-60
Spacing: 15-20
Swing Trading (1H-1D)
Period: 40-60
Threshold: 2.0-3.0
Memory: 80-120
Spacing: 25-35
Position Trading (1D-1W)
Period: 60-100
Threshold: 3.0-5.0
Memory: 100-200
Spacing: 40-50
By Market Condition
Trending Markets
- Increase threshold
- Extend memory
- Focus on breaks
Ranging Markets
- Decrease threshold
- Shorten memory
- Focus on restores
Volatile Markets
- Increase spacing
- Raise confidence requirement
- Reduce position size
- Integration with Other Analysis
- Complementary Indicators
For Ergodic States
- RSI divergences
- Bollinger Band squeezes
- Volume profile nodes
- Support/resistance levels
For Non-Ergodic States
- Moving average ribbons
- Trend strength indicators
- Momentum oscillators
- Breakout patterns
- Fundamental Alignment
- Check economic calendar
- Monitor sector rotation
- Consider market themes
- Evaluate risk sentiment
Troubleshooting Guide
Too Many Signals:
- Increase threshold
- Extend signal spacing
- Raise confidence minimum
Missing Opportunities
- Decrease threshold
- Reduce signal spacing
- Check ensemble settings
Poor Win Rate
- Verify timeframe alignment
- Confirm volume participation
- Review risk management
Disclaimer
This indicator is for educational and informational purposes only. It does not constitute financial advice. Trading involves substantial risk of loss and is not suitable for all investors. Past performance does not guarantee future results.
The ergodic framework provides unique market insights but cannot predict future price movements with certainty. Always use proper risk management, conduct your own analysis, and never risk more than you can afford to lose.
This tool should complement, not replace, comprehensive trading strategies and sound judgment. Markets remain inherently unpredictable despite advanced analysis techniques.
Transform market chaos into trading clarity with Ergodic Market Divergence.
Created with passion for the TradingView community
Trade with insight. Trade with anticipation.
— Dskyz , for DAFE Trading Systems

Chaikin DivergenceOverview
The Chaikin Divergence is a powerful technical indicator designed to enhance the traditional Chaikin Oscillator by incorporating divergence detection between the oscillator and price action. This advanced tool not only plots the Chaikin Oscillator but also identifies and highlights bullish and bearish divergences, providing traders with valuable insights into potential trend reversals and momentum shifts.
Key Features
Chaikin Oscillator Plotting: Visual representation of the Chaikin Oscillator, aiding in the analysis of market momentum based on volume and price.
Divergence Detection:
Bullish Divergence: Indicates potential upward reversals when price forms lower lows while the oscillator forms higher lows.
Bearish Divergence: Signals possible downward reversals when price creates higher highs while the oscillator forms lower highs.
Customizable Settings:
Fast Length & Slow Length: Adjust the periods for the Exponential Moving Averages (EMA) used in the oscillator calculation.
Pivot Detection Parameters: Define the sensitivity of pivot high and pivot low detection with adjustable left and right bars.
Bars Lookback for Divergence: Set the number of bars to look back for identifying divergences.
Color Customization: Choose distinct colors for bullish and bearish divergence labels to match your trading preferences.
Visual Indicators:
Divergence Labels: Clear and distinct labels (arrows or dots) on the chart indicating the type and location of divergences.
Zero Line: A dashed zero line to reference the oscillator’s crossing points.
Chaikin Oscillator Calculation:
The indicator calculates the Chaikin Oscillator by subtracting the slow EMA of the Accumulation/Distribution Line (ta.accdist) from the fast EMA.
This oscillates around the zero line, indicating buying and selling pressure.
Pivot Detection:
Utilizes ta.pivothigh and ta.pivotlow functions to identify significant pivot points in price action. These pivot points serve as reference points for divergence analysis.
Divergence Identification:
Bullish Divergence: Detected when a recent pivot low in price is lower than the previous pivot low, while the corresponding oscillator value is higher than the previous oscillator pivot.
Bearish Divergence: Identified when a recent pivot high in price is higher than the previous pivot high, but the oscillator value is lower than the previous oscillator pivot.
Label Plotting:
When a divergence is detected, the indicator plots a label (arrow or dot) on the chart at the pivot point, signaling the type of divergence.
Adding the Indicator:
Open TradingView and navigate to the chart where you want to apply the indicator.
Open the Pine Editor, paste the Chaikin Oscillator with Divergences script, and add it to your chart.
Configuring Settings:
Fast Length & Slow Length: Adjust these to modify the sensitivity of the Chaikin Oscillator. Shorter periods make the oscillator more responsive to price changes.
Left Bars for Pivots & Right Bars for Pivots: Define how many bars to the left and right are considered when identifying pivot points. Increasing these values makes pivot detection less sensitive.
Bars Lookback for Divergence: Set how far back the indicator should search for previous pivot points when identifying divergences. A higher value allows detection over a longer timeframe.
Bullish/Bearish Divergence Colors: Choose colors that stand out against your chart background for easy identification of divergence signals.
Interpreting Signals:
Bullish Divergence Labels: Appear when there's a potential upward reversal, signaling a possible buying opportunity.
Bearish Divergence Labels: Show up when a downward reversal might be imminent, indicating a possible selling opportunity.
Oscillator Crosses Zero: Pay attention to when the oscillator crosses the zero line, as this can also signal changes in momentum.
Combining with Other Indicators:
For enhanced trading strategies, combine divergence signals with other technical indicators or chart patterns to confirm potential trade setups.

hidden & regular rsi divergenceThis is a divergence indicator that draws regular and hidden divergences based on the Zigzag indicator and RSI indicator. There are two degrees of Zigzag. So, in each Zigzag degree, there are two types of regular divergences and one type of hidden divergence.
👉(The logic is written in case of a bearish regular divergence. The opposite will apply for a bullish one.)
Type 1 of regular divergence (Logic 1):
Zigzag has to form a higher high. The highest RSI within both Zigzag legs must form lower highs, but the RSI values which are exactly at the Zigzag highs should not form lower highs.
Type 2 of regular divergence (Logic 2):
Zigzag has to form a higher high. The highest RSI within both Zigzag legs must form lower highs, and the RSI values which are exactly at the Zigzag highs should form lower highs.
👉(The logic is written in case of a bearish hidden divergence. The opposite will apply for a bullish one.)
Zigzag has to form a lower high. The highest RSI within both Zigzag legs must form higher highs.
👉There is also a filter that will be applied to all the divergences. It only shows the divergences whose corresponding RSI value was above/below a level (overbought level/oversold level).
Logic for regular divergences:
Bearish regular divergence's first high's (leftmost) RSI value should be greater than or equal to 70.
Bullish regular divergence's first low's (leftmost) RSI value should be less than or equal to 30.
Logic for hidden divergences:
Bearish hidden divergence's second high's (rightmost) RSI value should be greater than or equal to 70.
Bullish hidden divergence's second low's (rightmost) RSI value should be less than or equal to 30.
👉There is another feature also. This indicator colors the background based on whether the RSI is in a bullish or bearish range.
If it's within 80-60, the background will be colored green (this means that RSI is in a bullish range).
If it's within 40-20, the background will be colored red (this means that RSI is in a bearish range).
Adaptive Cycle Oscillator with EMADescription of the Adaptive Cycle Oscillator with EMA Pine Script
This Pine Script, titled "Adaptive Cycle Oscillator with EMA", is a custom technical indicator designed for TradingView to help traders analyze market cycles and identify potential buy or sell opportunities. It combines an Adaptive Cycle Oscillator (ACO) with multiple Exponential Moving Averages (EMAs), displayed as colorful, wavy lines, and includes features like buy/sell signals and divergence detection. Below is a beginner-friendly explanation of how the script works, adhering to TradingView's Script Publishing Rules.
What This Indicator Does
The Adaptive Cycle Oscillator with EMA helps you:
Visualize market cycles using an oscillator that adapts to price movements.
Track trends with seven EMAs of different lengths, plotted as a rainbow of wavy lines.
Identify potential buy or sell signals when the oscillator crosses predefined thresholds.
Spot divergences between the oscillator and price to anticipate reversals.
Use customizable settings to adjust the indicator to your trading style.
Note: This is a technical analysis tool and does not guarantee profits. Always combine it with other analysis methods and practice risk management.
Step-by-Step Explanation for New Users
1. Understanding the Indicator
Adaptive Cycle Oscillator (ACO): The ACO analyzes price data (based on high, low, and close prices, or HLC3) to detect market cycles. It smooths price movements to create an oscillator that swings between overbought and oversold levels.
EMAs: Seven EMAs of different lengths are applied to the ACO and scaled based on the market's dominant cycle. These EMAs are plotted as colorful, wavy lines to show trend direction.
Buy/Sell Signals: The script generates signals when the ACO crosses above or below user-defined thresholds, indicating potential entry or exit points.
Divergence Detection: The script identifies bullish or bearish divergences between the ACO and the fastest EMA, which may signal potential reversals.
Visual Style: The indicator uses a rainbow of seven colors (red, orange, yellow, green, blue, indigo, violet) for the EMAs, with wavy lines for a unique visual effect. Static levels (zero, overbought, oversold) are also wavy for consistency.
2. How to Add the Indicator to Your Chart
Open TradingView and load the chart of any asset (e.g., stock, forex, crypto).
Click on the Indicators button at the top of the chart.
Search for "Adaptive Cycle Oscillator with EMA" (or paste the script into TradingView’s Pine Editor if you have access to it).
Click to add the indicator to your chart. It will appear in a separate panel below the price chart.
3. Customizing the Indicator
The script offers several input options to tailor it to your needs:
Base Cycle Length (Default: 20): Sets the initial period for calculating the dominant cycle. Higher values make the indicator slower; lower values make it more sensitive.
Alpha Smoothing (Default: 0.07): Controls how much the ACO smooths price data. Smaller values produce smoother results.
Show Buy/Sell Signals (Default: True): Toggle to display green triangles (buy) and red triangles (sell) on the chart.
Threshold (Default: 0.0): Defines overbought (above threshold) and oversold (below threshold) levels. Adjust to widen or narrow signal zones.
EMA Base Length (Default: 10): Sets the starting length for the fastest EMA. Other EMAs are incrementally longer (12, 14, 16, etc.).
Divergence Lookback (Default: 14): Determines how far back the script looks to detect divergences.
To adjust these:
Right-click the indicator on your chart and select Settings.
Modify the inputs in the pop-up window.
Click OK to apply changes.
4. Reading the Indicator
Oscillator and EMAs: The ACO and seven EMAs are plotted in a separate panel. The EMAs (colored lines) move in a wavy pattern:
Red (fastest) to Violet (slowest) represent different response speeds.
When the faster EMAs (e.g., red, orange) are above slower ones (e.g., blue, violet), it suggests bullish momentum, and vice versa.
Zero Line: A gray wavy line at zero acts as a neutral level. The ACO above zero indicates bullish conditions; below zero indicates bearish conditions.
Overbought/Oversold Lines: Red (overbought) and green (oversold) wavy lines mark threshold levels. Extreme ACO values near these lines may suggest reversals.
Buy/Sell Signals:
Green Triangle (Bottom): Appears when the ACO crosses above the oversold threshold, suggesting a potential buy.
Red Triangle (Top): Appears when the ACO crosses below the overbought threshold, suggesting a potential sell.
Divergences:
Green Triangle (Bottom): Indicates a bullish divergence (price makes a lower low, but the EMA makes a higher low), hinting at a potential upward reversal.
Red Triangle (Top): Indicates a bearish divergence (price makes a higher high, but the EMA makes a lower high), hinting at a potential downward reversal.
5. Using Alerts
You can set alerts for key events:
Right-click the indicator and select Add Alert.
Choose a condition (e.g., "ACO Buy Signal", "Bullish Divergence").
Configure the alert settings (e.g., notify via email, app, or pop-up).
Click Create to activate the alert.
Available alert conditions:
ACO Buy Signal: When the ACO crosses above the oversold threshold.
ACO Sell Signal: When the ACO crosses below the overbought threshold.
Bullish Divergence: When a potential upward reversal is detected.
Bearish Divergence: When a potential downward reversal is detected.
6. Tips for Using the Indicator
Combine with Other Tools: Use the indicator alongside support/resistance levels, candlestick patterns, or other indicators (e.g., RSI, MACD) for confirmation.
Test on Different Timeframes: The indicator works on any timeframe (e.g., 1-minute, daily). Shorter timeframes may produce more signals but with more noise.
Practice Risk Management: Never rely solely on this indicator. Set stop-losses and position sizes to manage risk.
Backtest First: Use TradingView’s Strategy Tester (if you convert the script to a strategy) to evaluate performance on historical data.
Compliance with TradingView’s Script Publishing Rules
This description adheres to TradingView’s Script Publishing Rules (as outlined in the provided link):
No Performance Claims: The description avoids promising profits or specific results, emphasizing that the indicator is a tool for analysis.
Clear Instructions: It provides step-by-step guidance for adding, customizing, and using the indicator.
Risk Disclaimer: It notes that trading involves risks and the indicator should be used with other analysis methods.
No Misleading Terms: Terms like “buy” and “sell” are used to describe signals, not guaranteed actions.
Transparency: The description explains the indicator’s components (ACO, EMAs, signals, divergences) without exaggerating its capabilities.
No External Links: The description avoids linking to external resources or soliciting users.
Educational Tone: It focuses on educating users about the indicator’s functionality.
Limitations
Not a Standalone System: The indicator is not a complete trading strategy. It provides insights but requires additional analysis.
Lagging Nature: As with most oscillators and EMAs, signals may lag behind price movements, especially in fast markets.
False Signals: Signals and divergences may not always lead to successful trades, particularly in choppy markets.
Market Dependency: Performance varies across assets and market conditions (e.g., trending vs. ranging markets).

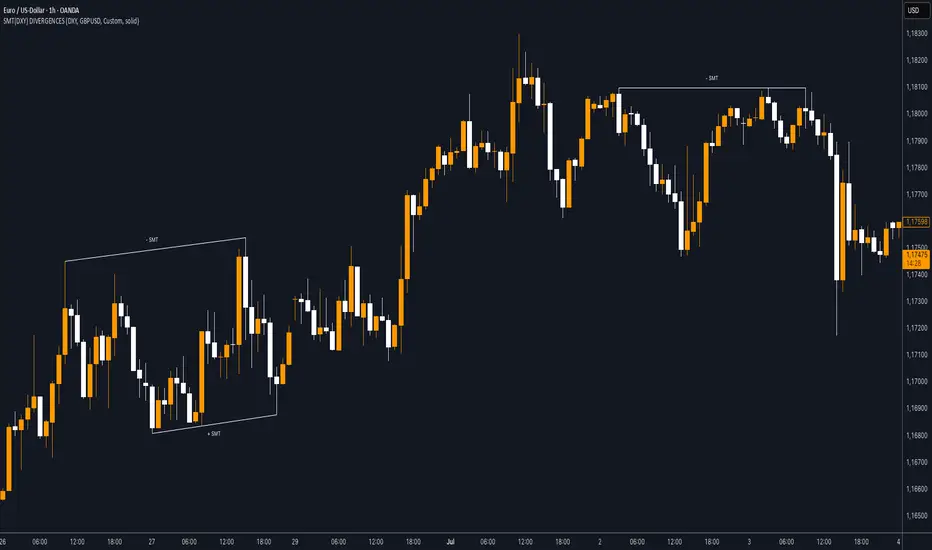
SMT (DXY) DIVERGENCESThis indicator detects Smart Money Technique (SMT) Divergences between the chart symbol and up to two comparison symbols defined in the settings.
It identifies swing highs and swing lows on correlated/uncorrelated instruments, compares their highs and lows, and determines possible divergences.
🔷 What It Detects
-Bullish SMT Divergence: When the lows of the chart symbol slope in the opposite direction of the comparison symbol’s lows.
-Bearish SMT Divergence: When the highs of the chart symbol slope in the opposite direction of the comparison symbol’s highs.
-Multi-Symbol Compatibility: Ability to compare the main symbol with one or two external tickers (default: DXY and GBPUSD).
-Negative Divergence Option: The inversion feature allows comparison with opposite-moving charts.
🔷 Calculation Logic
-Swing Detection: Swing highs and lows are confirmed using pivot-based logic.
-Comparison: Slopes of highs and lows are calculated for both the chart symbol and the comparison symbols.
-Divergence Identification: If slopes point in opposite directions, an SMT divergence (bullish or bearish) is marked.
-Visualization: Lines and labels (“+ SMT” or “– SMT”) are drawn on the chart. Historical lines can be kept or cleared depending on user settings.
🔷 Visual
Bearish SMT: Downward line with “– SMT” label.
Bullish SMT: Upward line with “+ SMT” label.
Style Options: Predefined color schemes (TLAB, standard, monochrome) or fully customizable colors.
Line Style: Solid, dashed, or dotted.
🔷 Customization Options
-Show Historical: Decide whether past divergences remain visible on the chart.
-Comparison Symbols: Define up to two external tickers, with optional inversion.
-Swing Lengths: Preconfigured pivot lengths automatically adapt to the selected timeframe (Daily, 4H, 1H, 5m/15m).
-Lines & Labels: Enable or disable bullish/bearish SMT divergences and their annotations.
🔷 Indicator Usage
Select the comparison symbol with positive or negative correlation.
Wait for the “+ SMT” or “– SMT” marker to appear on the chart.
Divergences can be used as contextual confluence when studying potential market shifts:
A + SMT marker may suggest bullish divergence.
A – SMT marker may suggest bearish divergence.
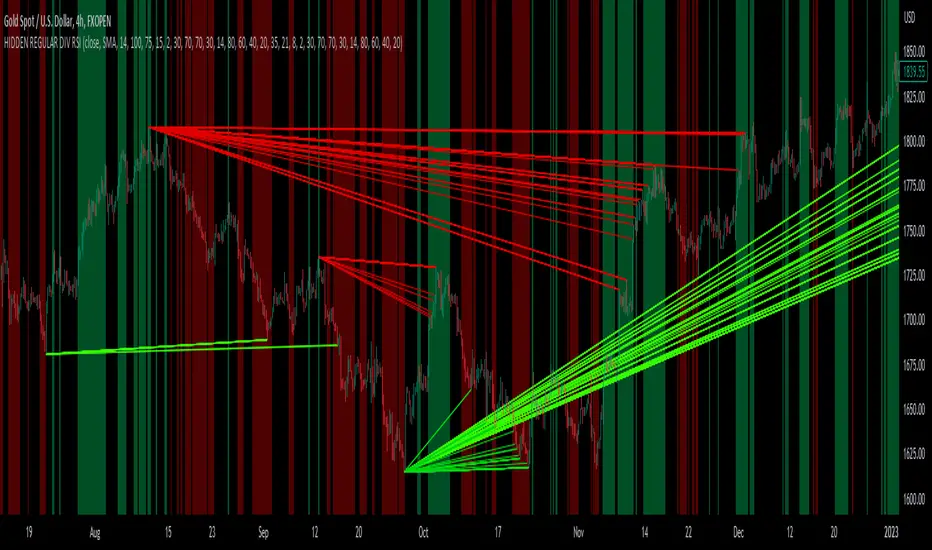
LibPvotLibrary "LibPvot"
This is a library for advanced technical analysis, specializing
in two core areas: the detection of price-oscillator
divergences and the analysis of market structure. It provides
a back-end engine for signal detection and a toolkit for
indicator plotting.
Key Features:
1. **Complete Divergence Suite (Class A, B, C):** The engine detects
all three major types of divergences, providing a full spectrum of
analytical signals:
- **Regular (A):** For potential trend reversals.
- **Hidden (B):** For potential trend continuations.
- **Exaggerated (C):** For identifying weakness at double tops/bottoms.
2. **Advanced Signal Filtering:** The detection logic uses a
percentage-based price tolerance (`prcTol`). This feature
enables the practical detection of Exaggerated divergences
(which rarely occur at the exact same price) and creates a
"dead zone" to filter insignificant noise from triggering
Regular divergences.
3. **Pivot Synchronization:** A bar tolerance (`barTol`) is used
to reliably match price and oscillator pivots that do not
align perfectly on the same bar, preventing missed signals.
4. **Signal Invalidation Logic:** Features two built-in invalidation
rules:
- An optional `invalidate` parameter automatically terminates
active divergences if the price or the oscillator breaks
the level of the confirming pivot.
- The engine also discards 'half-pivots' (e.g., a price pivot)
if a corresponding oscillator pivot does not appear within
the `barTol` window.
5. **Stateful Plotting Helpers:** Provides helper functions
(`bullDivPos` and `bearDivPos`) that abstract away the
state management issues of visualizing persistent signals.
They generate gap-free, accurately anchored data series
ready to be used in `plotshape` functions, simplifying
indicator-side code.
6. **Rich Data Output:** The core detection functions (`bullDiv`, `bearDiv`)
return a comprehensive 9-field data tuple. This includes the
boolean flags for each divergence type and the precise
coordinates (price, oscillator value, bar index) of both the
starting and the confirming pivots.
7. **Market Structure & Trend Analysis:** Includes a
`marketStructure` function to automatically identify pivot
highs/lows, classify their relationship (HH, LH, LL, HL),
detect structure breaks, and determine the current trend
state (Up, Down, Neutral) based on pivot sequences.
---
**DISCLAIMER**
This library is provided "AS IS" and for informational and
educational purposes only. It does not constitute financial,
investment, or trading advice.
The author assumes no liability for any errors, inaccuracies,
or omissions in the code. Using this library to build
trading indicators or strategies is entirely at your own risk.
As a developer using this library, you are solely responsible
for the rigorous testing, validation, and performance of any
scripts you create based on these functions. The author shall
not be held liable for any financial losses incurred directly
or indirectly from the use of this library or any scripts
derived from it.
bullDiv(priceSrc, oscSrc, leftLen, rightLen, depth, barTol, prcTol, persist, invalidate)
Detects bullish divergences (Regular, Hidden, Exaggerated) based on pivot lows.
Parameters:
priceSrc (float) : series float Price series to check for pivots (e.g., `low`).
oscSrc (float) : series float Oscillator series to check for pivots.
leftLen (int) : series int Number of bars to the left of a pivot (default 5).
rightLen (int) : series int Number of bars to the right of a pivot (default 5).
depth (int) : series int Maximum number of stored pivot pairs to check against (default 2).
barTol (int) : series int Maximum bar distance allowed between the price pivot and the oscillator pivot (default 3).
prcTol (float) : series float The percentage tolerance for comparing pivot prices. Used to detect Exaggerated
divergences and filter out market noise (default 0.05%).
persist (bool) : series bool If `true` (default), the divergence flag stays active for the entire duration of the signal.
If `false`, it returns a single-bar pulse on detection.
invalidate (bool) : series bool If `true` (default), terminates an active divergence if price or oscillator break
below the confirming pivot low.
Returns: A tuple containing comprehensive data for a detected bullish divergence.
regBull series bool `true` if a Regular bullish divergence (Class A) is active.
hidBull series bool `true` if a Hidden bullish divergence (Class B) is active.
exgBull series bool `true` if an Exaggerated bullish divergence (Class C) is active.
initPivotPrc series float Price value of the initial (older) pivot low.
initPivotOsz series float Oscillator value of the initial pivot low.
initPivotBar series int Bar index of the initial pivot low.
lastPivotPrc series float Price value of the last (confirming) pivot low.
lastPivotOsz series float Oscillator value of the last pivot low.
lastPivotBar series int Bar index of the last pivot low.
bearDiv(priceSrc, oscSrc, leftLen, rightLen, depth, barTol, prcTol, persist, invalidate)
Detects bearish divergences (Regular, Hidden, Exaggerated) based on pivot highs.
Parameters:
priceSrc (float) : series float Price series to check for pivots (e.g., `high`).
oscSrc (float) : series float Oscillator series to check for pivots.
leftLen (int) : series int Number of bars to the left of a pivot (default 5).
rightLen (int) : series int Number of bars to the right of a pivot (default 5).
depth (int) : series int Maximum number of stored pivot pairs to check against (default 2).
barTol (int) : series int Maximum bar distance allowed between the price pivot and the oscillator pivot (default 3).
prcTol (float) : series float The percentage tolerance for comparing pivot prices. Used to detect Exaggerated
divergences and filter out market noise (default 0.05%).
persist (bool) : series bool If `true` (default), the divergence flag stays active for the entire duration of the signal.
If `false`, it returns a single-bar pulse on detection.
invalidate (bool) : series bool If `true` (default), terminates an active divergence if price or oscillator break
above the confirming pivot high.
Returns: A tuple containing comprehensive data for a detected bearish divergence.
regBear series bool `true` if a Regular bearish divergence (Class A) is active.
hidBear series bool `true` if a Hidden bearish divergence (Class B) is active.
exgBear series bool `true` if an Exaggerated bearish divergence (Class C) is active.
initPivotPrc series float Price value of the initial (older) pivot high.
initPivotOsz series float Oscillator value of the initial pivot high.
initPivotBar series int Bar index of the initial pivot high.
lastPivotPrc series float Price value of the last (confirming) pivot high.
lastPivotOsz series float Oscillator value of the last pivot high.
lastPivotBar series int Bar index of the last pivot high.
bullDivPos(regBull, hidBull, exgBull, rightLen, yPos)
Calculates the plottable data series for bullish divergences. It manages
the complex state of a persistent signal's plotting window to ensure
gap-free and accurately anchored visualization.
Parameters:
regBull (bool) : series bool The regular bullish divergence flag from `bullDiv`.
hidBull (bool) : series bool The hidden bullish divergence flag from `bullDiv`.
exgBull (bool) : series bool The exaggerated bullish divergence flag from `bullDiv`.
rightLen (int) : series int The same `rightLen` value used in `bullDiv` for correct timing.
yPos (float) : series float The series providing the base Y-coordinate for the shapes (e.g., `low`).
Returns: A tuple of three `series float` for plotting bullish divergences.
regBullPosY series float Contains the static anchor Y-value for Regular divergences where a shape should be plotted; `na` otherwise.
hidBullPosY series float Contains the static anchor Y-value for Hidden divergences where a shape should be plotted; `na` otherwise.
exgBullPosY series float Contains the static anchor Y-value for Exaggerated divergences where a shape should be plotted; `na` otherwise.
bearDivPos(regBear, hidBear, exgBear, rightLen, yPos)
Calculates the plottable data series for bearish divergences. It manages
the complex state of a persistent signal's plotting window to ensure
gap-free and accurately anchored visualization.
Parameters:
regBear (bool) : series bool The regular bearish divergence flag from `bearDiv`.
hidBear (bool) : series bool The hidden bearish divergence flag from `bearDiv`.
exgBear (bool) : series bool The exaggerated bearish divergence flag from `bearDiv`.
rightLen (int) : series int The same `rightLen` value used in `bearDiv` for correct timing.
yPos (float) : series float The series providing the base Y-coordinate for the shapes (e.g., `high`).
Returns: A tuple of three `series float` for plotting bearish divergences.
regBearPosY series float Contains the static anchor Y-value for Regular divergences where a shape should be plotted; `na` otherwise.
hidBearPosY series float Contains the static anchor Y-value for Hidden divergences where a shape should be plotted; `na` otherwise.
exgBearPosY series float Contains the static anchor Y-value for Exaggerated divergences where a shape should be plotted; `na` otherwise.
marketStructure(highSrc, lowSrc, leftLen, rightLen, srcTol)
Analyzes the market structure by identifying pivot points, classifying
their sequence (e.g., Higher Highs, Lower Lows), and determining the
prevailing trend state.
Parameters:
highSrc (float) : series float Price series for pivot high detection (e.g., `high`).
lowSrc (float) : series float Price series for pivot low detection (e.g., `low`).
leftLen (int) : series int Number of bars to the left of a pivot (default 5).
rightLen (int) : series int Number of bars to the right of a pivot (default 5).
srcTol (float) : series float Percentage tolerance to consider two pivots as 'equal' (default 0.05%).
Returns: A tuple containing detailed market structure information.
pivType series PivType The type of the most recently formed pivot (e.g., `hh`, `ll`).
lastPivHi series float The price level of the last confirmed pivot high.
lastPivLo series float The price level of the last confirmed pivot low.
lastPiv series float The price level of the last confirmed pivot (either high or low).
pivHiBroken series bool `true` if the price has broken above the last pivot high.
pivLoBroken series bool `true` if the price has broken below the last pivot low.
trendState series TrendState The current trend state (`up`, `down`, or `neutral`).

Dskyz (DAFE) Aurora Divergence - Dskyz (DAFE) Aurora Divergence Indicator
Advanced Divergence Detection for Traders. Unleash the power of divergence trading with this cutting-edge indicator that combines price and volume analysis to spot high-probability reversal signals.
🧠 What Is It?
The Dskyz (DAFE) Aurora Divergence Indicator is designed to identify bullish and bearish divergences between the price trend and the On Balance Volume (OBV) trend. Divergence occurs when the price of an asset and a technical indicator (in this case, OBV) move in opposite directions, signaling a potential reversal. This indicator uses linear regression slopes to calculate the trends of both price and OBV over a specified lookback period, detecting when these two metrics are diverging. When a divergence is detected, it highlights potential reversal points with visually striking aurora bands, orbs, and labels, making it easy for traders to spot key signals.
⚙️ Inputs & How to Use Them
The indicator is highly customizable, with inputs grouped under "⚡ DAFE Aurora Settings" for clarity. Here’s how each input works:
Lookback Period: Determines how many bars are used to calculate the price and OBV slopes. Higher values detect longer-term trends (e.g., 20 for 1H charts), while lower values are more responsive to short-term movements.
Price Slope Threshold: Sets the minimum slope value for the price to be considered in an uptrend or downtrend. A value of 0 allows all slopes to be considered, while higher values filter for stronger trends.
OBV Slope Threshold: Similar to the price slope threshold but for OBV. Helps filter out weak volume trends.
Aurora Band Width: Adjusts the width of the visual bands that highlight divergence areas. Wider bands make the indicator more visible but may clutter the chart.
Divergence Sensitivity: Scales the strength of the divergence signals. Higher values make the indicator more sensitive to smaller divergences.
Minimum Strength: Filters out weak signals by only showing divergences above this strength level. A default of 0.3 is recommended for beginners.
Signal Cooldown (Bars): Prevents multiple signals from appearing too close together. Default is 5 bars, reducing chart clutter and helping traders focus on significant signals.
These inputs allow traders to fine-tune the indicator to match their trading style and timeframe.
🚀 What Makes It Unique?
This indicator stands out with its innovative features:
Price-Volume Divergence: Combines price trend (slope) and OBV trend for more reliable signals than price-only divergences.
Aurora Bands: Dynamic visual bands that highlight divergence zones, making it easier to spot potential reversals at a glance.
Interactive Dashboard: Displays real-time information on trend direction, volume flow, signal type, strength, and recommended actions (e.g., "Consider Buying" or "Consider Selling").
Signal Cooldown: Ensures only the most significant divergences are shown, reducing noise and improving usability.
Alerts: Built-in alerts for both bullish and bearish divergences, allowing traders to stay informed even when not actively monitoring the chart.
Beginner Guide: Explains the indicator’s visuals (e.g., aqua orbs for bullish signals, fuchsia orbs for bearish signals), making it accessible for new users.
🎯 Why It Works
The indicator’s effectiveness lies in its use of price-volume divergence, a well-established concept in technical analysis. When the price trend and OBV trend diverge, it often signals a potential reversal because the underlying volume support (or lack thereof) is not aligning with the price action. For example:
Bullish Divergence: Occurs when the price is making lower lows, but the OBV is making higher lows, indicating weakening selling pressure and potential upward reversal.
Bearish Divergence: Occurs when the price is making higher highs, but the OBV is making lower highs, suggesting weakening buying pressure and potential downward reversal.
The use of linear regression ensures smooth and accurate trend calculations over the specified lookback period. The divergence strength is then normalized and filtered based on user-defined thresholds, ensuring only high-quality signals are displayed. Additionally, the cooldown period prevents signal overload, allowing traders to focus on the most significant opportunities.
🧬 Indicator Recommendation
Best For: Traders looking to identify potential trend reversals in any market, especially those where volume data is reliable (e.g., stocks, futures, forex).
Timeframes: Suitable for all timeframes. Adjust the lookback period accordingly—smaller values for shorter timeframes (e.g., 1H), larger for longer ones (e.g., 4H or daily).
Pair With: Support and resistance levels, trend lines, other oscillators (e.g., RSI, MACD) for confirmation, and volume profile tools for deeper analysis.
Tips:
Look for divergences at key support/resistance levels for higher-probability setups.
Pay attention to signal strength; higher strength divergences are often more reliable.
Use the dashboard to quickly assess market conditions before entering a trade.
Set up alerts to catch divergences even when not actively watching the chart.
🧾 Credit & Acknowledgement
This indicator builds upon the classic concept of price-volume divergence, enhancing it with modern visualization techniques, advanced filtering, and user-friendly features. It is designed to provide traders with a powerful yet intuitive tool for spotting reversals.
📌 Final Thoughts
The Dskyz (DAFE) Aurora Divergence Indicator is more than just a divergence tool; it’s a comprehensive trading assistant that combines advanced calculations, intuitive visualizations, and actionable insights. Whether you’re a seasoned trader or just starting out, this indicator can help you spot high-probability reversal points with confidence.
Use it with discipline. Use it with clarity. Trade smarter.
**I will continue to release incredible strategies and indicators until I turn this into a brand or until someone offers me a contract.
-Dskyz
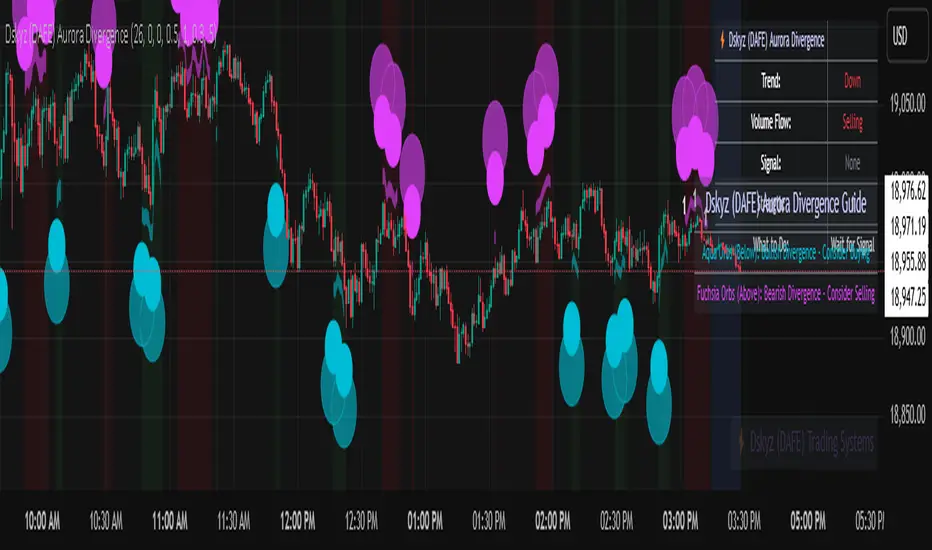
Volumetric Toolkit [LuxAlgo]The Volumetric Toolkit is a complete and comprehensive set of tools that display price action-related analysis methods from volume data.
A total of 4 features are included within the toolkit. Symbols that do not include volume data will not be supported by the script.
🔶 USAGE
The volumetric toolkit puts a heavy focus on price action, returning support/resistance levels, ranges, volume divergences...etc.
The main premise between each feature is that volume has a direct relationship with market participants level of interest over a specific symbol, and that this interest is not constant over time.
Each individual feature is detailed below.
🔹 Ranges Of Interest
The Ranges Of Interest construct a range from a surge of high liquidity in the market. This range is constructed from the price high and price low of the candle with the associated significant liquidity.
The returned extremities can be used as support and resistance, with breakouts often being accompanied by significant liquidity as well, suggesting potential trend continuations.
The length setting associated with this feature determines how sensitive the range detection algorithm is to volume, with higher values requiring more significant volume in order to display a new range.
🔹 Impulses
Impulses highlight times when volume makes a new higher high while the price makes a new higher high or lower low, suggesting increased market participation.
When this occurs when the price makes a new higher high the impulse is considered bullish (green), if the price makes a new lower low the impulse is bearish (red).
Impulses occurring within an established trend opposite to it (e.g a bearish impulse on an uptrend) might be indicative of reversals.
The length setting works similarly to the previously described ranges of interest, with higher values requiring longer-term volume higher high and price higher high/lower low, highlighting more significant impulse and potentially longer-term reversals.
🔹 Levels Of Interest
Levels of interest display price levels of significant trading activity, contrary to the range of interest only the closing price is taken into account, also volume peaks are used to detect significant trading activity.
Note that this feature is subject to backpainting, that is lines are set retrospectively.
Users can determine the amount of most recent levels to display on the chart. These can be used as classical support/resistances.
🔹 Volume Divergence
We define volume divergence as a decreased market participation while a trend is still developing.
More precisely volume divergences are highlighted if volume makes a lower high while price is making a new higher high/lower low.
This can be indicative of a lack of further participation in the current trend, indicating a potential reversal.
Using higher length values will return longer-term divergences.
Note that this feature is subject to backpainting, that is lines are set retrospectively.
🔶 SETTINGS
🔹 Ranges Of Interest
Show Ranges Of Interest: Display Ranges Of Interest.
Length: Ranges Of Interest sensitivity to volume.
🔹 Impulses
Show Impulses: Display Ranges Of Interest.
Length: Impulses sensitivity to volume.
🔹 Levels Of Interest
Show: Determine if Levels Of Interest are displayed, and how many from the most recent.
Length: Level detection sensitivity to volume.
🔹 Volume Divergences
Show Divergences: Determine if Volume Divergences are displayed.
Length: Period for the detection of price tops/bottoms and volume peaks.

RSI MA Cross + Divergence Signal (V2) Core Logic
RSI + Moving Average
The script calculates a standard RSI (default 14).
It then overlays a moving average (SMA/EMA/WMA, default 9).
When RSI crosses above its MA → bullish momentum.
When RSI crosses below its MA → bearish momentum.
Divergence Filter
Signals are only valid if there’s confirmed divergence:
Bullish divergence: Price makes a lower low, RSI makes a higher low.
Bearish divergence: Price makes a higher high, RSI makes a lower high.
Overbought / Oversold Filter
Optional extra:
Bullish signals only valid if RSI ≤ 30 (oversold).
Bearish signals only valid if RSI ≥ 70 (overbought).
This ensures signals happen in “stretched” conditions.
Risk & Trade Management
Entries taken only when all conditions align.
Exits can be managed with ATR stops, partial take-profits, breakeven moves, and trailing stops (we coded these in the strategy version).
Cooldown, session filters, and daily loss guard to keep risk tight.
🔹 Strengths
✅ High selectivity: Combining RSI cross + divergence + OB/OS means signals are rare but higher quality.
✅ Great at catching reversals: Divergence highlights where price may be running out of steam.
✅ Risk management baked in: ATR stops + partial exits smooth out equity curve.
✅ Works across markets: ES, FX, crypto — anywhere RSI divergences are respected.
✅ Flexible: You can loosen/tighten filters depending on aggressiveness.
🔹 Weaknesses
❌ Lag from pivots: Divergence only confirms after a few bars → you enter late sometimes.
❌ Choppy in ranges: In sideways markets, RSI divergences appear often and whipsaw.
❌ Filters reduce signals: With all filters ON (divergence + OB/OS + trend + session), signals can be very rare — may under-trade.
❌ Not standalone: Needs higher-timeframe context (trend, liquidity pools) to avoid counter-trend entries.
🔹 Best Ways to Trade It
Use Higher Timeframe Bias
Run the strategy on 15m/1H, but only trade in direction of higher timeframe trend (e.g., 4H EMA).
Example: If daily is bullish → only take bullish divergences.
Pair With Structure
Look for signals at key zones: HTF support/resistance, VWAP, or FVGs.
Divergence + RSI cross inside an FVG is a strong entry trigger.
Adjust OB/OS for Volatility
For crypto/FX: use 35/65 instead of 30/70 (markets trend harder).
For ES/S&P: 30/70 works fine.
Risk Management Is King
Use partial exits: take profit at 1R, trail rest.
Size by % of equity (we coded this into the strategy).
Avoid News Spikes
Divergences break down around CPI, NFP, Fed announcements — stay flat.
🔹 When It Shines
Trending markets that make extended pushes → clean divergences.
Reversal zones (oversold → bullish bounce, overbought → bearish fade).
Swing trading (15m–4H) — less noise than 1m/5m scalping.
🔹 When to Avoid
Low volatility chop → lots of false divergences.
During high-impact news → RSI swings wildly.
In strong one-way trends without pullbacks — divergence keeps calling tops/bottoms too early.
✅ Summary:
This is a reversal-focused RSI divergence strategy with strict filters. It’s powerful when combined with higher-timeframe bias + structure confluence, but weak if traded blindly in choppy or news-driven conditions. Best to treat it as a precision entry trigger, not a full system — layer it on top of your FVG/ORB framework for maximum edge.
