Volumetric Toolkit [LuxAlgo]The Volumetric Toolkit is a complete and comprehensive set of tools that display price action-related analysis methods from volume data.
A total of 4 features are included within the toolkit. Symbols that do not include volume data will not be supported by the script.
🔶 USAGE
The volumetric toolkit puts a heavy focus on price action, returning support/resistance levels, ranges, volume divergences...etc.
The main premise between each feature is that volume has a direct relationship with market participants level of interest over a specific symbol, and that this interest is not constant over time.
Each individual feature is detailed below.
🔹 Ranges Of Interest
The Ranges Of Interest construct a range from a surge of high liquidity in the market. This range is constructed from the price high and price low of the candle with the associated significant liquidity.
The returned extremities can be used as support and resistance, with breakouts often being accompanied by significant liquidity as well, suggesting potential trend continuations.
The length setting associated with this feature determines how sensitive the range detection algorithm is to volume, with higher values requiring more significant volume in order to display a new range.
🔹 Impulses
Impulses highlight times when volume makes a new higher high while the price makes a new higher high or lower low, suggesting increased market participation.
When this occurs when the price makes a new higher high the impulse is considered bullish (green), if the price makes a new lower low the impulse is bearish (red).
Impulses occurring within an established trend opposite to it (e.g a bearish impulse on an uptrend) might be indicative of reversals.
The length setting works similarly to the previously described ranges of interest, with higher values requiring longer-term volume higher high and price higher high/lower low, highlighting more significant impulse and potentially longer-term reversals.
🔹 Levels Of Interest
Levels of interest display price levels of significant trading activity, contrary to the range of interest only the closing price is taken into account, also volume peaks are used to detect significant trading activity.
Note that this feature is subject to backpainting, that is lines are set retrospectively.
Users can determine the amount of most recent levels to display on the chart. These can be used as classical support/resistances.
🔹 Volume Divergence
We define volume divergence as a decreased market participation while a trend is still developing.
More precisely volume divergences are highlighted if volume makes a lower high while price is making a new higher high/lower low.
This can be indicative of a lack of further participation in the current trend, indicating a potential reversal.
Using higher length values will return longer-term divergences.
Note that this feature is subject to backpainting, that is lines are set retrospectively.
🔶 SETTINGS
🔹 Ranges Of Interest
Show Ranges Of Interest: Display Ranges Of Interest.
Length: Ranges Of Interest sensitivity to volume.
🔹 Impulses
Show Impulses: Display Ranges Of Interest.
Length: Impulses sensitivity to volume.
🔹 Levels Of Interest
Show: Determine if Levels Of Interest are displayed, and how many from the most recent.
Length: Level detection sensitivity to volume.
🔹 Volume Divergences
Show Divergences: Determine if Volume Divergences are displayed.
Length: Period for the detection of price tops/bottoms and volume peaks.
Cerca negli script per "Divergence"

LibPvotLibrary "LibPvot"
This is a library for advanced technical analysis, specializing
in two core areas: the detection of price-oscillator
divergences and the analysis of market structure. It provides
a back-end engine for signal detection and a toolkit for
indicator plotting.
Key Features:
1. **Complete Divergence Suite (Class A, B, C):** The engine detects
all three major types of divergences, providing a full spectrum of
analytical signals:
- **Regular (A):** For potential trend reversals.
- **Hidden (B):** For potential trend continuations.
- **Exaggerated (C):** For identifying weakness at double tops/bottoms.
2. **Advanced Signal Filtering:** The detection logic uses a
percentage-based price tolerance (`prcTol`). This feature
enables the practical detection of Exaggerated divergences
(which rarely occur at the exact same price) and creates a
"dead zone" to filter insignificant noise from triggering
Regular divergences.
3. **Pivot Synchronization:** A bar tolerance (`barTol`) is used
to reliably match price and oscillator pivots that do not
align perfectly on the same bar, preventing missed signals.
4. **Signal Invalidation Logic:** Features two built-in invalidation
rules:
- An optional `invalidate` parameter automatically terminates
active divergences if the price or the oscillator breaks
the level of the confirming pivot.
- The engine also discards 'half-pivots' (e.g., a price pivot)
if a corresponding oscillator pivot does not appear within
the `barTol` window.
5. **Stateful Plotting Helpers:** Provides helper functions
(`bullDivPos` and `bearDivPos`) that abstract away the
state management issues of visualizing persistent signals.
They generate gap-free, accurately anchored data series
ready to be used in `plotshape` functions, simplifying
indicator-side code.
6. **Rich Data Output:** The core detection functions (`bullDiv`, `bearDiv`)
return a comprehensive 9-field data tuple. This includes the
boolean flags for each divergence type and the precise
coordinates (price, oscillator value, bar index) of both the
starting and the confirming pivots.
7. **Market Structure & Trend Analysis:** Includes a
`marketStructure` function to automatically identify pivot
highs/lows, classify their relationship (HH, LH, LL, HL),
detect structure breaks, and determine the current trend
state (Up, Down, Neutral) based on pivot sequences.
---
**DISCLAIMER**
This library is provided "AS IS" and for informational and
educational purposes only. It does not constitute financial,
investment, or trading advice.
The author assumes no liability for any errors, inaccuracies,
or omissions in the code. Using this library to build
trading indicators or strategies is entirely at your own risk.
As a developer using this library, you are solely responsible
for the rigorous testing, validation, and performance of any
scripts you create based on these functions. The author shall
not be held liable for any financial losses incurred directly
or indirectly from the use of this library or any scripts
derived from it.
bullDiv(priceSrc, oscSrc, leftLen, rightLen, depth, barTol, prcTol, persist, invalidate)
Detects bullish divergences (Regular, Hidden, Exaggerated) based on pivot lows.
Parameters:
priceSrc (float) : series float Price series to check for pivots (e.g., `low`).
oscSrc (float) : series float Oscillator series to check for pivots.
leftLen (int) : series int Number of bars to the left of a pivot (default 5).
rightLen (int) : series int Number of bars to the right of a pivot (default 5).
depth (int) : series int Maximum number of stored pivot pairs to check against (default 2).
barTol (int) : series int Maximum bar distance allowed between the price pivot and the oscillator pivot (default 3).
prcTol (float) : series float The percentage tolerance for comparing pivot prices. Used to detect Exaggerated
divergences and filter out market noise (default 0.05%).
persist (bool) : series bool If `true` (default), the divergence flag stays active for the entire duration of the signal.
If `false`, it returns a single-bar pulse on detection.
invalidate (bool) : series bool If `true` (default), terminates an active divergence if price or oscillator break
below the confirming pivot low.
Returns: A tuple containing comprehensive data for a detected bullish divergence.
regBull series bool `true` if a Regular bullish divergence (Class A) is active.
hidBull series bool `true` if a Hidden bullish divergence (Class B) is active.
exgBull series bool `true` if an Exaggerated bullish divergence (Class C) is active.
initPivotPrc series float Price value of the initial (older) pivot low.
initPivotOsz series float Oscillator value of the initial pivot low.
initPivotBar series int Bar index of the initial pivot low.
lastPivotPrc series float Price value of the last (confirming) pivot low.
lastPivotOsz series float Oscillator value of the last pivot low.
lastPivotBar series int Bar index of the last pivot low.
bearDiv(priceSrc, oscSrc, leftLen, rightLen, depth, barTol, prcTol, persist, invalidate)
Detects bearish divergences (Regular, Hidden, Exaggerated) based on pivot highs.
Parameters:
priceSrc (float) : series float Price series to check for pivots (e.g., `high`).
oscSrc (float) : series float Oscillator series to check for pivots.
leftLen (int) : series int Number of bars to the left of a pivot (default 5).
rightLen (int) : series int Number of bars to the right of a pivot (default 5).
depth (int) : series int Maximum number of stored pivot pairs to check against (default 2).
barTol (int) : series int Maximum bar distance allowed between the price pivot and the oscillator pivot (default 3).
prcTol (float) : series float The percentage tolerance for comparing pivot prices. Used to detect Exaggerated
divergences and filter out market noise (default 0.05%).
persist (bool) : series bool If `true` (default), the divergence flag stays active for the entire duration of the signal.
If `false`, it returns a single-bar pulse on detection.
invalidate (bool) : series bool If `true` (default), terminates an active divergence if price or oscillator break
above the confirming pivot high.
Returns: A tuple containing comprehensive data for a detected bearish divergence.
regBear series bool `true` if a Regular bearish divergence (Class A) is active.
hidBear series bool `true` if a Hidden bearish divergence (Class B) is active.
exgBear series bool `true` if an Exaggerated bearish divergence (Class C) is active.
initPivotPrc series float Price value of the initial (older) pivot high.
initPivotOsz series float Oscillator value of the initial pivot high.
initPivotBar series int Bar index of the initial pivot high.
lastPivotPrc series float Price value of the last (confirming) pivot high.
lastPivotOsz series float Oscillator value of the last pivot high.
lastPivotBar series int Bar index of the last pivot high.
bullDivPos(regBull, hidBull, exgBull, rightLen, yPos)
Calculates the plottable data series for bullish divergences. It manages
the complex state of a persistent signal's plotting window to ensure
gap-free and accurately anchored visualization.
Parameters:
regBull (bool) : series bool The regular bullish divergence flag from `bullDiv`.
hidBull (bool) : series bool The hidden bullish divergence flag from `bullDiv`.
exgBull (bool) : series bool The exaggerated bullish divergence flag from `bullDiv`.
rightLen (int) : series int The same `rightLen` value used in `bullDiv` for correct timing.
yPos (float) : series float The series providing the base Y-coordinate for the shapes (e.g., `low`).
Returns: A tuple of three `series float` for plotting bullish divergences.
regBullPosY series float Contains the static anchor Y-value for Regular divergences where a shape should be plotted; `na` otherwise.
hidBullPosY series float Contains the static anchor Y-value for Hidden divergences where a shape should be plotted; `na` otherwise.
exgBullPosY series float Contains the static anchor Y-value for Exaggerated divergences where a shape should be plotted; `na` otherwise.
bearDivPos(regBear, hidBear, exgBear, rightLen, yPos)
Calculates the plottable data series for bearish divergences. It manages
the complex state of a persistent signal's plotting window to ensure
gap-free and accurately anchored visualization.
Parameters:
regBear (bool) : series bool The regular bearish divergence flag from `bearDiv`.
hidBear (bool) : series bool The hidden bearish divergence flag from `bearDiv`.
exgBear (bool) : series bool The exaggerated bearish divergence flag from `bearDiv`.
rightLen (int) : series int The same `rightLen` value used in `bearDiv` for correct timing.
yPos (float) : series float The series providing the base Y-coordinate for the shapes (e.g., `high`).
Returns: A tuple of three `series float` for plotting bearish divergences.
regBearPosY series float Contains the static anchor Y-value for Regular divergences where a shape should be plotted; `na` otherwise.
hidBearPosY series float Contains the static anchor Y-value for Hidden divergences where a shape should be plotted; `na` otherwise.
exgBearPosY series float Contains the static anchor Y-value for Exaggerated divergences where a shape should be plotted; `na` otherwise.
marketStructure(highSrc, lowSrc, leftLen, rightLen, srcTol)
Analyzes the market structure by identifying pivot points, classifying
their sequence (e.g., Higher Highs, Lower Lows), and determining the
prevailing trend state.
Parameters:
highSrc (float) : series float Price series for pivot high detection (e.g., `high`).
lowSrc (float) : series float Price series for pivot low detection (e.g., `low`).
leftLen (int) : series int Number of bars to the left of a pivot (default 5).
rightLen (int) : series int Number of bars to the right of a pivot (default 5).
srcTol (float) : series float Percentage tolerance to consider two pivots as 'equal' (default 0.05%).
Returns: A tuple containing detailed market structure information.
pivType series PivType The type of the most recently formed pivot (e.g., `hh`, `ll`).
lastPivHi series float The price level of the last confirmed pivot high.
lastPivLo series float The price level of the last confirmed pivot low.
lastPiv series float The price level of the last confirmed pivot (either high or low).
pivHiBroken series bool `true` if the price has broken above the last pivot high.
pivLoBroken series bool `true` if the price has broken below the last pivot low.
trendState series TrendState The current trend state (`up`, `down`, or `neutral`).

RSI MA Cross + Divergence Signal (V2) Core Logic
RSI + Moving Average
The script calculates a standard RSI (default 14).
It then overlays a moving average (SMA/EMA/WMA, default 9).
When RSI crosses above its MA → bullish momentum.
When RSI crosses below its MA → bearish momentum.
Divergence Filter
Signals are only valid if there’s confirmed divergence:
Bullish divergence: Price makes a lower low, RSI makes a higher low.
Bearish divergence: Price makes a higher high, RSI makes a lower high.
Overbought / Oversold Filter
Optional extra:
Bullish signals only valid if RSI ≤ 30 (oversold).
Bearish signals only valid if RSI ≥ 70 (overbought).
This ensures signals happen in “stretched” conditions.
Risk & Trade Management
Entries taken only when all conditions align.
Exits can be managed with ATR stops, partial take-profits, breakeven moves, and trailing stops (we coded these in the strategy version).
Cooldown, session filters, and daily loss guard to keep risk tight.
🔹 Strengths
✅ High selectivity: Combining RSI cross + divergence + OB/OS means signals are rare but higher quality.
✅ Great at catching reversals: Divergence highlights where price may be running out of steam.
✅ Risk management baked in: ATR stops + partial exits smooth out equity curve.
✅ Works across markets: ES, FX, crypto — anywhere RSI divergences are respected.
✅ Flexible: You can loosen/tighten filters depending on aggressiveness.
🔹 Weaknesses
❌ Lag from pivots: Divergence only confirms after a few bars → you enter late sometimes.
❌ Choppy in ranges: In sideways markets, RSI divergences appear often and whipsaw.
❌ Filters reduce signals: With all filters ON (divergence + OB/OS + trend + session), signals can be very rare — may under-trade.
❌ Not standalone: Needs higher-timeframe context (trend, liquidity pools) to avoid counter-trend entries.
🔹 Best Ways to Trade It
Use Higher Timeframe Bias
Run the strategy on 15m/1H, but only trade in direction of higher timeframe trend (e.g., 4H EMA).
Example: If daily is bullish → only take bullish divergences.
Pair With Structure
Look for signals at key zones: HTF support/resistance, VWAP, or FVGs.
Divergence + RSI cross inside an FVG is a strong entry trigger.
Adjust OB/OS for Volatility
For crypto/FX: use 35/65 instead of 30/70 (markets trend harder).
For ES/S&P: 30/70 works fine.
Risk Management Is King
Use partial exits: take profit at 1R, trail rest.
Size by % of equity (we coded this into the strategy).
Avoid News Spikes
Divergences break down around CPI, NFP, Fed announcements — stay flat.
🔹 When It Shines
Trending markets that make extended pushes → clean divergences.
Reversal zones (oversold → bullish bounce, overbought → bearish fade).
Swing trading (15m–4H) — less noise than 1m/5m scalping.
🔹 When to Avoid
Low volatility chop → lots of false divergences.
During high-impact news → RSI swings wildly.
In strong one-way trends without pullbacks — divergence keeps calling tops/bottoms too early.
✅ Summary:
This is a reversal-focused RSI divergence strategy with strict filters. It’s powerful when combined with higher-timeframe bias + structure confluence, but weak if traded blindly in choppy or news-driven conditions. Best to treat it as a precision entry trigger, not a full system — layer it on top of your FVG/ORB framework for maximum edge.

PulseWave + DivergenceOverview
PulseWave + Divergence is a momentum oscillator designed to optimize the classic RSI. Unlike traditional RSI, which can produce delayed or noisy signals, PulseWave offers a smoother and faster oscillator line that better responds to changes in market dynamics. By using a formula based on the difference between RSI and its moving average, the indicator generates fewer false signals, making it a suitable tool for day traders and swing traders in stock, forex, and cryptocurrency markets.
How It Works
Generating the Oscillator Line
The PulseWave oscillator line is calculated as follows:
RSI is calculated based on the selected data source (default: close price) and RSI length (default: 20 periods).
RSI is smoothed using a simple moving average (MA) with a selected length (default: 20 periods).
The oscillator value is the difference between the current RSI and its moving average: oscillator = RSI - MA(RSI).
This approach ensures high responsiveness to short-term momentum changes while reducing market noise. Unlike other oscillators, such as standard RSI or MACD, which rely on direct price values or more complex formulas, PulseWave focuses on the dynamics of the difference between RSI and its moving average. This allows it to better capture short-term trend changes while minimizing the impact of random price fluctuations. The oscillator line fluctuates around zero, making it easy to identify bullish trends (positive values) and bearish trends (negative values).
Divergences
The indicator optionally detects bullish and bearish divergences by comparing price extremes (swing highs/lows) with oscillator extremes within a defined pivot window (default: 5 candles left and right). Divergences are marked with "Bull" (bullish) and "Bear" (bearish) labels on the oscillator chart.
Signals
Depending on the selected signal type, PulseWave generates buy and sell signals based on:
Crosses of the overbought and oversold levels.
Crosses of the oscillator’s zero line.
A combination of both (option "Both").
Signals are displayed as triangles above or below the oscillator, making them easy to identify.
Input Parameters
RSI Length: Length of the RSI used in calculations (default: 20).
RSI MA Length: Length of the RSI moving average (default: 20).
Overbought/Oversold Level: Oscillator overbought and oversold levels (default: 12.0 and -12.0).
Pivot Length: Number of candles used to detect extremes for divergences (default: 5).
Signal Type: Type of signals to display ("Overbought/Oversold", "Zero Line", "Both", or "None").
Colors and Gradients: Full customization of line, gradient, and label colors.
How to Use
Adjust Parameters:
Increase RSI Length (e.g., to 30) for high-volatility markets to reduce noise.
Decrease Pivot Length (e.g., to 3) for faster divergence detection on short timeframes.
Interpret Signals:
Buy Signal: The oscillator crosses above the oversold level or zero line, especially with a bullish divergence.
Sell Signal: The oscillator crosses below the overbought level or zero line, especially with a bearish divergence.
Combine with Other Tools:
Use PulseWave alongside moving averages or support/resistance levels to confirm signals.
Monitor Divergences:
"Bull" and "Bear" labels indicate potential trend reversals. Set up alerts to receive notifications for divergences.

MACDh with divergences & impulse system (overlayed on prices)-----------------------------------------------------------------
General Description:
This indicator ( the one on the top panel above ) consists on some lines, arrows and labels drawn over the price bars/candles indicating the detection of regular divergences between price and the classic MACD histogram (shown on the low panel). This script is special because it can be adjusted to fit several criteria when trading divergences filtering them according to the "height" and "width" of the patterns. The script also includes the "extra features" Impulse System and Keltner Channels, which you will hardly find anywhere else in similar classic MACD histogram divergence indicators.
The indicator helps to find trend reversals, and it works on any market, any instrument, any timeframe, and any market condition (except against really strong trends that do not show any other sign of reversion yet).
Please take on consideration that divergences should be taken with caution.
-----------------------------------------------------------------
Definition of classic Bullish and Bearish divergences:
* Bearish divergences occur in uptrends identifying market tops. A classical or regular bearish divergence occurs when prices reach a new high and then pull back, with an oscillator (MACD histogram in this case) dropping below its zero line. Prices stabilize and rally to a higher high, but the oscillator reaches a lower peak than it did on a previous rally.
In the chart above (weekly charts of NKE, Nike, Inc.), in area X (around August 2021), NKE rallied to a new bull market high and MACD-Histogram rallied with it, rising above its previous peak and showing that bulls were extremely strong. In area Y, MACD-H fell below its centerline and at the same time prices punched below the zone between the two moving averages. In area Z, NKE rallied to a new bull market high, but the rally of MACD-H was feeble, reflecting the bulls’ weakness. Its downtick from peak Z completed a bearish divergence, giving a strong sell signal and auguring a nasty bear market.
* Bullish divergences , in the other hand, occur towards the ends of downtrends identifying market bottoms. A classical (also called regular) bullish divergence occurs when prices and an oscillator (MACD histogram in this case) both fall to a new low, rally, with the oscillator rising above its zero line, then both fall again. This time, prices drop to a lower low, but the oscillator traces a higher bottom than during its previous decline.
In the example in the chart above (weekly charts of NKE, Nike, Inc.), you see a bearish divergence that signaled the October 2022 bear market bottom, giving a strong buy signal right near the lows. In area A, NKE (weekly charts) appeared in a free fall. The record low A of MACD-H indicated that bears were extremely strong. In area B, MACD-H rallied above its centerline. Notice the brief rally of prices at that moment. In area C, NKE slid to a new bear market low, but MACD-H traced a much more shallow low. Its uptick completed a bullish divergence, giving a strong buy signal.
-----------------------------------------------------------------
Some cool features included in this indicator:
1. This indicator also includes the “ Impulse System ”. The Impulse System is based on two indicators, a 13-day exponential moving average and the MACD-Histogram, and identifies inflection points where a trend speeds up or slows down. The moving average identifies the trend, while the MACD-Histogram measures momentum. This unique indicator combination is color coded into the price bars for easy reference.
Calculation:
Green Price Bar: (13-period EMA > previous 13-period EMA) and
(MACD-Histogram > previous period's MACD-Histogram)
Red Price Bar: (13-period EMA < previous 13-period EMA) and
(MACD-Histogram < previous period's MACD-Histogram)
Price bars are colored blue when conditions for a Red Price Bar or Green Price Bar are not met. The MACD-Histogram is based on MACD(12,26,9).
The Impulse System works more like a censorship system. Green price bars show that the bulls are in control of both trend and momentum as both the 13-day EMA and MACD-Histogram are rising (you don't have permission to sell). A red price bar indicates that the bears have taken control because the 13-day EMA and MACD Histogram are falling (you don't have permission to buy). A blue price bar indicates mixed technical signals, with neither buying nor selling pressure predominating (either both buying or selling are permitted).
2. Another "extra feature" included here is the " Keltner Channels ". Keltner Channels are volatility-based envelopes set above and below an exponential moving average.
3. It were also included a couple of EMAs.
Everything can be removed from the chart any time.
-----------------------------------------------------------------
Options/adjustments for this indicator:
*Horizontal Distance (width) between two tops/bottoms criteria.
Refers to the horizontal distance between the MACH histogram peaks involved in the divergence
*Height of tops/bottoms criteria (for Histogram).
Refers to the difference/relation/vertical distance between the MACH HISTOGRAM peaks involved in the divergence: 1st Histogram Peak is X times the 2nd.
*Height/Vertical deviation of tops/bottoms criteria (for Price).
Deviation refers to the difference/relation/vertical distance between the PRICE peaks involved in the divergence.
*Plot Regular Bullish Divergences?.
*Plot Regular Bearish Divergences?.
*Delete Previous Cancelled Divergences?.
*Shows a pair of EMAs.
*Shows Keltner Channels (using ATR)
Keltner Channels are volatility-based envelopes set above and below an exponential moving average.
*This indicator also has the option to show the Impulse System over the price bars/candles.

MACDh with divergences & impulse system-----------------------------------------------------------------
General Description:
This indicator ( the one on the low panel ) is a classic MACD that also shows regular divergences between its histogram and the prices. This script is special because it can be adjusted to fit several criteria when trading divergences filtering them according to the "height" and "width" of the patterns. The script also includes the "extra feature" Impulse System, which you will hardly find anywhere else in similar classic MACD histogram divergence indicators.
The indicator helps to find trend reversals, and it works on any market, any instrument, any timeframe, and any market condition (except against really strong trends that do not show any other sign of reversion yet).
Please take on consideration that divergences should be taken with caution.
-----------------------------------------------------------------
Definition of classic Bullish and Bearish divergences:
* Bearish divergences occur in uptrends identifying market tops. A classical or regular bearish divergence occurs when prices reach a new high and then pull back, with an oscillator (MACD histogram in this case) dropping below its zero line. Prices stabilize and rally to a higher high, but the oscillator reaches a lower peak than it did on a previous rally.
In the chart above (weekly charts of NKE, Nike, Inc.), in area X (around August 2021), NKE rallied to a new bull market high and MACD-Histogram rallied with it, rising above its previous peak and showing that bulls were extremely strong. In area Y, MACD-H fell below its centerline and at the same time prices punched below the zone between the two moving averages. In area Z, NKE rallied to a new bull market high, but the rally of MACD-H was feeble, reflecting the bulls’ weakness. Its downtick from peak Z completed a bearish divergence, giving a strong sell signal and auguring a nasty bear market.
* Bullish divergences , in the other hand, occur towards the ends of downtrends identifying market bottoms. A classical (also called regular) bullish divergence occurs when prices and an oscillator (MACD histogram in this case) both fall to a new low, rally, with the oscillator rising above its zero line, then both fall again. This time, prices drop to a lower low, but the oscillator traces a higher bottom than during its previous decline.
In the example in the chart above (weekly charts of NKE, Nike, Inc.), you see a bearish divergence that signaled the October 2022 bear market bottom, giving a strong buy signal right near the lows. In area A, NKE (weekly charts) appeared in a free fall. The record low A of MACD-H indicated that bears were extremely strong. In area B, MACD-H rallied above its centerline. Notice the brief rally of prices at that moment. In area C, NKE slid to a new bear market low, but MACD-H traced a much more shallow low. Its uptick completed a bullish divergence, giving a strong buy signal.
-----------------------------------------------------------------
Extra feature: Impulse System
This indicator also includes the “ Impulse System ”. The Impulse System is based on two indicators, a 13-day exponential moving average and the MACD-Histogram, and identifies inflection points where a trend speeds up or slows down. The moving average identifies the trend, while the MACD-Histogram measures momentum. This unique indicator combination is color coded into the price bars or macd histogram bars for easy reference.
Calculation:
Green Price Bar: (13-period EMA > previous 13-period EMA) and
(MACD-Histogram > previous period's MACD-Histogram)
Red Price Bar: (13-period EMA < previous 13-period EMA) and
(MACD-Histogram < previous period's MACD-Histogram)
Histogram bars are colored blue when conditions for a Red Histogram Bar or Green Histogram Bar are not met. The MACD-Histogram is based on MACD(12,26,9).
The Impulse System works more like a censorship system. Green histogram bars show that the bulls are in control of both trend and momentum as both the 13-day EMA and MACD-Histogram are rising (you don't have permission to sell). A red histogram bar indicates that the bears have taken control because the 13-day EMA and MACD Histogram are falling (you don't have permission to buy). A blue histogram bar indicates mixed technical signals, with neither buying nor selling pressure predominating (either both buying or selling are permitted).
The impulse system can be removed from the chart any time.
-----------------------------------------------------------------
Options/adjustments for this indicator:
*Horizontal Distance (width) between two tops/bottoms criteria.
Refers to the horizontal distance between the MACH histogram peaks involved in the divergence
*Height of tops/bottoms criteria (for Histogram).
Refers to the difference/relation/vertical distance between the MACH HISTOGRAM peaks involved in the divergence: 1st Histogram Peak is X times the 2nd.
*Height/Vertical deviation of tops/bottoms criteria (for Price).
Deviation refers to the difference/relation/vertical distance between the PRICE peaks involved in the divergence.
*Plot Regular Bullish Divergences?.
*Plot Regular Bearish Divergences?.
*Delete Previous Cancelled Divergences?.
*This indicator also has the option to show the Impulse System over the MACD histogram bars

UFO + Realtime Divergences (UO x MFI)UFO + Realtime Divergences (UO x MFI) + Alerts
The UFO is a hybrid of two powerful oscillators - the Ultimate Oscillator (UO) and the Money Flow Index (MFI)
Features of the UFO include:
- Optional divergence lines drawn directly onto the oscillator in realtime.
- Configurable alerts to notify you when divergences occur, as well as centerline crossovers.
- Configurable lookback periods to fine tune the divergences drawn in order to suit different trading styles and timeframes.
- Background colouring option to indicate when the oscillator has crossed its centerline.
- Alternate timeframe feature allows you to configure the oscillator to use data from a different timeframe than the chart it is loaded on.
- 2x MTF triple-timeframe Stochastic RSI overbought and oversold confluence signals painted at the top of the panel for use as a confluence for reversal entry trades.
The core calculations of the UFO+ combine the factory settings of the Ultimate Oscillator and Money Flow Index, taking an average of their combined values for its output eg:
UO_Value + MFI_Value / 2
The result is a powerful oscillator capable of detecting high quality divergences, including on very low timeframes and highly volatile markets, it benefits from the higher weighting of the most recent price action provided by the Ultimate Oscillators calculations, as well as the calculation of the MFI, which incorporates volume data. The UFO and its incorporated 2x triple-timeframe MTF Stoch RSI overbought and oversold signals makes it well adapted for low timeframe scalping and regular divergence trades in particular.
The Ultimate Oscillator (UO)
Tradingview describes the Ultimate Oscillator as follows:
“The Ultimate Oscillator indicator (UO) is a technical analysis tool used to measure momentum across three varying timeframes. The problem with many momentum oscillators is that after a rapid advance or decline in price, they can form false divergence trading signals. For example, after a rapid rise in price, a bearish divergence signal may present itself, however price continues to rise. The Ultimate Oscillator attempts to correct this by using multiple timeframes in its calculation as opposed to just one timeframe which is what is used in most other momentum oscillators.”
You can read more about the UO and its calculations here
The Money Flow Index ( MFI )
Investopedia describes the True Strength Indicator as follows:
“The Money Flow Index ( MFI ) is a technical oscillator that uses price and volume data for identifying overbought or oversold signals in an asset. It can also be used to spot divergences which warn of a trend change in price. The oscillator moves between 0 and 100. Unlike conventional oscillators such as the Relative Strength Index ( RSI ), the Money Flow Index incorporates both price and volume data, as opposed to just price. For this reason, some analysts call MFI the volume-weighted RSI .”
You can read more about the MFI and its calculations here
The Stochastic RSI (relating to the built-in MTF Stoch RSI feature)
The popular oscillator has been described as follows:
“The Stochastic RSI is an indicator used in technical analysis that ranges between zero and one (or zero and 100 on some charting platforms) and is created by applying the Stochastic oscillator formula to a set of relative strength index ( RSI ) values rather than to standard price data. Using RSI values within the Stochastic formula gives traders an idea of whether the current RSI value is overbought or oversold. The Stochastic RSI oscillator was developed to take advantage of both momentum indicators in order to create a more sensitive indicator that is attuned to a specific security's historical performance rather than a generalized analysis of price change.”
You can read more about the Stochastic RSI and its calculations here
How do traders use overbought and oversold levels in their trading?
The oversold level, that is when the Stochastic RSI is above the 80 level is typically interpreted as being 'overbought', and below the 20 level is typically considered 'oversold'. Traders will often use the Stochastic RSI at an overbought level as a confluence for entry into a short position, and the Stochastic RSI at an oversold level as a confluence for an entry into a long position. These levels do not mean that price will necessarily reverse at those levels in a reliable way, however. This is why this version of the Stoch RSI employs the triple timeframe overbought and oversold confluence, in an attempt to add a more confluence and reliability to this usage of the Stoch RSI .
What are divergences?
Divergence is when the price of an asset is moving in the opposite direction of a technical indicator, such as an oscillator, or is moving contrary to other data. Divergence warns that the current price trend may be weakening, and in some cases may lead to the price changing direction.
There are 4 main types of divergence, which are split into 2 categories;
regular divergences and hidden divergences. Regular divergences indicate possible trend reversals, and hidden divergences indicate possible trend continuation.
Regular bullish divergence: An indication of a potential trend reversal, from the current downtrend, to an uptrend.
Regular bearish divergence: An indication of a potential trend reversal, from the current uptrend, to a downtrend.
Hidden bullish divergence: An indication of a potential uptrend continuation.
Hidden bearish divergence: An indication of a potential downtrend continuation.
How do traders use divergences in their trading?
A divergence is considered a leading indicator in technical analysis , meaning it has the ability to indicate a potential price move in the short term future.
Hidden bullish and hidden bearish divergences, which indicate a potential continuation of the current trend are sometimes considered a good place for traders to begin, since trend continuation occurs more frequently than reversals, or trend changes.
When trading regular bullish divergences and regular bearish divergences, which are indications of a trend reversal, the probability of it doing so may increase when these occur at a strong support or resistance level . A common mistake new traders make is to get into a regular divergence trade too early, assuming it will immediately reverse, but these can continue to form for some time before the trend eventually changes, by using forms of support or resistance as an added confluence, such as when price reaches a moving average, the success rate when trading these patterns may increase.
Typically, traders will manually draw lines across the swing highs and swing lows of both the price chart and the oscillator to see whether they appear to present a divergence, this indicator will draw them for you, quickly and clearly, and can notify you when they occur.
Setting alerts.
With this indicator you can set alerts to notify you when any/all of the above types of divergences occur, on any chart timeframe you choose.
Configurable pivot period.
You can adjust the default pivot lookback values to suit your prefered trading style and timeframe. If you like to trade a shorter time frame, lowering the default lookback values will make the divergences drawn more sensitive to short term price action.
Disclaimer: This script includes code from the stock UO and MFI by Tradingview as well as the Divergence for Many Indicators v4 by LonesomeTheBlue.

SuperTrend Weighted by Divergence█ OVERVIEW
SuperTrend Weighted by Divergence is a trend-following indicator based on the classic SuperTrend, enhanced with dynamic ATR weighting driven by divergences. Its key feature is adaptive behavior: when a divergence appears, the indicator temporarily reduces the ATR multiplier, allowing the trend line to react faster to potential market reversals.
The indicator remains clean, visually clear, and well suited for traders who want to combine trend-following with early detection of weakening momentum.
█ CONCEPT
One of the biggest drawbacks of trend indicators is their lagging nature, caused by the characteristics of source data. Classic SuperTrends react only after the trend has already developed, which often leads to late entries or exits.
The idea behind SuperTrend Weighted by Divergence is to introduce dynamic adjustment of the trend line in response to the first signs of trend weakening.
Instead of treating ATR as a constant volatility buffer, the indicator temporarily modifies its impact when the market sends warning signals in the form of price–oscillator divergences.
For divergence detection, a hidden auxiliary oscillator called “MPO4 Lines – Modal Engine” (default settings) is used. This oscillator is not displayed on the chart – only the points where divergences are detected are shown as markers on price bars.
Divergences do not generate direct entry signals; they are used solely to temporarily adjust the behavior of the SuperTrend.
If, after detecting a divergence against the current trend, a divergence in line with the trend appears, the previous divergence is invalidated and the SuperTrend returns to its standard behavior (base ATR multiplier).
█ FEATURES
Data sources:
- ATR (Average True Range)
- Reference point: HL2 (high/low average)
- MPO4 Lines – Modal Engine oscillator (hidden, used only for divergence detection)
Divergence logic:
- Bullish divergence: lower low in price + higher low in the oscillator
- Bearish divergence: higher high in price + lower high in the oscillator
- Divergences are detected using pivots (left/right)
- Divergence detection is delayed by the pivot length, as confirmation requires a fixed number of bars on the right side
Divergence impact:
- After a divergence is detected, the ATR multiplier is reduced
- The reduction strength is controlled by Divergence Sensitivity
- The effect is active only for a limited number of bars – 200 bars by default (divBars)
- The effect is canceled on trend change or when a trend-aligned divergence appears
Trend change logic:
- Trend changes only after a confirmed close beyond the trailing line
- No repainting
- Trend lines break at reversal points
Visual signals:
- “Buy” and “Sell” labels only on confirmed trend changes
- Optional bar coloring based on current trend (Color bars by trend)
- Soft fill between price and the trend line
- Divergence markers (dots above/below bars) shown at the point of divergence detection, not across the entire divergence structure
Alerts:
- Buy Signal – trend change to bullish
- Sell Signal – trend change to bearish
- Bullish Divergence
- Bearish Divergence
█ HOW TO USE
Adding the indicator:
Paste the code into Pine Editor or search for “SuperTrend Weighted by Divergence” on TradingView
Main settings:
- ATR Length – ATR period
- Base ATR Multiplier – base SuperTrend width
- Pivot Length – divergence sensitivity and detection delay
- Divergence Sensitivity – strength of divergence impact (0.0–1.0)
- Color bars by trend – enable / disable bar coloring
- Line and fill colors – fully customizable
Interpretation:
- Green line and bars = uptrend
- Red line and bars = downtrend
- Divergence against the trend = possible weakening and faster SuperTrend reaction
- Trend-aligned divergence = return to standard SuperTrend behavior
- No divergence = classic, stable SuperTrend behavior
█ APPLICATIONS
Ideal for:
- Trend-following
Entering positions only in the direction of the current trend, using the SuperTrend as a directional filter.
- Early detection of trend weakness
Repeated divergences against the trend may indicate decreasing momentum and a potential upcoming reversal.
- Markets with variable dynamics (crypto, indices, forex)
Entries based on trend changes, preferably confirmed by other tools such as Fibonacci levels, RSI, support/resistance, or market structure.
- Scalping, day trading, and swing trading (with parameter adjustments)
Increasing Divergence Sensitivity to around 0.4–0.5 produces many more signals on small, often short-lived moves.
These settings work well for scalping and day trading, but are not ideal for swing trading, as they tend to generate more false signals and frequent trend changes.
█ NOTES
- Works on all markets and timeframes
- Divergences are used to adapt SuperTrend behavior, not as standalone entry signals
- Higher Divergence Sensitivity = faster reaction and more signals
- Lower Divergence Sensitivity = smoother trend and fewer changes
- Best results are achieved by tuning parameters to the instrument and trading style

MADALGO`s Enhanced OBV DivergencesDescription:
MADALGO's Enhanced OBV Divergences indicator is a unique tool designed for traders to visualize the divergences between price action and On Balance Volume (OBV), a fundamental aspect often indicative of underlying strength or weakness in the market. By keenly identifying these divergences, traders are better positioned to anticipate potential trend reversals or trend continuations, making this script an invaluable addition to their technical analysis toolkit.
This script meticulously scans for both regular and hidden bullish/bearish divergences, providing a comprehensive view of market sentiment. The core of this indicator is built around the OBV, which cumulatively adds or subtracts volume based on the price movement per period, thus providing a running total of volume and portraying the force behind the price movements.
The regular divergences are classic indicators of a potential reversal in the current trend, while hidden divergences are often indicative of trend continuation. These divergences are pinpointed based on the relative positions of the OBV and price highs/lows, over customizable lookback periods and within specified lookback ranges.
Features:
Regular and Hidden Divergences: Clearly marked bullish and bearish divergences provide insights into potential market turning points.
On Balance Volume (OBV) Line: Visualize the continuous flow of buying and selling pressure, enabling the identification of accumulation or distribution phases essential for understanding the market's strength or weakness.
Moving Average of OBV: An optional feature to smooth the OBV line, aiding in the identification of the overarching trend.
Dynamic Statistics Label: A floating label provides real-time updates on essential statistics like the Rate of Percentage Change (RPC) of OBV, the last divergences, and bars since the last divergences.
Inputs:
Pivot Lookback Right and Pivot Lookback Left: Define the lookback periods for identifying pivot points in the OBV line.
Max of Lookback Range and Min of Lookback Range: Define the range for considering divergences.
RPC Period: Defines the period for calculating the Rate of Percentage Change of the OBV.
MA Period: Defines the period for the optional moving average of the OBV.
Plot Bullish, Plot Hidden Bullish, Plot Bearish, Plot Hidden Bearish: Toggle visibility of respective divergences.
Plot Moving Average: Toggle visibility of the OBV moving average.
Usage:
Add the script to your TradingView chart.
Tailor the input parameters in the settings panel to align with your analysis requirements.
The divergences, OBV line, and optional moving average will be plotted on your chart, with a dynamic label displaying real-time statistics.
Set up alerts to be notified of identified divergences, enabling timely decision-making.
Alerts:
Regular bullish/bearish divergence in OBV found: Triggered when a regular bullish or bearish divergence is identified.
Hidden bullish/bearish divergence in OBV found: Triggered when a hidden bullish or bearish divergence is identified.
Underlying Concepts:
The OBV Divergences indicator is rooted in the principle that volume precedes price movement. When prices are rising with increased volume, it suggests that buying pressure is prevailing and may lead to continued upward momentum. Conversely, rising prices with decreasing volume might indicate a lack of buying conviction and could signal a potential price reversal. The identification of divergences between price and OBV can therefore serve as a powerful signal for traders. These examples can be seen below in the image
The Moving Average of the OBV further aids in understanding the prevailing trend by smoothing out the OBV line, providing a clearer picture of the market's longer-term momentum. The Rate of Percentage Change (RPC) provides insight into the momentum of volume, offering an additional layer of analysis. Together, these additional features enhance the core OBV analysis, enabling a more nuanced understanding of volume dynamics fundamental for making more informed trading decisions.
License:
This Source Code Form is subject to the terms of the Mozilla Public License, v. 2.0. If a copy of the MPL was not distributed with this file, you can obtain one at Mozilla Public License 2.0.

RSI Divergences on price chart - Open Source CodeHello Traders,
I have some exciting news to share with you all! Recently, I came across an incredible RSI divergences indicator developed by Socrate_FR. This indicator, in my opinion has an exceptional accuracy in detecting RSI divergences. However, during my exploration of other indicators in the TradingView library that display signals on the price chart, I found that many of them were often unreliable and missed out on important divergences.One such example is the Prices / RSI Divergences Detector by vtllr. Although vtllr did an amazing job with the indicator, I noticed that it didn't capture several relevant divergences accurately.
This observation inspired me to enhance the most accurate RSI divergences indicator available by showcasing the signals directly on the price chart. By doing so, I aimed to address the issue of unreliable and missed divergences in other price chart indicators. With this enhanced version, you can now effortlessly identify and track RSI regular divergences on the price chart itself:
-Regular bullish divergence occurs when the price forms lower lows while the RSI indicator forms higher lows. It suggests a potential bullish reversal (green line plot)
-Regular bearish divergence occurs when the price forms higher highs while the RSI indicator forms lower highs. It suggests a potential bearish reversal (red line plot)
Another key mofication:
This Indicator introduces a simpler approach compared to the original Socrate indicator. While Socrate differentiated divergences into eight types for both bullish and bearish scenarios, our enhanced version focuses on two distinct categories: small and big divergences. This decision was made to provide a clearer and more user-friendly experience. By condensing the divergence types into two groups, traders can easily identify and analyze the significance of the divergences without getting overwhelmed by excessive variations. The small divergences represent relatively minor divergences, while the big divergences indicate stronger and more significant signals.
-Small divergences represent relatively minor divergences (plotshape small circle)
-Big divergences indicate stronger signals (plotshape big circle)
I firmly believe that this enhanced RSI Divergences Indicator will be an invaluable tool for traders who rely on RSI analysis in their trading strategies. It combines the accuracy of Socrate_FR's original indicator with the enhanced visibility of signals on the price chart, ensuring you never miss any important divergences.
If you're interested in trying out this enhanced version of the indicator, please feel free to access the open-source code. If you want to visit and try the original version of the code visit Socrate_FR profile.
www.tradingview.com
Keep attention!
It is important to note that no trading indicator or strategy is foolproof, and there is always a risk of losses in trading. While this indicator may provide useful information for making conclusions, it should not be used as the sole basis for making trading decisions. Traders should always use proper risk management techniques and consider multiple factors when making trading decisions.
Support us:)
If you find this new indicator helpful in your trading analysis, I would greatly appreciate your support! Please consider to follow, giving it a like, leaving feedback, or sharing it with your trading network. Your engagement will not only help me improve this tool but will also help other traders discover it and benefit from its features. Thank you for your support!

RSI Divergences (Regular, Hidden, Exaggerated)RSI Divergences (Regular, Hidden, Exaggerated)
This indicator detects and visually highlights all major types of RSI divergences on your chart: Regular, Hidden, and Exaggerated divergences, both bullish and bearish.
Key Features:
Calculates RSI based on a user-defined length and timeframe that automatically matches your chart's timeframe.
Identifies pivot highs and lows on both price and RSI using customizable pivot left/right bars.
Detects divergences when RSI and price movements disagree, signaling potential trend reversals or continuation.
Differentiates between three types of divergences:
Regular Divergence: Classic signal for possible trend reversal.
Hidden Divergence: Often indicates trend continuation.
Exaggerated Divergence: A less common form signaling momentum changes.
Draws clear colored lines and labels on the RSI pane for each divergence, using green for bullish and red for bearish signals.
Includes RSI overbought (70) and oversold (30) bands with gradient fills to help visualize RSI zones.
Efficient use of arrays to track pivots and manage plotting history for smooth performance.
Usage:
Ideal for traders looking to leverage RSI divergences for better timing entries and exits in trending and range-bound markets. The script is fully customizable and works seamlessly across different timeframes

CVD Divergences (cdikici71 x tncylyv)CVD Divergence
Summary
This indicator brings the powerful and creative divergence detection logic from @cdikici71's popular "cd_RSI_Divergence_Cx" script to the world of volume analysis.
While RSI is a fantastic momentum tool, I personally choose to rely on volume as a primary source of truth. This script was born from the desire to see how true buying and selling pressure—measured by Cumulative Volume Delta (CVD)—diverges from price action. It takes the brilliant engine built by @cdikici71 and applies it to CVD, offering a unique look into market conviction.
What is Cumulative Volume Delta (CVD)?
CVD is a running total of volume that transacted at the ask price (buying) minus volume that transacted at the bid price (selling). In simple terms, it shows whether buyers or sellers have been more aggressive over a period. A rising CVD suggests net buying pressure, while a falling CVD suggests net selling pressure.
Core Features
• Divergence Engine by @cdikici71: The script uses the exact same two powerful methods for finding divergences as the original RSI version:
o Alignment with HTF Sweep: The default, cleaner method for finding high-probability divergences.
o All: A more sensitive method that finds all possible divergences.
• Anchored CVD Periods: You can choose to reset the CVD calculation on a Daily, Weekly, or Monthly basis to analyze buying and selling pressure within specific periods. Or, you can leave it on Continuous to see the all-time flow.
• Automatic Higher Timeframe (HTF) Alignment: To remove the guesswork, the "Auto-Align HTF" option will automatically select a logical higher timeframe for divergence analysis based on your current chart (e.g., 15m chart uses 4H for divergence, 1H chart uses 1D, etc.). You can also turn this off for full manual control.
• Fully Customizable Information Table: An on-screen table keeps you updated on the divergence status. You can easily adjust its Position and Size in the settings to fit your chart layout.
• Built-in Alerts: Alerts are configured for both Bullish and Bearish divergences to notify you as soon as they occur.
How to Use This Indicator
The principle is the same as any divergence strategy, but with the conviction of volume behind it.
• 🔴 Bearish Divergence: Price makes a Higher High, but the CVD makes a Lower High or an equal high. This suggests that the buying pressure is weakening and may not be strong enough to support the new price high.
• 🟢 Bullish Divergence: Price makes a Lower Low, but the CVD makes a Higher Low or an equal low. This suggests that selling pressure is exhausting and the market may be ready for a reversal.
Always use divergence signals as a confluence with your own analysis, support/resistance levels, and market structure.
Huge Thanks and Credit
This script would not exist without the brilliant and creative work of @cdikici71. The entire divergence detection engine, the visualization style, and the core logic are based on his original masterpiece, "cd_RSI_Divergence_Cx". I have simply adapted his framework to a different data source.
If you find this indicator useful, please go and show your support for his original work!
________________________________________
Disclaimer: This is a tool for analysis, not a financial advice signal service. Please use it responsibly as part of a complete trading strategy.

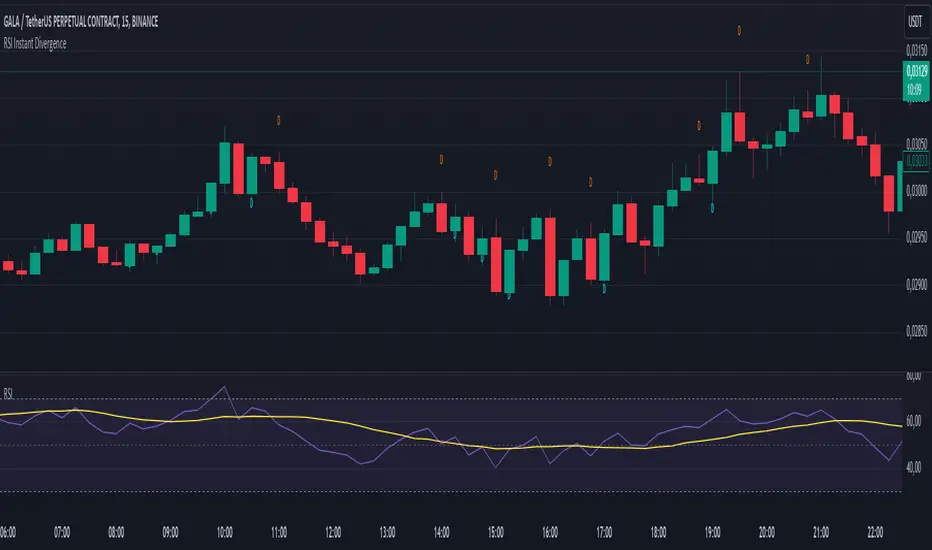
RSI Instant DivergenceThis script detects RSI divergence—a common signal indicating potential trend reversals. It compares price action and RSI behavior to identify two types of divergences:
1- Bearish Divergence (Sell Signal):
Occurs when the price forms a higher high while RSI drops (weaker momentum).
A label appears above the candle, and an alert is triggered: "Divergence: Sell Signal."
2 -Bullish Divergence (Buy Signal):
Occurs when the price makes a lower low while RSI rises (stronger momentum).
A label appears below the candle, and an alert is triggered: "Divergence: Buy Signal."
The labels are color-coded (orange for sell, blue for buy) and include detailed RSI and price info in a tooltip. Alerts help you act immediately when divergence is detected.
This tool is perfect for spotting potential trend reversals and refining your entry/exit strategy. Let me know if you'd like to customize it further! 😊
Tooltip Feature: Each label includes a tooltip with precise RSI and price details (current and previous values) as well as the percentage change in RSI, giving you deeper insight into the divergence. This tool is great for identifying trend reversal points and includes visual labels, tooltips, and alerts to make real-time trading decisions easier. Let me know if you’d like adjustments!
Ultimate RSI [captainua]Ultimate RSI
Overview
This indicator combines multiple RSI calculations with volume analysis, divergence detection, and trend filtering to provide a comprehensive RSI-based trading system. The script calculates RSI using three different periods (6, 14, 24) and applies various smoothing methods to reduce noise while maintaining responsiveness. The combination of these features creates a multi-layered confirmation system that reduces false signals by requiring alignment across multiple indicators and timeframes.
The script includes optimized configuration presets for instant setup: Scalping, Day Trading, Swing Trading, and Position Trading. Simply select a preset to instantly configure all settings for your trading style, or use Custom mode for full manual control. All settings include automatic input validation to prevent configuration errors and ensure optimal performance.
Configuration Presets
The script includes preset configurations optimized for different trading styles, allowing you to instantly configure the indicator for your preferred trading approach. Simply select a preset from the "Configuration Preset" dropdown menu:
- Scalping: Optimized for fast-paced trading with shorter RSI periods (4, 7, 9) and minimal smoothing. Noise reduction is automatically disabled, and momentum confirmation is disabled to allow faster signal generation. Designed for quick entries and exits in volatile markets.
- Day Trading: Balanced configuration for intraday trading with moderate RSI periods (6, 9, 14) and light smoothing. Momentum confirmation is enabled for better signal quality. Ideal for day trading strategies requiring timely but accurate signals.
- Swing Trading: Configured for medium-term positions with standard RSI periods (14, 14, 21) and moderate smoothing. Provides smoother signals suitable for swing trading timeframes. All noise reduction features remain active.
- Position Trading: Optimized for longer-term trades with extended RSI periods (24, 21, 28) and heavier smoothing. Filters are configured for highest-quality signals. Best for position traders holding trades over multiple days or weeks.
- Custom: Full manual control over all settings. All input parameters are available for complete customization. This is the default mode and maintains full backward compatibility with previous versions.
When a preset is selected, it automatically adjusts RSI periods, smoothing lengths, and filter settings to match the trading style. The preset configurations ensure optimal settings are applied instantly, eliminating the need for manual configuration. All settings can still be manually overridden if needed, providing flexibility while maintaining ease of use.
Input Validation and Error Prevention
The script includes comprehensive input validation to prevent configuration errors:
- Cross-Input Validation: Smoothing lengths are automatically validated to ensure they are always less than their corresponding RSI period length. If you set a smoothing length greater than or equal to the RSI length, the script automatically adjusts it to (RSI Length - 1). This prevents logical errors and ensures valid configurations.
- Input Range Validation: All numeric inputs have minimum and maximum value constraints enforced by TradingView's input system, preventing invalid parameter values.
- Smart Defaults: Preset configurations use validated default values that are tested and optimized for each trading style. When switching between presets, all related settings are automatically updated to maintain consistency.
Core Calculations
Multi-Period RSI:
The script calculates RSI using the standard Wilder's RSI formula: RSI = 100 - (100 / (1 + RS)), where RS = Average Gain / Average Loss over the specified period. Three separate RSI calculations run simultaneously:
- RSI(6): Uses 6-period lookback for high sensitivity to recent price changes, useful for scalping and early signal detection
- RSI(14): Standard 14-period RSI for balanced analysis, the most commonly used RSI period
- RSI(24): Longer 24-period RSI for trend confirmation, provides smoother signals with less noise
Each RSI can be smoothed using EMA, SMA, RMA (Wilder's smoothing), WMA, or Zero-Lag smoothing. Zero-Lag smoothing uses the formula: ZL-RSI = RSI + (RSI - RSI ) to reduce lag while maintaining signal quality. You can apply individual smoothing lengths to each RSI period, or use global smoothing where all three RSIs share the same smoothing length.
Dynamic Overbought/Oversold Thresholds:
Static thresholds (default 70/30) are adjusted based on market volatility using ATR. The formula: Dynamic OB = Base OB + (ATR × Volatility Multiplier × Base Percentage / 100), Dynamic OS = Base OS - (ATR × Volatility Multiplier × Base Percentage / 100). This adapts to volatile markets where traditional 70/30 levels may be too restrictive. During high volatility, the dynamic thresholds widen, and during low volatility, they narrow. The thresholds are clamped between 0-100 to remain within RSI bounds. The ATR is cached for performance optimization, updating on confirmed bars and real-time bars.
Adaptive RSI Calculation:
An adaptive RSI adjusts the standard RSI(14) based on current volatility relative to average volatility. The calculation: Adaptive Factor = (Current ATR / SMA of ATR over 20 periods) × Volatility Multiplier. If SMA of ATR is zero (edge case), the adaptive factor defaults to 0. The adaptive RSI = Base RSI × (1 + Adaptive Factor), clamped to 0-100. This makes the indicator more responsive during high volatility periods when traditional RSI may lag. The adaptive RSI is used for signal generation (buy/sell signals) but is not plotted on the chart.
Overbought/Oversold Fill Zones:
The script provides visual fill zones between the RSI line and the threshold lines when RSI is in overbought or oversold territory. The fill logic uses inclusive conditions: fills are shown when RSI is currently in the zone OR was in the zone on the previous bar. This ensures complete coverage of entry and exit boundaries. A minimum gap of 0.1 RSI points is maintained between the RSI plot and threshold line to ensure reliable polygon rendering in TradingView. The fill uses invisible plots at the threshold levels and the RSI value, with the fill color applied between them. You can select which RSI (6, 14, or 24) to use for the fill zones.
Divergence Detection
Regular Divergence:
Bullish divergence: Price makes a lower low (current low < lowest low from previous lookback period) while RSI makes a higher low (current RSI > lowest RSI from previous lookback period). Bearish divergence: Price makes a higher high (current high > highest high from previous lookback period) while RSI makes a lower high (current RSI < highest RSI from previous lookback period). The script compares current price/RSI values to the lowest/highest values from the previous lookback period using ta.lowest() and ta.highest() functions with index to reference the previous period's extreme.
Pivot-Based Divergence:
An enhanced divergence detection method that uses actual pivot points instead of simple lowest/highest comparisons. This provides more accurate divergence detection by identifying significant pivot lows/highs in both price and RSI. The pivot-based method uses a tolerance-based approach with configurable constants: 1% tolerance for price comparisons (priceTolerancePercent = 0.01) and 1.0 RSI point absolute tolerance for RSI comparisons (pivotTolerance = 1.0). Minimum divergence threshold is 1.0 RSI point (minDivergenceThreshold = 1.0). It looks for two recent pivot points and compares them: for bullish divergence, price makes a lower low (at least 1% lower) while RSI makes a higher low (at least 1.0 point higher). This method reduces false divergences by requiring actual pivot points rather than just any low/high within a period. When enabled, pivot-based divergence replaces the traditional method for more accurate signal generation.
Strong Divergence:
Regular divergence is confirmed by an engulfing candle pattern. Bullish engulfing requires: (1) Previous candle is bearish (close < open ), (2) Current candle is bullish (close > open), (3) Current close > previous open, (4) Current open < previous close. Bearish engulfing is the inverse: previous bullish, current bearish, current close < previous open, current open > previous close. Strong divergence signals are marked with visual indicators (🐂 for bullish, 🐻 for bearish) and have separate alert conditions.
Hidden Divergence:
Continuation patterns that signal trend continuation rather than reversal. Bullish hidden divergence: Price makes a higher low (current low > lowest low from previous period) but RSI makes a lower low (current RSI < lowest RSI from previous period). Bearish hidden divergence: Price makes a lower high (current high < highest high from previous period) but RSI makes a higher high (current RSI > highest RSI from previous period). These patterns indicate the trend is likely to continue in the current direction.
Volume Confirmation System
Volume threshold filtering requires current volume to exceed the volume SMA multiplied by the threshold factor. The formula: Volume Confirmed = Volume > (Volume SMA × Threshold). If the threshold is set to 0.1 or lower, volume confirmation is effectively disabled (always returns true). This allows you to use the indicator without volume filtering if desired.
Volume Climax is detected when volume exceeds: Volume SMA + (Volume StdDev × Multiplier). This indicates potential capitulation moments where extreme volume accompanies price movements. Volume Dry-Up is detected when volume falls below: Volume SMA - (Volume StdDev × Multiplier), indicating low participation periods that may produce unreliable signals. The volume SMA is cached for performance, updating on confirmed and real-time bars.
Multi-RSI Synergy
The script generates signals when multiple RSI periods align in overbought or oversold zones. This creates a confirmation system that reduces false signals. In "ALL" mode, all three RSIs (6, 14, 24) must be simultaneously above the overbought threshold OR all three must be below the oversold threshold. In "2-of-3" mode, any two of the three RSIs must align in the same direction. The script counts how many RSIs are in each zone: twoOfThreeOB = ((rsi6OB ? 1 : 0) + (rsi14OB ? 1 : 0) + (rsi24OB ? 1 : 0)) >= 2.
Synergy signals require: (1) Multi-RSI alignment (ALL or 2-of-3), (2) Volume confirmation, (3) Reset condition satisfied (enough bars since last synergy signal), (4) Additional filters passed (RSI50, Trend, ADX, Volume Dry-Up avoidance). Separate reset conditions track buy and sell signals independently. The reset condition uses ta.barssince() to count bars since the last trigger, returning true if the condition never occurred (allowing first signal) or if enough bars have passed.
Regression Forecasting
The script uses historical RSI values to forecast future RSI direction using four methods. The forecast horizon is configurable (1-50 bars ahead). Historical data is collected into an array, and regression coefficients are calculated based on the selected method.
Linear Regression: Calculates the least-squares fit line (y = mx + b) through the last N RSI values. The calculation: meanX = sumX / horizon, meanY = sumY / horizon, denominator = sumX² - horizon × meanX², m = (sumXY - horizon × meanX × meanY) / denominator, b = meanY - m × meanX. The forecast projects this line forward: forecast = b + m × i for i = 1 to horizon.
Polynomial Regression: Fits a quadratic curve (y = ax² + bx + c) to capture non-linear trends. The system of equations is solved using Cramer's rule with a 3×3 determinant. If the determinant is too small (< 0.0001), the system falls back to linear regression. Coefficients are calculated by solving: n×c + sumX×b + sumX²×a = sumY, sumX×c + sumX²×b + sumX³×a = sumXY, sumX²×c + sumX³×b + sumX⁴×a = sumX²Y. Note: Due to the O(n³) computational complexity of polynomial regression, the forecast horizon is automatically limited to a maximum of 20 bars when using polynomial regression to maintain optimal performance. If you set a horizon greater than 20 bars with polynomial regression, it will be automatically capped at 20 bars.
Exponential Smoothing: Applies exponential smoothing with adaptive alpha = 2/(horizon+1). The smoothing iterates from oldest to newest value: smoothed = alpha × series + (1 - alpha) × smoothed. Trend is calculated by comparing current smoothed value to an earlier smoothed value (at 60% of horizon): trend = (smoothed - earlierSmoothed) / (horizon - earlierIdx). Forecast: forecast = base + trend × i.
Moving Average: Uses the difference between short MA (horizon/2) and long MA (horizon) to estimate trend direction. Trend = (maShort - maLong) / (longLen - shortLen). Forecast: forecast = maShort + trend × i.
Confidence bands are calculated using RMSE (Root Mean Squared Error) of historical forecast accuracy. The error calculation compares historical values with forecast values: RMSE = sqrt(sumSquaredError / count). If insufficient data exists, it falls back to calculating standard deviation of recent RSI values. Confidence bands = forecast ± (RMSE × confidenceLevel). All forecast values and confidence bands are clamped to 0-100 to remain within RSI bounds. The regression functions include comprehensive safety checks: horizon validation (must not exceed array size), empty array handling, edge case handling for horizon=1 scenarios, division-by-zero protection, and bounds checking for all array access operations to prevent runtime errors.
Strong Top/Bottom Detection
Strong buy signals require three conditions: (1) RSI is at its lowest point within the bottom period: rsiVal <= ta.lowest(rsiVal, bottomPeriod), (2) RSI is below the oversold threshold minus a buffer: rsiVal < (oversoldThreshold - rsiTopBottomBuffer), where rsiTopBottomBuffer = 2.0 RSI points, (3) The absolute difference between current RSI and the lowest RSI exceeds the threshold value: abs(rsiVal - ta.lowest(rsiVal, bottomPeriod)) > threshold. This indicates a bounce from extreme levels with sufficient distance from the absolute low.
Strong sell signals use the inverse logic: RSI at highest point, above overbought threshold + rsiTopBottomBuffer (2.0 RSI points), and difference from highest exceeds threshold. Both signals also require: volume confirmation, reset condition satisfied (separate reset for buy vs sell), and all additional filters passed (RSI50, Trend, ADX, Volume Dry-Up avoidance).
The reset condition uses separate logic for buy and sell: resetCondBuy checks bars since isRSIAtBottom, resetCondSell checks bars since isRSIAtTop. This ensures buy signals reset based on bottom conditions and sell signals reset based on top conditions, preventing incorrect signal blocking.
Filtering System
RSI(50) Filter: Only allows buy signals when RSI(14) > 50 (bullish momentum) and sell signals when RSI(14) < 50 (bearish momentum). This filter ensures you're buying in uptrends and selling in downtrends from a momentum perspective. The filter is optional and can be disabled. Recommended to enable for noise reduction.
Trend Filter: Uses a long-term EMA (default 200) to determine trend direction. Buy signals require price above EMA, sell signals require price below EMA. The EMA slope is calculated as: emaSlope = ema - ema . Optional EMA slope filter additionally requires the EMA to be rising (slope > 0) for buy signals or falling (slope < 0) for sell signals. This provides stronger trend confirmation by requiring both price position and EMA direction.
ADX Filter: Uses the Directional Movement Index (calculated via ta.dmi()) to measure trend strength. Signals only fire when ADX exceeds the threshold (default 20), indicating a strong trend rather than choppy markets. The ADX calculation uses separate length and smoothing parameters. This filter helps avoid signals during sideways/consolidation periods.
Volume Dry-Up Avoidance: Prevents signals during periods of extremely low volume relative to average. If volume dry-up is detected and the filter is enabled, signals are blocked. This helps avoid unreliable signals that occur during low participation periods.
RSI Momentum Confirmation: Requires RSI to be accelerating in the signal direction before confirming signals. For buy signals, RSI must be consistently rising (recovering from oversold) over the lookback period. For sell signals, RSI must be consistently falling (declining from overbought) over the lookback period. The momentum check verifies that all consecutive changes are in the correct direction AND the cumulative change is significant. This filter ensures signals only fire when RSI momentum aligns with the signal direction, reducing false signals from weak momentum.
Multi-Timeframe Confirmation: Requires higher timeframe RSI to align with the signal direction. For buy signals, current RSI must be below the higher timeframe RSI by at least the confirmation threshold. For sell signals, current RSI must be above the higher timeframe RSI by at least the confirmation threshold. This ensures signals align with the larger trend context, reducing counter-trend trades. The higher timeframe RSI is fetched using request.security() from the selected timeframe.
All filters use the pattern: filterResult = not filterEnabled OR conditionMet. This means if a filter is disabled, it always passes (returns true). Filters can be combined, and all must pass for a signal to fire.
RSI Centerline and Period Crossovers
RSI(50) Centerline Crossovers: Detects when the selected RSI source crosses above or below the 50 centerline. Bullish crossover: ta.crossover(rsiSource, 50), bearish crossover: ta.crossunder(rsiSource, 50). You can select which RSI (6, 14, or 24) to use for these crossovers. These signals indicate momentum shifts from bearish to bullish (above 50) or bullish to bearish (below 50).
RSI Period Crossovers: Detects when different RSI periods cross each other. Available pairs: RSI(6) × RSI(14), RSI(14) × RSI(24), or RSI(6) × RSI(24). Bullish crossover: fast RSI crosses above slow RSI (ta.crossover(rsiFast, rsiSlow)), indicating momentum acceleration. Bearish crossover: fast RSI crosses below slow RSI (ta.crossunder(rsiFast, rsiSlow)), indicating momentum deceleration. These crossovers can signal shifts in momentum before price moves.
StochRSI Calculation
Stochastic RSI applies the Stochastic oscillator formula to RSI values instead of price. The calculation: %K = ((RSI - Lowest RSI) / (Highest RSI - Lowest RSI)) × 100, where the lookback is the StochRSI length. If the range is zero, %K defaults to 50.0. %K is then smoothed using SMA with the %K smoothing length. %D is calculated as SMA of smoothed %K with the %D smoothing length. All values are clamped to 0-100. You can select which RSI (6, 14, or 24) to use as the source for StochRSI calculation.
RSI Bollinger Bands
Bollinger Bands are applied to RSI(14) instead of price. The calculation: Basis = SMA(RSI(14), BB Period), StdDev = stdev(RSI(14), BB Period), Upper = Basis + (StdDev × Deviation Multiplier), Lower = Basis - (StdDev × Deviation Multiplier). This creates dynamic zones around RSI that adapt to RSI volatility. When RSI touches or exceeds the bands, it indicates extreme conditions relative to recent RSI behavior.
Noise Reduction System
The script includes a comprehensive noise reduction system to filter false signals and improve accuracy. When enabled, signals must pass multiple quality checks:
Signal Strength Requirement: RSI must be at least X points away from the centerline (50). For buy signals, RSI must be at least X points below 50. For sell signals, RSI must be at least X points above 50. This ensures signals only trigger when RSI is significantly in oversold/overbought territory, not just near neutral.
Extreme Zone Requirement: RSI must be deep in the OB/OS zone. For buy signals, RSI must be at least X points below the oversold threshold. For sell signals, RSI must be at least X points above the overbought threshold. This ensures signals only fire in extreme conditions where reversals are more likely.
Consecutive Bar Confirmation: The signal condition must persist for N consecutive bars before triggering. This reduces false signals from single-bar spikes or noise. The confirmation checks that the signal condition was true for all bars in the lookback period.
Zone Persistence (Optional): Requires RSI to remain in the OB/OS zone for N consecutive bars, not just touch it. This ensures RSI is truly in an extreme state rather than just briefly touching the threshold. When enabled, this provides stricter filtering for higher-quality signals.
RSI Slope Confirmation (Optional): Requires RSI to be moving in the expected signal direction. For buy signals, RSI should be rising (recovering from oversold). For sell signals, RSI should be falling (declining from overbought). This ensures momentum is aligned with the signal direction. The slope is calculated by comparing current RSI to RSI N bars ago.
All noise reduction filters can be enabled/disabled independently, allowing you to customize the balance between signal frequency and accuracy. The default settings provide a good balance, but you can adjust them based on your trading style and market conditions.
Alert System
The script includes separate alert conditions for each signal type: buy/sell (adaptive RSI crossovers), divergence (regular, strong, hidden), crossovers (RSI50 centerline, RSI period crossovers), synergy signals, and trend breaks. Each alert type has its own alertcondition() declaration with a unique title and message.
An optional cooldown system prevents alert spam by requiring a minimum number of bars between alerts of the same type. The cooldown check: canAlert = na(lastAlertBar) OR (bar_index - lastAlertBar >= cooldownBars). If the last alert bar is na (first alert), it always allows the alert. Each alert type maintains its own lastAlertBar variable, so cooldowns are independent per signal type. The default cooldown is 10 bars, which is recommended for noise reduction.
Higher Timeframe RSI
The script can display RSI from a higher timeframe using request.security(). This allows you to see the RSI context from a larger timeframe (e.g., daily RSI on an hourly chart). The higher timeframe RSI uses RSI(14) calculation from the selected timeframe. This provides context for the current timeframe's RSI position relative to the larger trend.
RSI Pivot Trendlines
The script can draw trendlines connecting pivot highs and lows on RSI(6). This feature helps visualize RSI trends and identify potential trend breaks.
Pivot Detection: Pivots are detected using a configurable period. The script can require pivots to have minimum strength (RSI points difference from surrounding bars) to filter out weak pivots. Lower minPivotStrength values detect more pivots (more trendlines), while higher values detect only stronger pivots (fewer but more significant trendlines). Pivot confirmation is optional: when enabled, the script waits N bars to confirm the pivot remains the extreme, reducing repainting. Pivot confirmation functions (f_confirmPivotLow and f_confirmPivotHigh) are always called on every bar for consistency, as recommended by TradingView. When pivot bars are not available (na), safe default values are used, and the results are then used conditionally based on confirmation settings. This ensures consistent calculations and prevents calculation inconsistencies.
Trendline Drawing: Uptrend lines connect confirmed pivot lows (green), and downtrend lines connect confirmed pivot highs (red). By default, only the most recent trendline is shown (old trendlines are deleted when new pivots are confirmed). This keeps the chart clean and uncluttered. If "Keep Historical Trendlines" is enabled, the script preserves up to N historical trendlines (configurable via "Max Trendlines to Keep", default 5). When historical trendlines are enabled, old trendlines are saved to arrays instead of being deleted, allowing you to see multiple trendlines simultaneously for better trend analysis. The arrays are automatically limited to prevent memory accumulation.
Trend Break Detection: Signals are generated when RSI breaks above or below trendlines. Uptrend breaks (RSI crosses below uptrend line) generate buy signals. Downtrend breaks (RSI crosses above downtrend line) generate sell signals. Optional trend break confirmation requires the break to persist for N bars and optionally include volume confirmation. Trendline angle filtering can exclude flat/weak trendlines from generating signals (minTrendlineAngle > 0 filters out weak/flat trendlines).
How Components Work Together
The combination of multiple RSI periods provides confirmation across different timeframes, reducing false signals. RSI(6) catches early moves, RSI(14) provides balanced signals, and RSI(24) confirms longer-term trends. When all three align (synergy), it indicates strong consensus across timeframes.
Volume confirmation ensures signals occur with sufficient market participation, filtering out low-volume false breakouts. Volume climax detection identifies potential reversal points, while volume dry-up avoidance prevents signals during unreliable low-volume periods.
Trend filters align signals with the overall market direction. The EMA filter ensures you're trading with the trend, and the EMA slope filter adds an additional layer by requiring the trend to be strengthening (rising EMA for buys, falling EMA for sells).
ADX filter ensures signals only fire during strong trends, avoiding choppy/consolidation periods. RSI(50) filter ensures momentum alignment with the trade direction.
Momentum confirmation requires RSI to be accelerating in the signal direction, ensuring signals only fire when momentum is aligned. Multi-timeframe confirmation ensures signals align with higher timeframe trends, reducing counter-trend trades.
Divergence detection identifies potential reversals before they occur, providing early warning signals. Pivot-based divergence provides more accurate detection by using actual pivot points. Hidden divergence identifies continuation patterns, useful for trend-following strategies.
The noise reduction system combines multiple filters (signal strength, extreme zone, consecutive bars, zone persistence, RSI slope) to significantly reduce false signals. These filters work together to ensure only high-quality signals are generated.
The synergy system requires alignment across all RSI periods for highest-quality signals, significantly reducing false positives. Regression forecasting provides forward-looking context, helping anticipate potential RSI direction changes.
Pivot trendlines provide visual trend analysis and can generate signals when RSI breaks trendlines, indicating potential reversals or continuations.
Reset conditions prevent signal spam by requiring a minimum number of bars between signals. Separate reset conditions for buy and sell signals ensure proper signal management.
Usage Instructions
Configuration Presets (Recommended): The script includes optimized preset configurations for instant setup. Simply select your trading style from the "Configuration Preset" dropdown:
- Scalping Preset: RSI(4, 7, 9) with minimal smoothing. Noise reduction disabled, momentum confirmation disabled for fastest signals.
- Day Trading Preset: RSI(6, 9, 14) with light smoothing. Momentum confirmation enabled for better signal quality.
- Swing Trading Preset: RSI(14, 14, 21) with moderate smoothing. Balanced configuration for medium-term trades.
- Position Trading Preset: RSI(24, 21, 28) with heavier smoothing. Optimized for longer-term positions with all filters active.
- Custom Mode: Full manual control over all settings. Default behavior matches previous script versions.
Presets automatically configure RSI periods, smoothing lengths, and filter settings. You can still manually adjust any setting after selecting a preset if needed.
Getting Started: The easiest way to get started is to select a configuration preset matching your trading style (Scalping, Day Trading, Swing Trading, or Position Trading) from the "Configuration Preset" dropdown. This instantly configures all settings for optimal performance. Alternatively, use "Custom" mode for full manual control. The default configuration (Custom mode) shows RSI(6), RSI(14), and RSI(24) with their default smoothing. Overbought/oversold fill zones are enabled by default.
Customizing RSI Periods: Adjust the RSI lengths (6, 14, 24) based on your trading timeframe. Shorter periods (6) for scalping, standard (14) for day trading, longer (24) for swing trading. You can disable any RSI period you don't need.
Smoothing Selection: Choose smoothing method based on your needs. EMA provides balanced smoothing, RMA (Wilder's) is traditional, Zero-Lag reduces lag but may increase noise. Adjust smoothing lengths individually or use global smoothing for consistency. Note: Smoothing lengths are automatically validated to ensure they are always less than the corresponding RSI period length. If you set smoothing >= RSI length, it will be auto-adjusted to prevent invalid configurations.
Dynamic OB/OS: The dynamic thresholds automatically adapt to volatility. Adjust the volatility multiplier and base percentage to fine-tune sensitivity. Higher values create wider thresholds in volatile markets.
Volume Confirmation: Set volume threshold to 1.2 (default) for standard confirmation, higher for stricter filtering, or 0.1 to disable volume filtering entirely.
Multi-RSI Synergy: Use "ALL" mode for highest-quality signals (all 3 RSIs must align), or "2-of-3" mode for more frequent signals. Adjust the reset period to control signal frequency.
Filters: Enable filters gradually to find your preferred balance. Start with volume confirmation, then add trend filter, then ADX for strongest confirmation. RSI(50) filter is useful for momentum-based strategies and is recommended for noise reduction. Momentum confirmation and multi-timeframe confirmation add additional layers of accuracy but may reduce signal frequency.
Noise Reduction: The noise reduction system is enabled by default with balanced settings. Adjust minSignalStrength (default 3.0) to control how far RSI must be from centerline. Increase requireConsecutiveBars (default 1) to require signals to persist longer. Enable requireZonePersistence and requireRsiSlope for stricter filtering (higher quality but fewer signals). Start with defaults and adjust based on your needs.
Divergence: Enable divergence detection and adjust lookback periods. Strong divergence (with engulfing confirmation) provides higher-quality signals. Hidden divergence is useful for trend-following strategies. Enable pivot-based divergence for more accurate detection using actual pivot points instead of simple lowest/highest comparisons. Pivot-based divergence uses tolerance-based matching (1% for price, 1.0 RSI point for RSI) for better accuracy.
Forecasting: Enable regression forecasting to see potential RSI direction. Linear regression is simplest, polynomial captures curves, exponential smoothing adapts to trends. Adjust horizon based on your trading timeframe. Confidence bands show forecast uncertainty - wider bands indicate less reliable forecasts.
Pivot Trendlines: Enable pivot trendlines to visualize RSI trends and identify trend breaks. Adjust pivot detection period (default 5) - higher values detect fewer but stronger pivots. Enable pivot confirmation (default ON) to reduce repainting. Set minPivotStrength (default 1.0) to filter weak pivots - lower values detect more pivots (more trendlines), higher values detect only stronger pivots (fewer trendlines). Enable "Keep Historical Trendlines" to preserve multiple trendlines instead of just the most recent one. Set "Max Trendlines to Keep" (default 5) to control how many historical trendlines are preserved. Enable trend break confirmation for more reliable break signals. Adjust minTrendlineAngle (default 0.0) to filter flat trendlines - set to 0.1-0.5 to exclude weak trendlines.
Alerts: Set up alerts for your preferred signal types. Enable cooldown to prevent alert spam. Each signal type has its own alert condition, so you can be selective about which signals trigger alerts.
Visual Elements and Signal Markers
The script uses various visual markers to indicate signals and conditions:
- "sBottom" label (green): Strong bottom signal - RSI at extreme low with strong buy conditions
- "sTop" label (red): Strong top signal - RSI at extreme high with strong sell conditions
- "SyBuy" label (lime): Multi-RSI synergy buy signal - all RSIs aligned oversold
- "SySell" label (red): Multi-RSI synergy sell signal - all RSIs aligned overbought
- 🐂 emoji (green): Strong bullish divergence detected
- 🐻 emoji (red): Strong bearish divergence detected
- 🔆 emoji: Weak divergence signals (if enabled)
- "H-Bull" label: Hidden bullish divergence
- "H-Bear" label: Hidden bearish divergence
- ⚡ marker (top of pane): Volume climax detected (extreme volume) - positioned at top for visibility
- 💧 marker (top of pane): Volume dry-up detected (very low volume) - positioned at top for visibility
- ↑ triangle (lime): Uptrend break signal - RSI breaks below uptrend line
- ↓ triangle (red): Downtrend break signal - RSI breaks above downtrend line
- Triangle up (lime): RSI(50) bullish crossover
- Triangle down (red): RSI(50) bearish crossover
- Circle markers: RSI period crossovers
All markers are positioned at the RSI value where the signal occurs, using location.absolute for precise placement.
Signal Priority and Interpretation
Signals are generated independently and can occur simultaneously. Higher-priority signals generally indicate stronger setups:
1. Multi-RSI Synergy signals (SyBuy/SySell) - Highest priority: Requires alignment across all RSI periods plus volume and filter confirmation. These are the most reliable signals.
2. Strong Top/Bottom signals (sTop/sBottom) - High priority: Indicates extreme RSI levels with strong bounce conditions. Requires volume confirmation and all filters.
3. Divergence signals - Medium-High priority: Strong divergence (with engulfing) is more reliable than regular divergence. Hidden divergence indicates continuation rather than reversal.
4. Adaptive RSI crossovers - Medium priority: Buy when adaptive RSI crosses below dynamic oversold, sell when it crosses above dynamic overbought. These use volatility-adjusted RSI for more accurate signals.
5. RSI(50) centerline crossovers - Medium priority: Momentum shift signals. Less reliable alone but useful when combined with other confirmations.
6. RSI period crossovers - Lower priority: Early momentum shift indicators. Can provide early warning but may produce false signals in choppy markets.
Best practice: Wait for multiple confirmations. For example, a synergy signal combined with divergence and volume climax provides the strongest setup.
Chart Requirements
For proper script functionality and compliance with TradingView requirements, ensure your chart displays:
- Symbol name: The trading pair or instrument name should be visible
- Timeframe: The chart timeframe should be clearly displayed
- Script name: "Ultimate RSI " should be visible in the indicator title
These elements help traders understand what they're viewing and ensure proper script identification. The script automatically includes this information in the indicator title and chart labels.
Performance Considerations
The script is optimized for performance:
- ATR and Volume SMA are cached using var variables, updating only on confirmed and real-time bars to reduce redundant calculations
- Forecast line arrays are dynamically managed: lines are reused when possible, and unused lines are deleted to prevent memory accumulation
- Calculations use efficient Pine Script functions (ta.rsi, ta.ema, etc.) which are optimized by TradingView
- Array operations are minimized where possible, with direct calculations preferred
- Polynomial regression automatically caps the forecast horizon at 20 bars (POLYNOMIAL_MAX_HORIZON constant) to prevent performance degradation, as polynomial regression has O(n³) complexity. This safeguard ensures optimal performance even with large horizon settings
- Pivot detection includes edge case handling to ensure reliable calculations even on early bars with limited historical data. Regression forecasting functions include comprehensive safety checks: horizon validation (must not exceed array size), empty array handling, edge case handling for horizon=1 scenarios, and division-by-zero protection in all mathematical operations
The script should perform well on all timeframes. On very long historical data, forecast lines may accumulate if the horizon is large; consider reducing the forecast horizon if you experience performance issues. The polynomial regression performance safeguard automatically prevents performance issues for that specific regression type.
Known Limitations and Considerations
- Forecast lines are forward-looking projections and should not be used as definitive predictions. They provide context but are not guaranteed to be accurate.
- Dynamic OB/OS thresholds can exceed 100 or go below 0 in extreme volatility scenarios, but are clamped to 0-100 range. This means in very volatile markets, the dynamic thresholds may not widen as much as the raw calculation suggests.
- Volume confirmation requires sufficient historical volume data. On new instruments or very short timeframes, volume calculations may be less reliable.
- Higher timeframe RSI uses request.security() which may have slight delays on some data feeds.
- Regression forecasting requires at least N bars of history (where N = forecast horizon) before it can generate forecasts. Early bars will not show forecast lines.
- StochRSI calculation requires the selected RSI source to have sufficient history. Very short RSI periods on new charts may produce less reliable StochRSI values initially.
Practical Use Cases
The indicator can be configured for different trading styles and timeframes:
Swing Trading: Select the "Swing Trading" preset for instant optimal configuration. This preset uses RSI periods (14, 14, 21) with moderate smoothing. Alternatively, manually configure: Use RSI(24) with Multi-RSI Synergy in "ALL" mode, combined with trend filter (EMA 200) and ADX filter. This configuration provides high-probability setups with strong confirmation across multiple RSI periods.
Day Trading: Select the "Day Trading" preset for instant optimal configuration. This preset uses RSI periods (6, 9, 14) with light smoothing and momentum confirmation enabled. Alternatively, manually configure: Use RSI(6) with Zero-Lag smoothing for fast signal detection. Enable volume confirmation with threshold 1.2-1.5 for reliable entries. Combine with RSI(50) filter to ensure momentum alignment. Strong top/bottom signals work well for day trading reversals.
Trend Following: Enable trend filter (EMA) and EMA slope filter for strong trend confirmation. Use RSI(14) or RSI(24) with ADX filter to avoid choppy markets. Hidden divergence signals are useful for trend continuation entries.
Reversal Trading: Focus on divergence detection (regular and strong) combined with strong top/bottom signals. Enable volume climax detection to identify capitulation moments. Use RSI(6) for early reversal signals, confirmed by RSI(14) and RSI(24).
Forecasting and Planning: Enable regression forecasting with polynomial or exponential smoothing methods. Use forecast horizon of 10-20 bars for swing trading, 5-10 bars for day trading. Confidence bands help assess forecast reliability.
Multi-Timeframe Analysis: Enable higher timeframe RSI to see context from larger timeframes. For example, use daily RSI on hourly charts to understand the larger trend context. This helps avoid counter-trend trades.
Scalping: Select the "Scalping" preset for instant optimal configuration. This preset uses RSI periods (4, 7, 9) with minimal smoothing, disables noise reduction, and disables momentum confirmation for faster signals. Alternatively, manually configure: Use RSI(6) with minimal smoothing (or Zero-Lag) for ultra-fast signals. Disable most filters except volume confirmation. Use RSI period crossovers (RSI(6) × RSI(14)) for early momentum shifts. Set volume threshold to 1.0-1.2 for less restrictive filtering.
Position Trading: Select the "Position Trading" preset for instant optimal configuration. This preset uses extended RSI periods (24, 21, 28) with heavier smoothing, optimized for longer-term trades. Alternatively, manually configure: Use RSI(24) with all filters enabled (Trend, ADX, RSI(50), Volume Dry-Up avoidance). Multi-RSI Synergy in "ALL" mode provides highest-quality signals.
Practical Tips and Best Practices
Getting Started: The fastest way to get started is to select a configuration preset that matches your trading style. Simply choose "Scalping", "Day Trading", "Swing Trading", or "Position Trading" from the "Configuration Preset" dropdown to instantly configure all settings optimally. For advanced users, use "Custom" mode for full manual control. The default configuration (Custom mode) is balanced and works well across different markets. After observing behavior, customize settings to match your trading style.
Reducing Repainting: All signals are based on confirmed bars, minimizing repainting. The script uses confirmed bar data for all calculations to ensure backtesting accuracy.
Signal Quality: Multi-RSI Synergy signals in "ALL" mode provide the highest-quality signals because they require alignment across all three RSI periods. These signals have lower frequency but higher reliability. For more frequent signals, use "2-of-3" mode. The noise reduction system further improves signal quality by requiring multiple confirmations (signal strength, extreme zone, consecutive bars, optional zone persistence and RSI slope). Adjust noise reduction settings to balance signal frequency vs. accuracy.
Filter Combinations: Start with volume confirmation, then add trend filter for trend alignment, then ADX filter for trend strength. Combining all three filters significantly reduces false signals but also reduces signal frequency. Find your balance based on your risk tolerance.
Volume Filtering: Set volume threshold to 0.1 or lower to effectively disable volume filtering if you trade instruments with unreliable volume data or want to test without volume confirmation. Standard confirmation uses 1.2-1.5 threshold.
RSI Period Selection: RSI(6) is most sensitive and best for scalping or early signal detection. RSI(14) provides balanced signals suitable for day trading. RSI(24) is smoother and better for swing trading and trend confirmation. You can disable any RSI period you don't need to reduce visual clutter.
Smoothing Methods: EMA provides balanced smoothing with moderate lag. RMA (Wilder's smoothing) is traditional and works well for RSI. Zero-Lag reduces lag but may increase noise. WMA gives more weight to recent values. Choose based on your preference for responsiveness vs. smoothness.
Forecasting: Linear regression is simplest and works well for trending markets. Polynomial regression captures curves and works better in ranging markets. Exponential smoothing adapts to trends. Moving average method is most conservative. Use confidence bands to assess forecast reliability.
Divergence: Strong divergence (with engulfing confirmation) is more reliable than regular divergence. Hidden divergence indicates continuation rather than reversal, useful for trend-following strategies. Pivot-based divergence provides more accurate detection by using actual pivot points instead of simple lowest/highest comparisons. Adjust lookback periods based on your timeframe: shorter for day trading, longer for swing trading. Pivot divergence period (default 5) controls the sensitivity of pivot detection.
Dynamic Thresholds: Dynamic OB/OS thresholds automatically adapt to volatility. In volatile markets, thresholds widen; in calm markets, they narrow. Adjust the volatility multiplier and base percentage to fine-tune sensitivity. Higher values create wider thresholds in volatile markets.
Alert Management: Enable alert cooldown (default 10 bars, recommended) to prevent alert spam. Each alert type has its own cooldown, so you can set different cooldowns for different signal types. For example, use shorter cooldown for synergy signals (high quality) and longer cooldown for crossovers (more frequent). The cooldown system works independently for each signal type, preventing spam while allowing different signal types to fire when appropriate.
Technical Specifications
- Pine Script Version: v6
- Indicator Type: Non-overlay (displays in separate panel below price chart)
- Repainting Behavior: Minimal - all signals are based on confirmed bars, ensuring accurate backtesting results
- Performance: Optimized with caching for ATR and volume calculations. Forecast arrays are dynamically managed to prevent memory accumulation.
- Compatibility: Works on all timeframes (1 minute to 1 month) and all instruments (stocks, forex, crypto, futures, etc.)
- Edge Case Handling: All calculations include safety checks for division by zero, NA values, and boundary conditions. Reset conditions and alert cooldowns handle edge cases where conditions never occurred or values are NA.
- Reset Logic: Separate reset conditions for buy signals (based on bottom conditions) and sell signals (based on top conditions) ensure logical correctness.
- Input Parameters: 60+ customizable parameters organized into logical groups for easy configuration. Configuration presets available for instant setup (Scalping, Day Trading, Swing Trading, Position Trading, Custom).
- Noise Reduction: Comprehensive noise reduction system with multiple filters (signal strength, extreme zone, consecutive bars, zone persistence, RSI slope) to reduce false signals.
- Pivot-Based Divergence: Enhanced divergence detection using actual pivot points for improved accuracy.
- Momentum Confirmation: RSI momentum filter ensures signals only fire when RSI is accelerating in the signal direction.
- Multi-Timeframe Confirmation: Optional higher timeframe RSI alignment for trend confirmation.
- Enhanced Pivot Trendlines: Trendline drawing with strength requirements, confirmation, and trend break detection.
Technical Notes
- All RSI values are clamped to 0-100 range to ensure valid oscillator values
- ATR and Volume SMA are cached for performance, updating on confirmed and real-time bars
- Reset conditions handle edge cases: if a condition never occurred, reset returns true (allows first signal)
- Alert cooldown handles na values: if no previous alert, cooldown allows the alert
- Forecast arrays are dynamically sized based on horizon, with unused lines cleaned up
- Fill logic uses a minimum gap (0.1) to ensure reliable polygon rendering in TradingView
- All calculations include safety checks for division by zero and boundary conditions. Regression functions validate that horizon doesn't exceed array size, and all array access operations include bounds checking to prevent out-of-bounds errors
- The script uses separate reset conditions for buy signals (based on bottom conditions) and sell signals (based on top conditions) for logical correctness
- Background coloring uses a fallback system: dynamic color takes priority, then RSI(6) heatmap, then monotone if both are disabled
- Noise reduction filters are applied after accuracy filters, providing multiple layers of signal quality control
- Pivot trendlines use strength requirements to filter weak pivots, reducing noise in trendline drawing. Historical trendlines are stored in arrays and automatically limited to prevent memory accumulation when "Keep Historical Trendlines" is enabled
- Volume climax and dry-up markers are positioned at the top of the pane for better visibility
- All calculations are optimized with conditional execution - features only calculate when enabled (performance optimization)
- Input Validation: Automatic cross-input validation ensures smoothing lengths are always less than RSI period lengths, preventing configuration errors
- Configuration Presets: Four optimized preset configurations (Scalping, Day Trading, Swing Trading, Position Trading) for instant setup, plus Custom mode for full manual control
- Constants Management: Magic numbers extracted to documented constants for improved maintainability and easier tuning (pivot tolerance, divergence thresholds, fill gap, etc.)
- TradingView Function Consistency: All TradingView functions (ta.crossover, ta.crossunder, ta.atr, ta.lowest, ta.highest, ta.lowestbars, ta.highestbars, etc.) and custom functions that depend on historical results (f_consecutiveBarConfirmation, f_rsiSlopeConfirmation, f_rsiZonePersistence, f_applyAllFilters, f_rsiMomentum, f_forecast, f_confirmPivotLow, f_confirmPivotHigh) are called on every bar for consistency, as recommended by TradingView. Results are then used conditionally when needed. This ensures consistent calculations and prevents calculation inconsistencies.

RSI Divergence StrategyOverview
The RSI Divergence Strategy Indicator is a trading tool that uses the RSI and divergences created to generate high-probability buy and sell signals.
I have provided the best formula of numbers to use for BTC on a 30 minute timeframe.
You can change where on RSI you enter and exit both long or short trades. This way you can experiment on different tokens using different entry/exit points. Can use on multiple timeframes.
This strategy is designed to open and close long or short trades based on the levels you provide it. You can then check on the RSI where the best levels are for each token you want to trade and amend it as required to generate a profitable strategy.
How It Works
The RSI Divergence Strategy Indicator uses bear and bull divergences in conjuction with a level you have input on the RSI.
RSI for Overbought/Oversold:
• Input variables for entry and exit levels and when the entry levels combine with a bear or bull divergence signal, a trade is alerted.
RSI Divergence:
• Buy and sell signals are confirmed when the RSI creates bearish or bullish divergences and these divergences are in the same area as your levels you input for entry to short or long.
After 7 years of experience and testing I have calculated the exact numbers required and produced a formula to calculate the exact input variables for a 30 minute Bitcoin chart.
Key Features
1️⃣ Divergence Identification – Ensures trades are taken only when a bull or bear divergence has formed.
2️⃣ Overbought/Oversold Input Filtering – Set up your own variables on the RSI for different markets after identifying patterns on the RSI in relation to a bearish or bullish divergence.
3️⃣ Works on any chart – Suitable for all markets and timeframes once you input the correct variables for entry and exit levels.
How to Use
🟢 Basic Trading:
• Use on any timeframe.
• Enter trade only when alert has fired off. Close when it says to exit.
• Change entry and exit levels in the properties of the strategy indicator.
• Make entry and exit levels coincide with bearish or bullish divergences on the RSI.
Check the strategy tester to see backtesting so you know if the indicator is profitable or not for that market and timeframe as each crypto token is different and so is the timeframe you choose.
📢 Webhook Automation:
• Set up TradingView Alerts to auto-execute trades via Webhook-compatible platforms.
Key additions for divergence visualization:
Divergence Arrows:
Bullish divergence: Green label with white 'bull ' text
Bearish divergence: Red label with white 'bear' text
Positioned at the pivot point
Divergence Lines:
Connects consecutive RSI pivot points
Automatically drawn between consecutive pivot points
Enhanced RSI Coloring:
Overbought zone: Red
Oversold zone: Green
Neutral zone: Gray
The visualization helps you instantly spot:
Where divergences are forming on the RSI
The pattern of higher lows (bullish) or lower highs (bearish)
Contextual coloring of RSI relative to standard levels
All divergence markers appear at the correct historical pivot points, making it easy to visually confirm divergence patterns as they develop.
Strategy levels and background zones also shown to help visual look.
Why This Combination?
This indicator is just a simple RSI tool.
It is designed to filter out weak trades and only execute trades that have:
✅ RSI Divergence
✅ Overbought or Oversold Conditions
It does not calculate downtrends or bear markets so care is recommended taking long trades during these times.
Why It’s Worth Using?
📈 Open Source – Free to use and learn from.
📉 Long or Short Term Trading Style – Entry/Exit parameters options are designed for both short or long term trades allowing you to experiment until you find a profitable strategy for that market you want to trade.
📢 Seamless Webhook Automation – Execute trades automatically with TradingView alerts.
💲 Ready to trade smarter?
✅ Add the RSI Divergence Strategy Indicator to your TradingView chart.

Volume Divergence 11192It calculates a custom volume-weighted moving average using the pine_wma() function which takes into account whether each candle is bullish or bearish
It processes volume data through multiple layers of this custom moving average
It detects four types of divergences:
Regular Bullish Divergence: When price makes a lower low but volume makes a higher low (potential bullish reversal)
Hidden Bullish Divergence: When price makes a higher low but volume makes a lower low (potential bullish continuation)
Regular Bearish Divergence: When price makes a higher high but volume makes a lower high (potential bearish reversal)
Hidden Bearish Divergence: When price makes a lower high but volume makes a higher high (potential bearish continuation)
It visualizes these divergences on the chart with colored markers and labels

CVD Candles + Divergence (Pane) [NIRALA]This indicator provides a powerful way to analyze market dynamics by visualizing Cumulative Volume Delta (CVD) as candlesticks and automatically detecting divergences between price and order flow. It is designed to help traders spot potential trend exhaustion and reversals that may not be apparent from price action alone.
Key Concepts
Cumulative Volume Delta (CVD): CVD is a running total of the difference between buying and selling volume from market orders. A rising CVD indicates aggressive buying, while a falling CVD indicates aggressive selling. Unlike price, which can be influenced by passive limit orders, CVD shows the raw intent of aggressive market participants.
Divergence: A divergence occurs when price and CVD move in opposite directions. This signals a potential conflict between price action and the underlying order flow, often preceding a reversal.
Bearish Divergence: Price makes a new high, but CVD fails to make a new high (or makes a lower high). This suggests buying aggression is weakening despite the higher price, and a reversal to the downside may be imminent.
Bullish Divergence: Price makes a new low, but CVD fails to make a new low (or makes a higher low). This suggests selling pressure is drying up, and a reversal to the upside may be coming.
Features
CVD as Candlesticks: Plots CVD in a familiar OHLC candlestick format in a separate pane, providing a more intuitive view of order flow momentum and volatility compared to a simple line.
Automatic Divergence Detection: The script automatically identifies classic bullish and bearish divergences between price pivots and CVD pivots, drawing lines on both the main price chart and the indicator pane to clearly highlight them.
Multi-Timeframe Analysis: Calculates CVD from a user-defined lower timeframe, offering a more granular and precise view of the order flow that builds up a single candle on your chart.
Customizable Pivot Lookbacks: Allows you to adjust the sensitivity of the pivot detection for finding both short-term and long-term divergences.
Alerts: Includes built-in alerts that can notify you when a new bullish or bearish divergence is confirmed.
How to Use
Look for High-Probability Setups: This indicator is most powerful when its signals appear at key areas of support or resistance. A divergence at a major price level is a much stronger signal than one in the middle of a range.
Confirm with Price Action: Do not trade on a divergence signal alone. Wait for a confirmation candle (e.g., a bearish engulfing candle after a bearish divergence, or a bullish hammer after a bullish divergence) before considering an entry.
Combine with Your Strategy: Use this indicator as a confirmation tool to enhance your existing trading strategy. For example, if your primary strategy gives a sell signal and this indicator simultaneously prints a bearish divergence, it significantly increases the probability of the trade.
This tool is designed for discretionary traders looking to add a layer of order flow analysis to their decision-making process.
RSI and MACD Divergence IndicatorThe RSI and MACD Divergence Indicator is a custom Pine Script v6 indicator designed for TradingView that identifies and visualizes divergences between price movements and two technical indicators: the Relative Strength Index (RSI) and the Moving Average Convergence Divergence (MACD). Here's a brief explanation of its functionality:
Divergence Detection: The indicator detects both regular and hidden divergences for RSI, MACD (MACD Line), and Histogram. Regular bullish divergences occur when price makes a lower low but the indicator makes a higher low (suggesting a potential reversal upward), while regular bearish divergences occur when price makes a higher high but the indicator makes a lower high (suggesting a potential reversal downward). Hidden divergences indicate continuation patterns (e.g., higher low in price with a lower low in the indicator for bullish continuation).
Customizable Inputs:
Pivot Bars: Sets the number of bars used to confirm pivot highs and lows (default: 5).
RSI and MACD Parameters: Allows adjustment of RSI length (default: 14) and MACD settings (fast: 12, slow: 26, signal: 9).
Toggle Options: Enables/disables detection of regular and hidden divergences for RSI, MACD, and Histogram individually.
Confirmation: Option to wait for pivot confirmation (default: true), delaying divergence display until the pivot is fully formed.
Show Only Last Divergence: Toggles between showing only the most recent divergence (default: true) or all detected divergences (false), with previous lines and labels cleared when true.
Minimum Divergences: Sets the minimum number of divergence types required at a pivot to display (default: 1, max: 6).
Maximum Pivot Points: Limits the number of historical pivot points to check (default: 10).
Maximum Bars to Check: Restricts analysis to the last specified number of bars (default: 500).
Visualization:
Draws lines connecting the price pivot points where divergences are detected, with customizable colors, widths, and styles (solid, dashed, dotted) for RSI and MACD.
Displays a single label per pivot with vertically stacked text listing all detected divergence types (e.g., "RSI Bull Div\nMACD Bull Div"), using semi-transparent backgrounds (green for bullish, red for bearish) and white text.

Bullish B's - RSI Divergence StrategyThis indicator strategy is an RSI (Relative Strength Index) divergence trading tool designed to identify high-probability entry and exit points based on trend shifts. It utilizes both regular and hidden RSI divergence patterns to spot potential reversals, with signals for both bullish and bearish conditions.
Key Features
Divergence Detection:
Bullish Divergence: Signals when RSI indicates momentum strengthening at a lower price level, suggesting a reversal to the upside.
Bearish Divergence: Signals when RSI shows weakening momentum at a higher price level, indicating a potential downside reversal.
Hidden Divergences: Looks for hidden bullish and bearish divergences, which signal trend continuation points where price action aligns with the prevailing trend.
Volume-Adjusted Entry Signals:
The strategy enters long trades when RSI shows bullish or hidden bullish divergence, indicating an upward momentum shift.
An optional volume filter ensures that only high-volume, high-conviction trades trigger a signal.
Exit Signals:
Exits long positions when RSI reaches a customizable overbought level, typically indicating a potential reversal or profit-taking opportunity.
Also closes positions if bearish divergence signals appear after a bullish setup, providing protection against trend reversals.
Trailing Stop-Loss:
Uses a trailing stop mechanism based on ATR (Average True Range) or a percentage threshold to lock in profits as the price moves in favor of the trade.
Alerts and Custom Notifications:
Integrated with TradingView alerts to notify the user when entry and exit conditions are met, supporting timely decision-making without constant monitoring.
Customizable Parameters:
Users can adjust the RSI period, pivot lookback range, overbought level, trailing stop type (ATR or percentage), and divergence range to fit their trading style.
Ideal Usage
This strategy is well-suited for trend traders and swing traders looking to capture reversals and trend continuations on medium to long timeframes. The divergence signals, paired with trailing stops and volume validation, make it adaptable for multiple asset classes, including stocks, forex, and crypto.
Summary
With its focus on RSI divergence, trailing stop-loss management, and volume filtering, this strategy aims to identify and capture trend changes with minimized risk. This allows traders to efficiently capture profitable moves and manage open positions with precision.
This Strategy BEST works with GLD!

TechniTrend: Dynamic Pair CorrelationTechniTrend: Dynamic Pair Correlation
Description:
The TechniTrend: Dynamic Pair Correlation is a powerful and versatile indicator designed to track the correlation between two assets—whether cryptocurrencies, indices, or other financial instruments—across multiple timeframes. Understanding correlations can provide deep insights into market behavior, helping traders make informed decisions based on how two assets move in relation to each other.
Key Features:
Customizable Pair Selection: Compare any two assets (e.g., Bitcoin and DXY, Ethereum and SP500) to study how their price movements relate over time.
Multi-Timeframe Analysis: Simultaneously track correlations across different timeframes—standard, lower, and higher—providing a comprehensive view of market dynamics.
Dynamic Color Coding for Correlation Strength: Instantly spot correlations with visually intuitive colors—green for strong positive correlation, red for strong negative correlation, and yellow for neutral.
Heatmap Background: An easy-to-read background color heatmap highlights when correlations hit extreme levels, adding another layer of insight to your charts.
Real-Time Alerts: Get notified when correlations exceed your custom thresholds, signaling opportunities for potential breakouts, reversals, or divergences.
Divergence Detection: Automatically highlight moments when asset prices diverge, offering potential entry/exit points for smart trading decisions.
How to Use:
Asset Pair Comparison: Select two symbols to analyze their price correlation, such as BTC/USDT and DXY, or any other pair that fits your strategy.
Set Your Timeframes: Customize your standard, lower, and higher timeframes to monitor correlations at different intervals, allowing you to capture both short-term and long-term relationships.
Track Correlation Strength: Use dynamic color coding to quickly see how closely two assets are moving together. Strong correlations (positive or negative) could signal potential opportunities, while low correlations may indicate the absence of a strong trend.
Utilize Alerts: Receive real-time alerts when correlations cross your predefined thresholds, helping you take action when the market presents strong alignment or divergence.
Divergence Signals: Watch for divergence between the assets on multiple timeframes, which could indicate a potential trend reversal or a shift in market behavior.
Why It’s Essential:
Understanding the relationship between two assets can be a game changer for traders. Whether you're comparing Bitcoin to DXY, tracking the correlation between Ethereum and major indices, or evaluating two cryptocurrencies, this indicator gives you the tools to visualize and respond to market conditions with precision.
Perfect For:
Crypto traders looking to optimize strategies by monitoring the relationship between major cryptocurrencies and other assets.
Arbitrageurs seeking to capitalize on temporary pricing anomalies between correlated pairs.
Trend-followers aiming to catch large movements by detecting alignment or divergence between asset classes.
Portfolio managers monitoring how different asset classes impact each other to hedge or diversify investments.
By leveraging the TechniTrend: Dynamic Pair Correlation indicator, traders can gain deeper insights into market trends, correlations, and divergences, giving them an edge in fast-moving markets.
RSI Divergence Pro Price Overlay High-Prob v6RSI Divergence Pro — Comprehensive Usage Guide
1) What This Indicator Does (in plain English)
Goal: Detect high-probability reversal (and optionally continuation) points using RSI divergences, then draw clean visual lines on price (red/bearish, green/bullish) and attach a % Strength label to help you quickly decide if it’s worth trading.
Core logic:
• Finds confirmed peaks and valleys using ta.pivothigh and ta.pivotlow.
• Bearish: Price makes Higher High while RSI makes Lower High.
• Bullish: Price makes Lower Low while RSI makes Higher Low.
• Filters for high probability: RSI near OB/OS, min RSI diff, ATR scaling, pivot spacing.
• Draws lines on price chart and attaches % Strength label.
• Alerts trigger only when a new divergence line is drawn.
2) Inputs & What Each One Means
• RSI Period: Shorter = more reactive; longer = smoother.
• Pivot Left/Right: Controls peak/valley confirmation.
• RSI Overbought/Oversold: Default 60/40; tighten for lower TFs.
• Min RSI Divergence: Minimum difference between RSI pivots.
• ATR Length & Min Price Move vs ATR: Ensures structural change.
• Bars Between Pivots: Avoid micro noise and stale signals.
• Hidden Divergence toggle: OFF for reversal; ON for continuation.
3) The % Strength Label — What It Represents
Combines RSI divergence magnitude (60%), Price move vs ATR (30%), OB/OS proximity (10%).
Interpretation:
• 80–100%: A-grade signals.
• 60–79%: Good, tradable with confirmation.
• 40–59%: Caution.
• <40%: Usually skip.
4) High-Probability Trading Workflow (H1)
1. Step 1: Scan & identify the signal.
2. Step 2: Confirm with price action (structure break or engulfing).
3. Step 3: Entry (conservative or aggressive).
4. Step 4: Stop placement (pivot ±0.5×ATR).
5. Step 5: Take profit & management (TP1 1×ATR, TP2 2×ATR, trail).
5) Confluence & Filters
• EMA slope confirmation.
• Structure alignment with S/R zones.
• Volatility regime check.
6) Example Scenarios
• A) Bearish Classic Divergence: HH price + LH RSI, Strength 83%.
• B) Bullish Classic Divergence: LL price + HL RSI, Strength 68%.
• C) Hidden Bullish Divergence: HL price + LL RSI, Strength 75%.
7) Common Pitfalls & How to Avoid Them
• Forcing signals in dead volatility.
• Taking divergences in strong trends without confirmation.
• Ignoring pivot spacing.
8) Tuning for Your Style
• H1 defaults: RSI 10, pivots 5/5, thresholds 60/40.
• M15/M5: thresholds 65/35, min RSI diff 10–12.
• H4/D1: thresholds 58/42, ATR multiple 0.4–0.6.
9) Multi-Asset Notes
• FX majors: overlap session ideal.
• Indices: require engulfing confirmation.
• Crypto: use ATR multiple ≥0.7.
10) Alerts — How to Use Them
• Set alerts Once per bar close.
• Alert names: Bearish RSI Divergence, Bullish RSI Divergence.
11) Backtesting & Forward Testing
• Define rules: entry, stop, TP.
• Track Strength % bins.
12) Troubleshooting & Diagnostics
• No lines? Loosen thresholds.
• Too many lines? Tighten thresholds.
13) Quick Operator’s Checklist
• Signal present?
• Location near S/R?
• Confirmation present?
14) Future Upgrade Options
• Session filter (London–NY overlap).
• EMA slope confirmation.
• Structure-break confirmation.
• Alert text enhancements.

Smart Price Divergence (MACD Filter) + EMA📌 Purpose
This indicator detects Price Divergences with MACD filtered by a 200 EMA trend condition.
It helps identify high-probability reversal zones aligned with market trend context.
🧠 How It Works
1. MACD Divergence Logic
Bearish Divergence:
Price makes a higher high.
MACD makes a lower high.
Price is above EMA (indicating possible exhaustion in bullish trend).
Bullish Divergence:
Price makes a lower low.
MACD makes a higher low.
Price is below EMA (indicating possible exhaustion in bearish trend).
2. EMA Trend Filter
EMA(200) is used as a directional filter:
Bearish divergences considered above EMA (extended bullish conditions).
Bullish divergences considered below EMA (extended bearish conditions).
3. Visual & Alerts
EMA(200) plotted on chart in orange.
Red triangles for Bearish Divergence.
Green triangles for Bullish Divergence.
Alerts fire for both divergence types.
📈 How to Use
Look for divergence signals as potential reversal alerts.
Combine with support/resistance or price action for confirmation.
EMA ensures signals occur in extended zones, increasing reliability.
Recommended Timeframes: 1h, 4h, D.
Markets: Forex, Crypto, Stocks.
⚙️ Inputs
MACD Fast / Slow / Signal Length
EMA Length (default 200)
⚠️ Disclaimer
This script is for educational purposes only. It does not constitute financial advice.
Always test thoroughly before live trading.

RSI Divergence + Sweep + Signal + Alerts Toolkit [TrendX_]The RSI Toolkit is a powerful set of tools designed to enhance the functionality of the traditional Relative Strength Index (RSI) indicator. By integrating advanced features such as Moving Averages, Divergences, and Sweeps, it helps traders identify key market dynamics, potential reversals, and newly-approach trading stragies.
The toolkit expands on standard RSI usage by incorporating features from smart money concepts (Just try to be creative 🤣 Hope you like it), providing a deeper understanding of momentum, liquidity sweeps, and trend reversals. It is suitable for RSI traders who want to make more informed and effective trading decisions.
💎 FEATURES
RSI Moving Average
The RSI Moving Average (RSI MA) is the moving average of the RSI itself. It can be customized to use various types of moving averages, including Simple Moving Average (SMA), Exponential Moving Average (EMA), Relative Moving Average (RMA), and Volume-Weighted Moving Average (VWMA).
The RSI MA smooths out the RSI fluctuations, making it easier to identify trends and crossovers. It helps traders spot momentum shifts and potential entry/exit points by observing when the RSI crosses above or below its moving average.
RSI Divergence
RSI Divergence identifies discrepancies between price action and RSI momentum. There are two types of divergences: Regular Divergence - Indicates a potential trend reversal; Hidden Divergence - Suggests the continuation of the current trend.
Divergence is a critical signal for spotting weakness or strength in a trend. Regular divergence highlights potential trend reversals, while hidden divergence confirms trend continuation, offering traders valuable insights into market momentum and possible trade setups.
RSI Sweep
RSI Sweep detects moments when the RSI removes liquidity from a trend structure by sweeping above or below the price at key momentum level crossing. These sweeps are overlaid on the RSI chart for easier visualized.
RSI Sweeps are significant because they indicate potential turning points in the market. When RSI sweeps occur: In an uptrend - they suggest buyers' momentum has peaked, possibly leading to a reversal; In a downtrend - they indicate sellers’ momentum has peaked, also hinting at a reversal.
(Note: This feature incorporates Liquidity Sweep concepts from Smart Money Concepts into RSI analysis, helping RSI traders identify areas where liquidity has been removed, which often precedes a trend reversal)
🔎 BREAKDOWN
RSI Moving Average
How MA created: The RSI value is calculated first using the standard RSI formula. The MA is then applied to the RSI values using the trader’s chosen type of MA (SMA, EMA, RMA, or VWMA). The flexibility to choose the type of MA allows traders to adjust the smoothing effect based on their trading style.
Why use MA: RSI by itself can be noisy and difficult to interpret in volatile markets. Applying moving average would provide a smoother, more reliable view of RSI trends.
RSI Divergence
How Regular Divergence created: Regular Divergence is detected when price forms HIGHER highs while RSI forms LOWER highs (bearish divergence) or when price forms LOWER lows while RSI forms HIGHER lows (bullish divergence).
How Hidden Divergence created: Hidden Divergence is identified when price forms HIGHER lows while RSI forms LOWER lows (bullish hidden divergence) or when price forms LOWER highs while RSI forms HIGHER highs (bearish hidden divergence).
Why use Divergence: Divergences provide early warning signals of a potential trend change. Regular divergence helps traders anticipate reversals, while hidden divergence supports trend continuation, enabling traders to align their trades with market momentum.
RSI Sweep
How Sweep created: Trend Structure Shift are identified based on the RSI crossing key momentum level of 50. To track these sweeps, the indicator pinpoints moments when liquidity is removed from the Trend Structure Shift. This is a direct application of Liquidity Sweep concepts used in Smart Money theories, adapted to RSI.
Why use Sweep: RSI Sweeps are created to help traders detect potential trend reversals. By identifying areas where momentum has exhausted during a certain trend direction, the indicator highlights opportunities for traders to enter trades early in a reversal or continuation phase.
⚙️ USAGES
Divergence + Sweep
This is an example of combining Devergence & Sweep in BTCUSDT (1 hour)
Wait for a divergence (regular or hidden) to form on the RSI. After the divergence is complete, look for a sweep to occur. A potential entry might be formed at the end of the sweep.
Divergences indicate a potential trend change, but confirmation is required to ensure the setup is valid. The RSI Sweep provides that confirmation by signaling a liquidity event, increasing the likelihood of a successful trade.
Sweep + MA Cross
This is an example of combining Devergence & Sweep in BTCUSDT (1 hour)
Wait for an RSI Sweep to form then a potential entry might be formed when the RSI crosses its MA.
The RSI Sweep highlights a potential turning point in the market. The MA cross serves as additional confirmation that momentum has shifted, providing a more reliable and more potential entry signal for trend continuations.
DISCLAIMER
This indicator is not financial advice, it can only help traders make better decisions. There are many factors and uncertainties that can affect the outcome of any endeavor, and no one can guarantee or predict with certainty what will occur. Therefore, one should always exercise caution and judgment when making decisions based on past performance.
