CryptoEQ SignalAbout the signal:
CryptoEQ™ provides real-time trading signals to help traders and investors with excellent entry and exit points. The CryptoEQ™ has an easy to understand signal that helps traders -along with their own research- determine if a crypto assets price is overbought or oversold. CryptoEQ™ uses proprietary algorithms that take into consideration popular momentum indicators in trading, including, but not limited to Relative Strength Index (RSI) , Stochastic Oscillator (SO) , and Stochastic Relative Strength Index (SRSI) to produce their trading signals.
About momentum indicators:
Momentum indicators help traders and analysts identify where the market will reverse after moving in a direction. The direction changes are identified through divergence between price and momentum.
Using the signal:
Using the signal is straightforward. If a “BUY” signal is triggered it indicates an oversold condition, if a “PULL BACK” signal is triggered it indicates an overbought condition.
About CryptoEQ™:
CryptoEQ™ helps investors and traders make informed investment decisions by providing comprehensive, accurate, and up-to-date research and analysis on crypto-projects. They abide by strict principles and ethics to provide honest information while actively seeking to identify scams, low quality, and nefarious projects. All signals are available at cryptoeq.io. You can find additional content on our social media platforms, which include Instagram, Twitter, Telegram, and LinkedIn.
Cerca negli script per "Divergence"

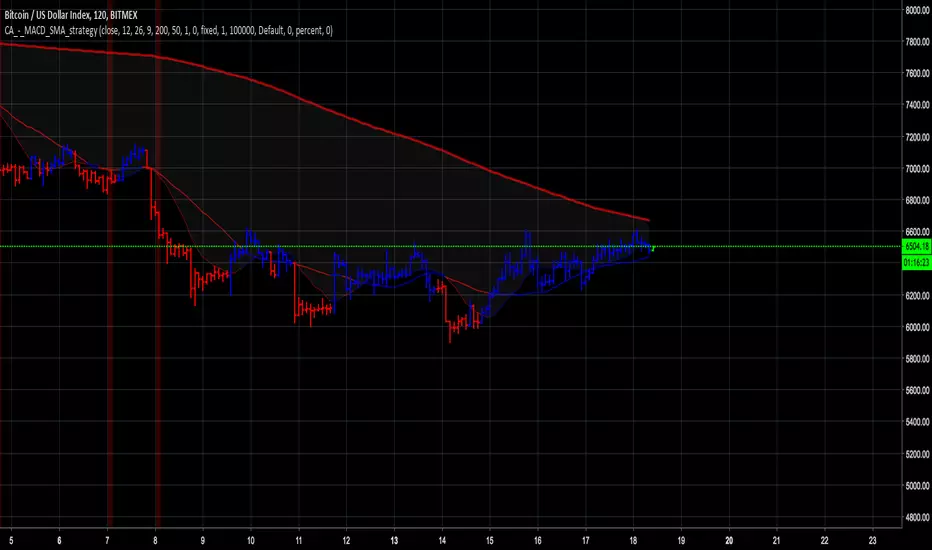
3. AutoBots Trading - BACKTEST: MACDBACKTEST: Moving Average Convergence Divergence - MACD
1. Description: a trend-following momentum indicator that shows the relationship between two moving averages of a security’s price. The MACD is calculated by subtracting the 26-period Exponential Moving Average ( EMA ) from the 12-period EMA .
2. Strategy rules: defined based on the component, signal count, entry prices, open order count, position check, position averages, conditional closes and close signals.
3. Risk management: system was defined based on the choice of only long, only short or both sides. Defining the choice of take profit, stop loss and trailing stos (no repaint).
4. Symbol: PETR4 (only)
5. Suggested Timeframe: 2H
6. Parameter for optimization: 12, 8, 9, side: long, tp: 3%, sl: 1%, ts: na
7. Walk forward simulation
7.1. In sample period: jan/2018-jan/2020
7.2. Out of sample period: jan/2020 - ago/2020
** For purpose educate only

Detrended Price Oscillator StrategyTHIS IS THE STRATEGY VERSION
What is DPO?
A detrended price oscillator is an oscillator that strips out price trends in an effort to estimate the length of price cycles from peak to peak or trough to trough. Unlike other oscillators, such as the stochastic or moving average convergence divergence (MACD), the DPO is not a momentum indicator. It highlights peaks and troughs in price, which are used to estimate buy and sell points in line with the historical cycle.
(From Investopedia )
Indicator features:
Responds faster than the original code.
Added alternative smoothing algorithms. Defaults to Ehler's Optimum Elliptic filter instead of the orginal SMA
IPOCS - can start printing out data at day 1 instead of waiting for 14 or 20 bars
Dynamic colors
Auto timeframe detection to adjust period/length
How to use:
Buy above zero
Sell below zero
Who is it for?
Long term investors - this is the perfect indicator for those who buy and hold

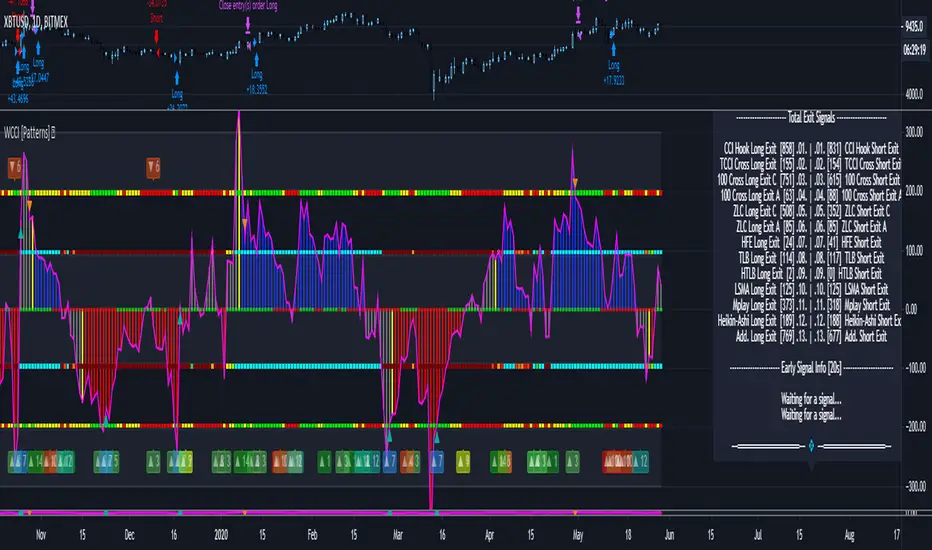
Woodies CCI Trading System - Patterns - Strategy TesterWoodies CCI Trading System - Patterns (Strategy Tester Mode) .
The Woodies CCI was initially designed for trading Stocks, Options and the Future Market.
However, different styles of traders can make use of it in various markets and any chart timeframes.
The Woodies CCI Trading System - Patterns takes a Strategy Builder like approach and can be easily configured to scan simultaneously for any available pattern.
The purpose of this tool is to compress everything down to 1 alert to warn of any opportunities, and it can also be automated .
To further improve the success rate , the patterns' performance can be studied with the help of the Strategy Tester .
The Strategy Tester Mode allows for instant backtesting on historical data.
It can assist in determining the right combination of patterns and exit rules , and it can help decide which patterns are better for which market.
The Alert Mode can be found on this page Woodies-CCI Trading System - Patterns (Alert Mode) .
This trading system contains all the particular features as described by Woodie, and more.
▪ Pattern Recognition (entry signals based on well-defined patterns)
- Trade patterns that are in agreement with the established trend
1. Zero-Line Reject (ZLR)
2. Trend Line Break (TLB) - with the trend
3. Horizontal Trend Line Break (HTLB) - with the trend
4. Tony Trade (TT)
5. GB100 (GB)
6. Reverse Divergence (RD)
- Trade patterns that are against the trend (these patterns indicate the possibility of a change in trend direction and are recommended for experienced traders)
1. Shamu Trade (ST)
2. The Famir Trade (FT)
3. Vegas Trade (VT)
4. Ghost Trade (GT)
5. Hook From Extreme (HFE)
6. Trend Line Break (TLB) - counter-trend
7. Horizontal Trend Line Break (HTLB) - counter-trend
▪ Exit rules
1. CCI Trend Line Breaks
2. CCI crossing back through the 100 lines
3. TCCI hooking or going flat, not moving, or no progress
4. CCI hook from extremes
5. Profit target hit
6. CCI forming a flat top formation
7. CCI crossing a Horizontal Trend Line
8. When the LSMA disagrees with the trade
9. CCI crossing the Zero-Line (ZL)
▪ WCCI Histogram coloring based on Woodie's trend definition
- Blue for Uptrend
- Red for Downtrend
- Gray for No Trend
- Yellow for trend establishment
▪ The LSMA is on the Zero-Line - it is the 25 period Least Squares Moving Average (it shows the ZL as a series of red and green segments)
- Red segments - the market price is below LSMA
- Green segments - the market price is above LSMA
▪ Chop Zone Indicator (CZI) - Positioned on the levels +100 and -100 (it shows market direction)
- Cyan shows up market
- Brown shows down market
- Multiple colors show market in a sideways mode
▪ Sidewinder Indicator (SI) - Positioned on the levels +200 and -200
- Red shows a flat or non-trending market
- Yellow shows a trending market
- Green shows a strong trending market
▪ The Woodies CCI (14) is indicated with the fuchsia color
▪ WCCI length auto-change to 20 on 1-hour chart intervals and higher
▪ The Turbo CCI (6) has a dark red color
▪ TWCCI auto-hide on 1-hour chart intervals and higher
▪ Early Alert Functionality available (eg 20 seconds before the signal is considered valid)
▪ Simplified Alerts
- An all in one alert
- Alerts for entry triggers
- Alerts for exit conditions
▪ Some Pattern Statistics are available on the chart in a panel
Simple Steps to set it up:
1 - Choose at least 1 pattern ( with-the-trend patterns are friendlier than the counter-trend ones)
2 - Choose at least 1 exit condition
3 - Set the alerts (1 for Entry and 1 for Exit, or 1 alert running for both Entry and Exit)
For Beginners:
For the new trader, the trend continuation patterns are easier to manage.
Newcomers should stick to trend-following patterns until they feel very confident!
Here are Three Entry Choices:
1 - Conservative -
Wait until the bar closes to enter - This is the easiest to execute.
2 - Conservative to Aggressive -
Woodie would like the beginner to enter the market if, with 20 seconds left in the bar, a valid CCI pattern presents itself.
3 - Very Aggressive -
Enter trade as soon as the bar indicates a signal during price bar formation. This is for experienced traders, as the signal conditions are final at the close of the bar and the intra-bar changes are not recorded.
Your implicit learned skills are put to the test here. Be fair to yourself and allow yourself time to grow and improve your skills.
You are strongly urged to follow the Option 2.
Money Management: Apply an Initial Protective Stop; Use Trade Exits; Study the past performance - Statistics (Strategy Tester Mode).
Related Tools:
Woodies-CCI Trading System - Patterns - Alerts
Risk Management System (Stop Loss, Take Profit, Trailing Stop Loss, Trailing Take Profit) - it can be connected to the Woodies-CCI Trading System - Patterns - Alerts
Early/Delayed Signal Explained
VuManChu/Noski B Backtester (Divergence Green/Red Dot)This is a backtest version of Vumanchu's original script Market Cipher-B. All credit goes to his original coding.
This has been coded to backtest the alert conditions "Buy (Big green circle +div) and Sell (Big red circle + div)" entries only from the original Cipher B script, so please keep that in mind when using.
Hope this is helpful!

Long Short Double strategyLong Short Double strategy
Long short strategy with stoploss and take profit.
I use this script for 5min btcusd on Bitmex. (The strategy also works on other exchanges, with some small adjustments in RSI)
Leverage 10x 375% profit in 2 weeks. NO REPAINT.
U can Adjust the RSI for long and shorts entry`s.
Study is Autoview ready. send me a PM for Paid access.
If you like this strategy buy me a Pizza, Dinner, or lambo:)
BITCOIN: 3BMEXTEMinsUUqUwr9GEjNA6ZBsVXB1g6u
LITECOIN: LdG82pyEMMji9Bynw3hvWgUshbMKfiFdJw


FractalSqueezeRecommended; Range Bars / find the optimal hit rate between the 33R / 66R / 100R for individual securities or a combination of all 3.
Algorithm determines the geometric state of securities prices and is triggered by volatility expansion on multiple key scales in a unified direction. The unique advantage of this system is that the signal is capable of both strengthening on the long side in the face of negative price action and strengthening on the short side in the face of positive price action, to optimize the signal, trade the divergence of price and output value.

El Tangonator StrategyStrategy for my El Tangonator indicator. Optimized for Bitmex XBTUSD 4h chart. It includes pointers for entry, target and stop loss.
Available only to TRI members.

STOCH MACD SAR RSI V2 STRAT 15M// Strategy based on Stochastic Oscillator ( STOCH ), Moving Average Convergence / Divergence ( MACD ), Parabolic Stop and Reverse (PSAR) and Relative Strength Index (RSI)
// In the second version RSI added
// Adapted for15M time frame
// Created and based on Binance chart
// Working with comission
// No repaints

STOCH MACD SAR Strategy 15M// Strategy based on Stochastic Oscillator (STOCH), Moving Average Convergence / Divergence (MACD) and Parabolic Stop and Reverse (PSAR)
// Adapted for15M time frame
// Created and based on Binance chart
// Working with comission
// No repaints


HG_StrategyThis Strategy shows.
S/R Line
Fibo Bollinger
PRICE DIVERGENCE
Wiliam's Long/Short Signal
The strategy is calculated by 'Wiliam's Long/Short Signal'


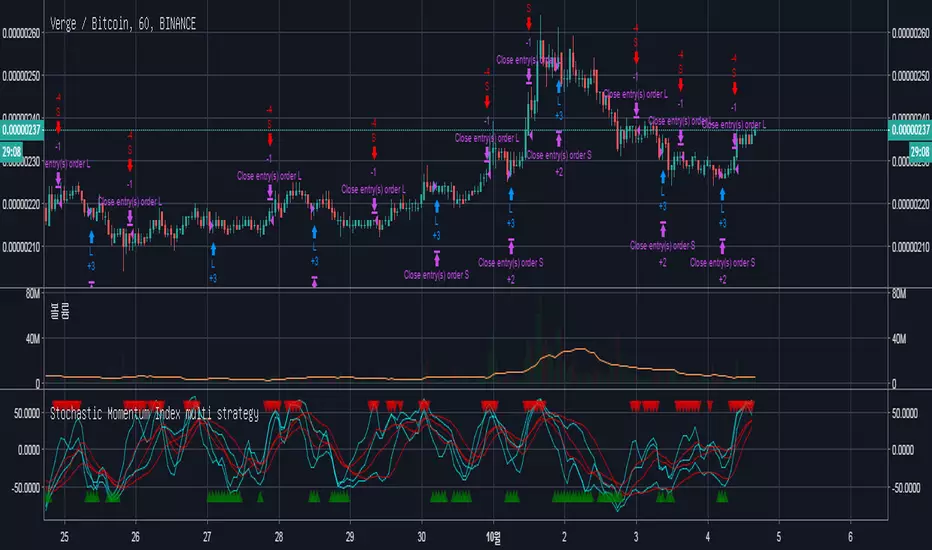
Stochastic Momentum multi. strategyThe Stochastic Momentum Index (Stoch MTM, SMI) is based on the Stochastic Oscillator. The difference is that the Stochastic Oscillator calculates where the close is relative to the high/low range, while the SMI calculates where the close is relative to the midpoint of the high/low range. The values of the SMI range from +100 to -100. When the close is greater than the midpoint, the SMI is above zero, when the close is less than than the midpoint, the SMI is below zero.
The SMI is interpreted the same way as the Stochastic Oscillator. Extreme high/low SMI values indicate overbought/oversold conditions. A buy signal is generated when the SMI rises above -50, or when it crosses above the signal line. A sell signal is generated when the SMI falls below +50, or when it crosses below the signal line. Also look for divergence with the price to signal the end of a trend or indicate a false trend.
The Stochastic Momentum Index was developed by William Blau and was introduced in his article in the January, 1993 issue of Technical Analysis of Stocks & Commodities magazine.
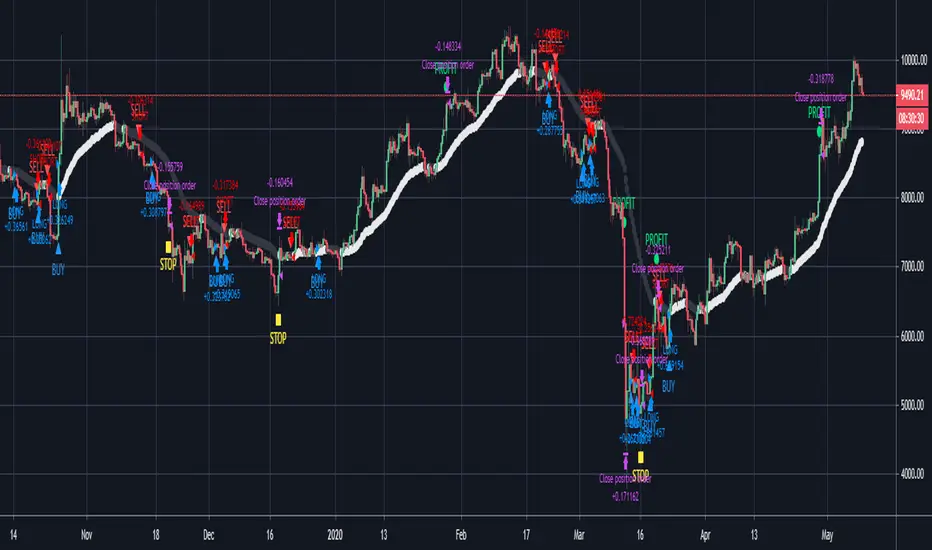
BitcoinNinjas Ninja Signals Buy/Sell Alert Trading Strategy v3.0Bitcoin Ninjas 'Ninja Signals' Buy/Sell Alerts & Backtesting TradingView Script v3.0
(for Cryptocurrencies, Forex, GunBot, ProfitTrailer, automatic trading software, and more)
This is version 3 of our popular Ninja Signals trading script, which is similar to version 2, but with a new hard-coded calibration (resolution) setting that automatically matches candle size (period) to ensure that no repainting occurs regardless of the number or type of indicators and filters traders apply when configuring the script.
'Ninja Signals' v3.0 (SCRIPT)
'Ninja Signals' v3.0 (STRATEGY)
'Ninja Signals' v2.0 (SCRIPT)
'Ninja Signals' v2.0 (STRATEGY)
'Ninja Signals' v1.0 (SCRIPT)
'Ninja Signals' v1.0 (STRATEGY)
-Allows users to easily set automated buy and sell alerts on TradingView for use with automatic and manual trading of cryptocurrencies, Forex securities, and more (alerts are compatible with automatic trading software such as GunBot, ProfitTrailer, and more).
-Synthesizes many powerful indicators [e.g. Relative Strength Index (RSI), stochastic RSI, Money Flow Index (MFI), Moving Average Convergence Divergence (MACD), etc.) into one super script to generate very precise buy and sell signals in almost any market condition.
-Buy arrows (blue) and sell arrows (red) can be changed or hidden for ease of viewing.
-No lag EMA trendline featuring trend-reversal color-coding (white uptrend, black downtrend).
-Adjustable ‘calibration’ setting allows users to customize the script to work for any currency or security available through TradingView, on any exchange, simply by adjusting a number.
-Complete with backtesting strategy version of script which allows users to test various buy and sell strategies based on the alerts the script generates (see info and screenshots below).
-Backtesting strategy incorporates a user-defined adjustable date range, so users can estimate the script’s performance over specific periods of time, such as the last day, week, or month.
-Backtesting strategy utilizes a minimum protective gain setting to help you never sell for a loss. Simply adjust your minimum profit (%) per trade, and the test results will update.
-Backtesting strategy allows for pyramid buying to test various average down / double up buying strategies. Simply adjust the number of pyramid buys and the quantity of each buy.
- Free 7-day trial available for TradingView users who join our free BitcoinNinjas community.
-Free 24/7 support via BitcoinNinjas Telegram GunBot support group with script purchase.
-Fully compatible with GunBot automatic trading software (TradingView plugin is required).
-Special discount available for traders who purchase GunBot automatic trading software and the GunBot TradingView plugin from BitcoinNinjas, allowing for fully automatic trading.
-Contact us via Email or Telegram for more information, to request additional / custom screenshots, or to start your free trial.
DISCLAIMER: By using our BitcoinNinjas ‘Ninja Signals’ planning script, you agree to the BitcoinNinjas 'Terms of Use', as presented on our website (www.BitcoinNinjas.org) and as stated here. No sharing, copying, reselling, modifying, or any other forms of use are authorized for our documents, script / strategy, and the information published with them. This informational planning script / strategy is strictly for individual use and educational purposes only. This is not financial or investment advice. Investments are always made at your own risk and are based on your personal judgement. Bitcoin Ninjas is not responsible for any losses you may incur. Please invest wisely.
Moving Average Convergence/Divergence MaCD BackestingMade this to backtest simple macd trading strategy, had to set it to open long and short positions because i'm not sure how you get it to calculate otherwise.
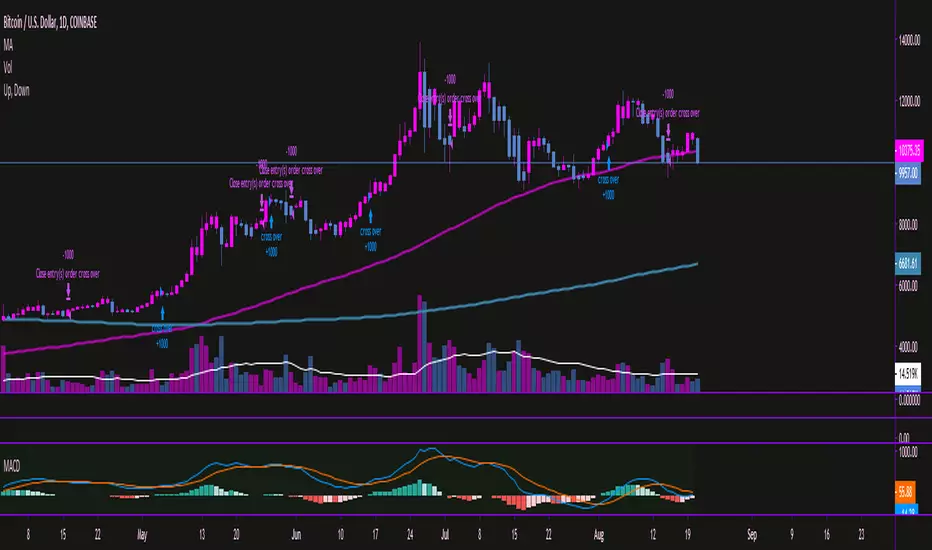
MACD + SMA 200 StrategyHere is a combination of the classic MACD (moving average convergence divergence indicator) with the classic slow moving average SMA with period 200 together as a strategy.
This strategy goes long if the MACD histogram and the MACD momentum are both above zero and the fast MACD moving average is above the slow MACD moving average. As additional long filter the recent price has to be above the SMA 200. If the inverse logic is true, the strategy goes short. For the worst case there is a max intraday equity loss of 50% filter.
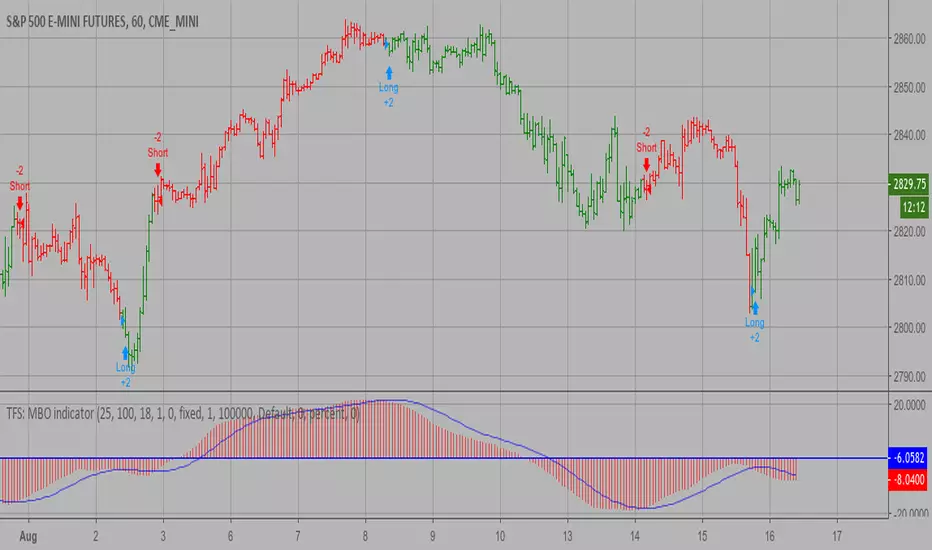
TFS: MBO Backtest MBO indicator is the third component of TFS trading system. This indicator
was developed by Bryan Strain and Mark Whitley.
The idea of MBO is similar to moving average convergence/divergence (MACD)
indicator. It is calculated by subtracting the 200-day moving average from
the 25-day moving average.
You can change long to short in the Input Settings
WARNING:
- For purpose educate only
- This script to change bars colors.
Knoxville Ultra Divergence __ S Khatri__IndiaTiny Circle = Stoch turning on smaller time frame
Small Circle = Stoch turning on current time frame
Normal Circle =Stoch turning on Higher Time frame

14/28 Day SMA Divergence and RSI - No RepaintIf you are interested in purchasing my algorithmic trading bot that receives Tradingview indicator alerts via email and then executes them in Bittrex, please visit my product page here: ilikestocks.com Additionally, I would love to create video/blog guides on creating Tradingview scripts or strategies. If you are a knowledgeable in finance or other related fields and would like to be featured on my page, please contact me at tanner@ilikestocks.com.
No crossovers were used in this script, and this is likely the reason for the no repaint(Correct me if wrong).
This strategy script uses a 14-day SMA signal line, a 28-day SMA and RSI. The strategy works by determining whether the (14-day SMA is above the 28-day SMA and the RSI levels are overbought(below 30)) or RSI is very overbought(below 13 or so). Once either of these conditions have been met, a long position is opened.
The initial long position must be partially closed by the take profit first and then the final close is executed if the 14-day signal SMA is below the 28-day SMA; you may also exclusively use take profit to close positions.
The green plotted spikes are the initial long position conditions. The orange plotted spikes are take profit signals once a long position is opened. The red plotted spikes are plotted when the SMA 14-day is below the 28-day SMA.
Please do leave constructive criticism or comments below because it helps me better create scripts!

MACD + RSI + EMA + SMA + Ichimoku + overbought + buy, sell +Doji// MACD + EMA 200 *** buy and sell strategy (RSI, EMA, SMA) *** Doji Harami *** overbought and oversold *** trend direction *** divergence *** Ichimoku
Use this script in time 1h