Divergence IndicatorDescription:
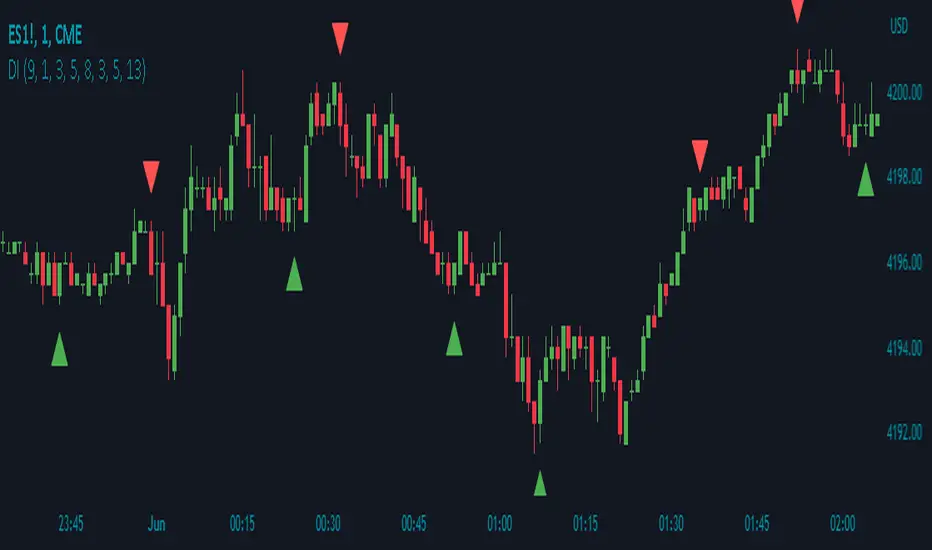
The Divergence Indicator (DI) is a powerful technical analysis tool designed to identify potential bullish and bearish signals based on multiple indicators, including RSI, Stochastic Oscillator, MACD, and EMA. It helps traders spot divergences between price and these indicators, indicating potential trend reversals or continuations.
How it Works:
The Divergence Indicator compares various indicators and their relationships with price to identify bullish and bearish signals. It considers conditions such as rising or falling values of the Stochastic Oscillator (%K), RSI, and MACD lines, as well as the crossover and crossunder of the MACD Line and Signal Line. Additionally, it evaluates the relationship between fast and slow Exponential Moving Averages (EMA) to detect divergences. When a bullish or bearish condition is met, circles are plotted on the chart to highlight the signals.
Usage:
To effectively utilize the Divergence Indicator, follow these steps:
1. Apply the DI indicator to your chart by adding it from the available indicators.
2. Customize the color settings to suit your preferences. The bullish and bearish colors determine the colors of the plotted circles.
3. Observe the circles plotted on the chart:
- Bullish circles indicate potential bullish signals.
- Bearish circles indicate potential bearish signals.
4. Interpret the signals provided by the indicator:
- A bullish signal may occur when there is price divergence accompanied by rising values of the Stochastic Oscillator (%K), RSI, and MACD lines, or when the MACD Line crosses above the Signal Line. Additionally, a histogram value close to zero may strengthen the signal.
- A bearish signal may occur when there is price divergence accompanied by falling values of the Stochastic Oscillator (%K), RSI, and MACD lines, or when the MACD Line crosses below the Signal Line. A histogram value close to zero may also strengthen the signal.
5. Be cautious of false signals by considering additional factors such as the relationship between the fast and slow Exponential Moving Averages (EMA). If the EMAs or MACD values do not support the identified divergence, the signal may be less reliable.
6. Combine the signals from the Divergence Indicator with other technical analysis tools, such as support and resistance levels, trend lines, or candlestick patterns, to confirm potential trade setups.
7. Implement appropriate risk management strategies, including setting stop-loss orders and position sizing, to manage your trades effectively and protect your capital.
Note: The Divergence Indicator provides valuable insights into potential trend reversals or continuations based on divergences between price and multiple indicators. However, it is recommended to use this indicator in conjunction with other technical analysis tools and perform thorough analysis before making trading decisions.
Cerca negli script per "Divergence"
Divergences for many indicators v2.0A gift from me to all.
This script is developed to find Divergences for many indicators. it analyses divergences and then draws line on the graph. red for negatif, lime for positive divergences.
Currently script checks divergence for RSI, MACD, MACD Histogram, Stochastic, CCI, Momentum, OBV, Diosc, VWMACD and CMF indicators. You can use some or all of these indicators to check divergences as you wish by choosing them on the menu. Also you can add/remove many other indicators to the script to check if there is divergence.
The script first calculates tops/bottoms by using higher time frame zig zag and then finds divergences.
Higher Time Frames are
if currend period 1 min => HTF = 5 mins
if currend period 3 mins => HTF = 15 mins
if currend period 5 mins => HTF = 15 mins
if currend period 15 mins => HTF = 1 hour
if currend period 30 mins => HTF = 1 hour
if currend period 45 mins => HTF = 1 hour
if currend period 1 hour => HTF = 4 hours
if currend period 2 hours => HTF = 4 hours
if currend period 3 hours => HTF = 4 hours
if currend period 4 hours => HTF = 1 day
if currend period 1 day => HTF = 1 week
if currend period 1 week => HTF = 1 week
future plan : script finds regular divergences, soon I will add hidden divergences and also I plan to add alert ;)

Divergence Indicator (any oscillator)A modification of the TV builtin "Divergence indicator" (Version 10) that can be applied to any indicator, and can be plotted on price as well.
Usage:
Add your favorite oscillator, RSI, Klinger, TSI, CMF, or anything else to a chart.
Click the little ... (More) on the oscillator.
Then add this indicator "Divergence Indicator (any oscillator)" on your oscillator of choice.
Click the settings on this indicator and make sure the source is set to the right plot from your oscillator.
Watch for it to plot divergences...
Add this indicator a second time on the price chart (and select the same oscillator plot), but check the box "plot on price (rather than on indicator)""
See you divergence plotted on price (as well as on the oscillator)

Divergence Finder [Multigrain]█ OVERVIEW
This indicator is a divergence finder, designed to be overlayed on top of any oscillator. By utilizing an Exponential Moving Average, rather than built-in pivot functions, this allows for insignificant pivots of the oscillator to be filtered out. Additionally, by sampling more than just the previous oscillator pivot, this allows for divergences to be found that would otherwise be overlooked through other methods.
█ CONCEPTS
Interim Price Threshold
A new metric used when determining valid divergences is the Interim Price Threshold (IPT). The IPT is the maximum percent delta the price is allowed to "poke-through" the divergent line at any given time.
Interim Oscillator Threshold
Similar to the Interim Price Threshold, the Interim Oscillator Threshold (IOT) is the maximum percent delta the oscillator is allowed to "poke-through" the divergent line at any given time.
Dynamic Midline
Commonly a static midline is utilized when determining whether a divergence may be bullish or bearish. By utilizing the built-in percentile nearest rank function, the midline is automatically and dynamically determined based on the previous 250 bars. As a result certain divergences which may otherwise be overlooked will be discovered.
█ SETTINGS
Oscillator Source: The oscillator in which you want find divergences from. Default to a MACD oscillator when unchanged.
Price Source: The price source in which you want to find divergences from.
Moving Average Length: The length of the exponential moving average used when determining the pivot points of the selected oscillator.
█ USAGES
Divergence in technical analysis can indicate a significant bullish or bearish price move. A bullish divergence occurs when an asset's price makes a new low while an indicator begins to rise. A bearish divergence occurs when the price makes a new high but the indicator under consideration makes a lower high.

Divergence Indicator Multi [TradingFinder] MACD AO RSI DIV Chart🔵 Introduction
🟣 What is Divergence in Financial Markets?
Divergence in technical analysis happens when the price of a stock moves in a direction opposite to certain indicators. This is a crucial concept in financial markets as it can signal either a trend reversal or a continuation of the current correction in the trend. Understanding divergence helps traders and analysts make more informed decisions.
🟣 Positive Regular Divergence (RD+)
A positive regular divergence occurs at the end of a downtrend, where two price lows form. This divergence appears when the price chart shows a new low, but the indicator does not follow, signaling potential buying opportunities.
Positive divergence indicates increased buying pressure and reduced selling pressure, making it a useful signal for forecasting price increases.
🟣 Negative Regular Divergence (RD-)
A negative regular divergence is seen during an uptrend when two price highs form. The price chart records a new high, but the indicator does not reflect this change, suggesting that a market downturn is likely.
This type of divergence shows strong selling pressure and weaker buying activity, which can help identify selling opportunities.
Both positive and negative divergences are powerful tools for identifying potential trend reversals and key support and resistance levels. For example, when an indicator trends upward while the price moves downward, this creates divergence, warning traders to reconsider their investment strategy.
🟣 Different Types of Divergence in Trading
1. Regular Divergence :
o Positive Regular Divergence (RD+)
o Negative Regular Divergence (RD-)
2. Hidden Divergence :
o Positive Hidden Divergence (HD+)
o Negative Hidden Divergence (HD-)
3.Time Divergence.
Note : This guide focuses specifically on Regular Divergence.
🟣 What is Regular Divergence?
Regular Divergence, often referred to as convergence, occurs when price action and indicators show conflicting patterns, usually signaling the end of a trend. Detecting regular divergence helps traders anticipate potential trend reversals or the formation of reversal patterns.
🔵 How to Use
To optimize the detection of divergence, you can adjust the Fractal Period to specify the length of time for identifying divergence patterns.
Additionally, with the Divergence Detection Method, you can select oscillators like the MACD, RSI, or AO to base divergence detection on.
Divergence in MACD :
MACD divergence occurs when the price chart forms an opposite pattern compared to the MACD line, indicating a potential price reversal.
Divergence in RSI :
In a downtrend, if the price chart forms two consecutive lows with the second lower than the first, but the RSI shows two lows with the second higher, this indicates positive regular divergence, which is a buy signal.
On the other hand, during an uptrend, if the price forms two highs with the second higher than the first, but the RSI shows the second high lower, this points to negative regular divergence, indicating a sell signal.
Divergence in AO (Awesome Oscillator) :
The AO indicator calculates histograms using the difference between 5-period and 34-period simple moving averages. It compares peaks and troughs of these histograms with price movements, detecting divergence and plotting lines and arrows to signal divergence.
🔵 Table
The following table breaks down the main features of the oscillator. It covers four critical categories: Exist, Consecutive, Divergence Quality, and Change Phase Indicator.
Exist : If divergence is detected, a "+" will appear in this row.
Consecutive: Shows the number of consecutive divergences that have formed in a short period.
Divergence Quality : Evaluates the quality of the divergence based on the number of occurrences. One is labeled "Normal," two are "Good," and three or more are considered "Strong."
Change Phase Indicator : If a phase change is detected between two oscillation peaks, this is marked in the table.

Divergence V2This indicator is based on the concept of divergence. I recommend that you find out and study about this yourself as the concept of divergence will not be explained in depth in this description.
This indicator will show divergences between the asset price and the RSI oscillator. The indicator will look for divergent points between the rising highs and falling lows of the asset; and the rising lows and falling highs of the RSI.
The trend of the asset tends to follow the behavior of the oscillator when a divergence occurs. So if we find a divergence between the two, the price of the asset is likely to follow the trend of the oscillator.
This indicator looks for these types of divergences and will show (based on the RSI) if there is a bullish or bearish divergence.
If it is bullish, it will show a line joining those points in green and if it is bearish in red. In addition, it will show a label where you can see the number of occurrences that have been found from a certain point to another.
Note: this indicator can be complemented with the “Divergence RSI V2” indicator which is also found in my library.
Settings
Backtesting Bars: is the number of bars back that the indicator will check. No more than 1000 is recommended as this will slow down the search.
Tolerance: number of times a divergent line can cross a bar. If you place 0, no bar can be crossed by a diverging line.
Min Bars To detect: will only search for divergences (or lines) that have the minimum number of bars selected in this option. Default option is 30.
Min Bars To detect: it will only search for divergences (or lines) that have the maximum number of bars selected in this option. Default option is 100.
Source Highs: The high points will be based on the close of each bar. You can use as another alternative.
Source Lows: The low points will be based on the close of each bar. You can use as another alternative.
Use squeeze parameter : only look for divergences (bullish or bearish) at times when such an indicator is in favor of the trend or coincides with the corresponding RSI divergence.

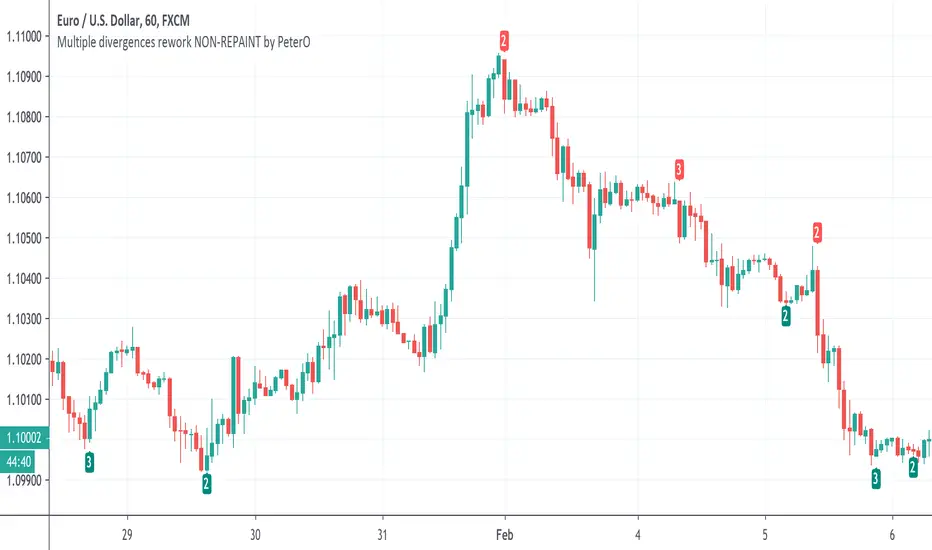
Multiple divergences NON-REPAINT by PeterODivergences are well-known tool for finding trend reversals. Powerful, yet... unreliable. Sometimes they show up, sometimes they don't. Sometimes they really mean trend end, sometimes the trend continues. I've witnessed countless discussions about which indicator to hunt for divergences on. All pointless.
Earlier today I found a very inspirational script by Lonesometheblue, combining multiple divergences together. Actually - summing them up and showing hunted divergences count in a label. Because if a divergence shows up on a single indicator like RSI, it can indeed mean trend reversal, but... yeah, check previous pargraph. But if this divergence shows up on 8 different indicators at the same time, then chances increase, don't they?
I decided to do my own version of Lonesome's indicator, because that one is using Label.New, which doesn't allow analysing entire script, only latest 50 occurences or so. I'm not going to hide it - I copy-pasted a lot from Lonesome's code. And from Everget's built-in divergences script, which you can find in PineScript/New. I didn't even bother to modify variable names or cover tracks in any other way, pretending it is my work from scratch. All with these two gentlemen consent and blessing. I added labels from myself, plus bit of rework and here it is:)
I hope you'll find it useful.
P.S. While analyzing divergences today, I discovered one thing. Hidden divergences are not useless, as many people think. But they should be used at trend dips to join the trend, not at trend ends, as reversals. Experiment yourself.
P.S.2 Still, never use only divergences. They need confirmation, they are not self-fulfilling prophecy.
Ultimate Oscillator Divergence Detector v0.1I wanted a more dynamic divergence indicator than the stock one so this is what's come of it so far. This is a very early version but I found its detecting normal bullish divergences pretty well so I thought I'd release it.
Right now it only supports normal bullish divergences. I'm working on improving accuracy before I add in normal bearish divergences, and then will be handling hidden divergences.
The spacing parameter will probably need to be tweaked based on the time frame of interest. For small time frames a value of 3 seems to work, for longer ones I go up to 7. Anything below 3 will be extremely sensitive and anything above 10 will hardly notice anything. The spacing for the example here is 3 for the main graph and 7 for the ultimate oscillator graph.

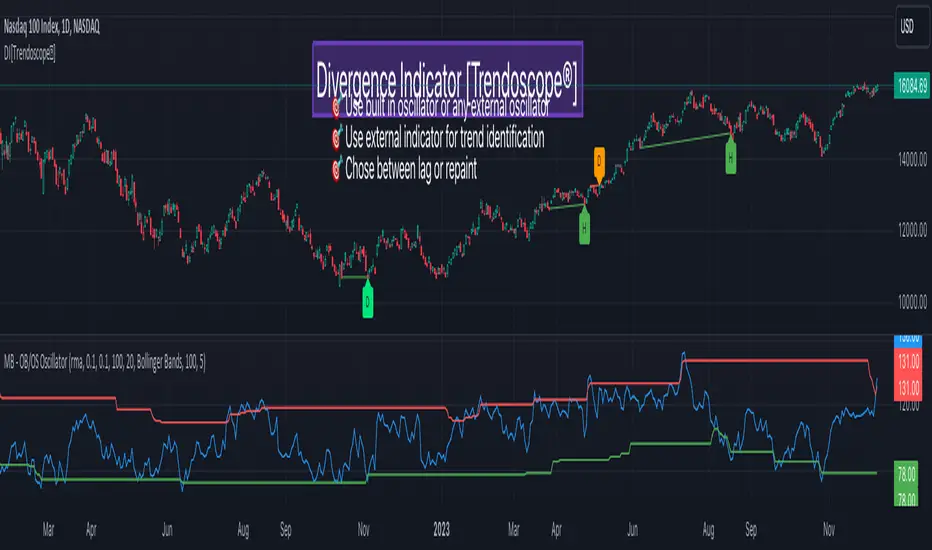
Divergence Indicator [Trendoscope®]🎲 New Divergence Indicator by Trendoscope
Our latest Divergence Indicator revolutionizes the way traders identify market trends and potential reversals. Built upon the robust foundation of the Zigzag Trend Divergence Detector and inline with our recent implementation of the Divergence Goggles indicator, this tool is designed to be intuitive yet powerful, making it an essential addition to any trader's toolkit.
We received several queries on extending the Divergence Goggles to last N bars instead of using an interactive widget. Though it is possible, we thought the better approach is to enable the indicator to use any oscillator and trend indicator in order to define the divergence.
🎯 Key Features
Flexible Oscillator Integration : Choose from a wide range of built-in oscillators or import your own, including options like the innovative Multiband Oscillator. This versatility extends to using volume indicators like OBV for divergence calculations, broadening the scope of analysis.
Trend Identification Versatility : Utilize built-in methods like Zigzag and MA Difference, or integrate external trend indicators. Our system adapts to various methods, ensuring you have the right tools for precise trend identification.
Customizable Zigzag Sensitivity : Adjust the Zigzag based on your chosen oscillator's sensitivity to ensure divergence lines are accurate and visually coherent.
Repainting vs. Delayed Signals : Tailor the indicator to your strategy by choosing between immediate repainting signals and slightly delayed but more stable signals.
🎯 Understanding Divergence: Key Rules
Bullish Divergence
Happens only in downtrend
Observed on Pivot Lows
Price makes lower low whereas oscillator makes higher low, indicating weakness and possible reversal
Bearish Divergence
Happens only in uptrend
Observed on Pivot Highs
Price makes higher high whereas oscillator makes lower high, indicating weakness and possible reversal
Bullish Hidden Divergence
Happens only in uptrend
Observed on Pivot Lows
Price makes higher low, whereas indicator makes lower low due to price consolidation. In bullish trend, this is considered as bullish as the price gets a breather and get ready to surge further.
Bearish Hidden Divergence
Happens only in downtrend
Observed on Pivot Highs
Price makes lower high whereas oscillator makes higher high due to price consolidation. In bearish trend, this is considered as bearish as the price gets a breather and get ready to fall further.
🎯 Visual Insights: Divergence and Hidden Divergence
For a clearer understanding, refer to our visual guides:
🎲 Using the Divergence Indicator: A Step-by-Step Guide
🎯 Step 1 - Selecting the Oscillator
Customize your analysis by choosing from a variety of oscillators or importing your preferred one. Options are available to select a range of built-in oscillators and the loopback length. However, if the oscillator that user want to use is not in the list, they can simply load the oscillator from the indicator library and use it as an external signal.
In our current example, we are using a custom oscillator called - Multiband Oscillator
This also means, the indicator option is not limited to oscillators. Users can even make use of volume indicators such as OBV for the calculation of divergence.
🎯 Step 2 - Choosing the Trend Identification Method
Select from our built-in methods or integrate an external indicator to accurately identify market trends. Trend is one of the key parameters of divergence type identification. Trend can be identified mathematically by various methods. Some of them are as simple as above or below 200 moving average and some can follow trend based indicators such as supertrend and others can be very complex.
To cater for a wider audience, here too we have provided the option to use an external trend indicator. The simple condition for the external trend indicator is that it should return positive value for uptrend and negative value for downtrend.
Other than that, we also have 2 built in trend identification methods.
Zigzag - The trend is defined by the starting pivot of divergence line. If the starting pivot is Higher High or Higher Low, then it is considered uptrend. And if the starting pivot is either Lower Low or Lower High, then we consider it as downtrend.
MA Difference - In this case, the difference between the moving average of pivots joining the divergence line will determine the trend. It is considered uptrend if the moving average increased from starting pivot to ending pivot of the divergence line, and it is considered downtrend if the moving average decreased from starting pivot to the ending pivot of the divergence line.
🎯 Step 3 - Adjusting Zigzag Sensitivity
Fine-tune the Zigzag to match the oscillator's sensitivity, ensuring divergence lines are accurate and visually coherent.
🎯 Step 4 - Managing Repainting
Understand the implications of repainting in the last pivot of the Zigzag and choose between immediate or delayed signals based on your trading strategy. The last pivot of the zigzag repaint by design. This is not necessarily a bad thing. Users can just choose not to use the last pivot, but instead use the last but one for all the calculations. But, this also means, the signals will be delayed.
Indicator provides option to use repainting signal vs delayed signal. If you select the repaint option, the signals are shown immediately as and when they occur. But, there is a possibility that these signals change when the new price candles change zigzag pivot.
If you chose not to select the repaint option, then the divergence signals may lag by a few bars.
Divergence Histogram for Many IndicatorHello Traders,
This script analyses divergences for 11 predefined indicators and then draws column on the graph. Red columns for negatif divergence (means prices may go down or trend reversal), Lime columns for positive divergences (means prices may go up or trend reversal)
The script uses Pivot Points and on each bar it checks divergence between last Pivot Point and current High/Low and if it finds any divergence then immediately draws column. There is no Latency/Lag.
There are predefined 11 indicators in the script, which are RSI , MACD , MACD Histogram, Stochastic , CCI , Momentum, OBV, Diosc, VWMACD, CMF and MFI.
Smaller Pivot Point Period check smaller areas and if you use smaller numbers it would be more sensitive and may give alerts very often. So you should set it accordingly.
There is "Check Cut-Through in indicators" option, I recomment you to enable it. it checks that there is cut-through in indicators or not, if no cut-through then it's shown as valid divergence.
You should see following one as well if you haven't yet:
Enjoy!

Divergence for many indicator v3Hello Everyone. Almost one year later, with Pine version 4, I developed new version of the Divergence for many Indicator.
It analyses divergences for 10 predefined indicators and then draws line on the graph. Red for negatif divergence (means prices may go down or trend reversal), Lime for positive divergences (means prices may go up or trend reversal)
Divergences version 2 has latency because it waits higher time frame completion. in this new version the script uses Pivot Points and on every bar it checks divergence between last Pivot point and current bar and if it finds any then immediately draws line and removes old one. so there is no latency with this version.
There are predefined 10 indicators in the script, you have option to choose which indicators the script would analyse for divergence. (RSI , MACD , MACD Histogram, Stochastic , CCI , Momentum, OBV, Diosc, VWMACD and CMF)
In replay mode you can see how the script puts new divergence line and removes old one. you better see it for yourself by using replay mode.
Hope you Enjoy!

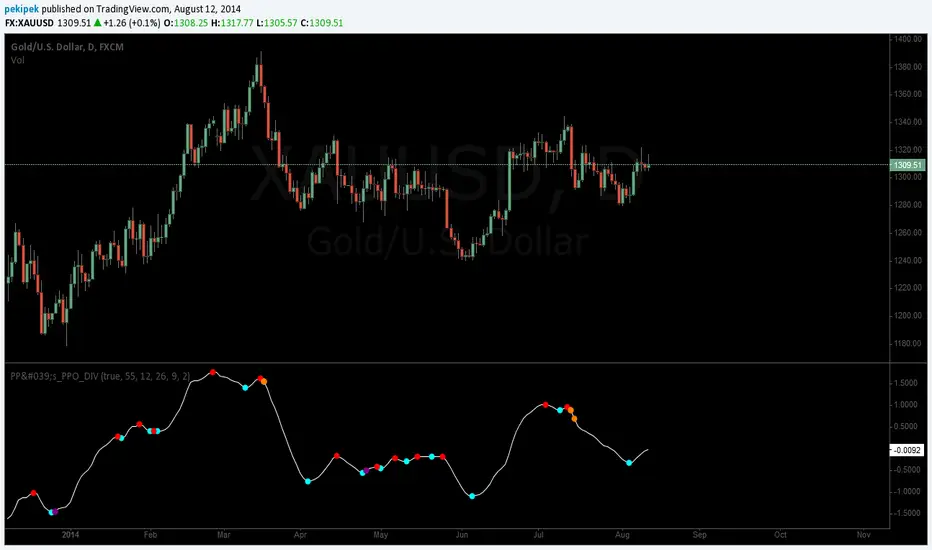
Pekipek's PPO Divergence BETABeta divergence indicator, you can exchange the Price Percentage Oscillator (PPO) for any oscillator. You can play around with the look-back period if you want to use long term divergences.
WARNING:
Because its impossible to make the look-back period of the lowest/highest functions dynamic, the indicator can plot divergences sometimes at places where there are none, however in my experience this does not occur so much. Also it is impossible to plot isolated lines, so its hard to visually see which divergence(s) exactly is(are) being signaled. Once these features become possible I can really refine the indicator.
Divergence of Stocks Above MA50 v.s. US-Stock MarketEnglish:
This indicator has been developed as an early warning tool to estimate the probability of correction in the US stock market. It works best in the daily chart.
Function:
1.) "Index-line"
The underlying stock index is converted to a scale between 0% and 100% based on its 52-week highs and lows. Where 100% is closing price at 52-week high and 0% is closing price at 52-week low.
2nd) "Stocks Above MA50".
For each major stock index, there is an index that determines the percentage of stocks above its 50 moving average. For example, for the S&P 500, this is the S5FI.
3) "Divergence
In an efficient market, both lines (index and number of stocks above the 50 MA) would run more or less in sync. A new high in the index would also mean a new high in the stocks trading above the 50 moving average. Often, however, a correction in the index is announced when the number of stocks trading above their 50 MA do not make a new, or even a lower, high while the underlying index marks a new high. The divergence signal measures this divergence of the indices. The higher the bar, the more pronounced the divergence.
How to read the indicator?
If a divergence occurs, then the stops should be tightened. As with any indicator, false signals can occur because a divergence does not automatically lead to a correction. The higher the divergence is indicated, the higher the probability. The strength of a correction cannot be predicted with the indicator.
For which symbols does the indicator work?
The indicator works exclusively for the following symbols:
S&P500: SPX, SPY, ES1!, US500 Index above MA50: S5FI
Russel2000: IWM, US2000, RTY1!, RUT, IWO Index above MA50: R2FI
NASDAQ100: NDX, NAS100, NQ1!, US100, QQQ Index above MA50: NDFI
NASDAQ: IXIC, ONEQ, QCN1!, NDAQ Index above MA50: NCFI
NYSE: XAX, NYA Index above MA50: MMFI
DowJones100: DJX, DJI, DIA, MYM1!, YM1! Index above MA50: DIFI
DowJonesComp: DOW, IYY Index above MA50: DCFI
Deutsch:
Dieser Indikator ist als Frühwarninstrument zur Einschätzung der Korrekturwahrscheinlichkeit im US-Aktienmarkt entwickelt worden. Er funktioniert am besten im Tages-Chart.
Funktion:
1.) „Index-line“
Der zugrunde liegende Aktienindex wird bezogen auf seine 52Wochen Hochs und Tiefs in eine Skala zwischen 0% und 100% umgerechnet. Dabei sind 100% Schlusskurs auf 52-Wochen Hoch und 0% Schlusskurs auf 52-Wochen Tief.
2.) „Stocks Above MA50“
Zu jedem Hauptaktienindex gibt es einen Index, der den Prozentwert der Aktien über Ihrem 50 gleitenden Durchschnitt ermittelt. Beim S&P 500 ist das z.B. der S5FI.
3.) „Divergence“
In einem effizienten Markt würden beide Linien (Index und Anzahl Aktien über dem 50 MA) mehr oder weniger synchron laufen. Ein neues Hoch im Index würde auch ein neues Hoch bei den Aktien, die über dem 50 gleitenden Durchschnitt notieren, bedeuten. Oft jedoch kündigt sich eine Korrektur im Index an, wenn die Anzahl der Aktien, die über ihrem 50 MA notieren kein neues, oder sogar ein niedrigeres Hoch machen, während der zu Grunde liegende Index ein neues Hoch markiert. Das Divergenz-Signal misst diese auseinanderlaufen der Indices. Je höher der Balken, umso stärker ist die Divergenz ausgeprägt.
Wie ist der Indikator zu lesen?
Wenn eine Divergenz auftritt, dann sollten die Stopps enger herangezogen werden. Es kann wie bei jedem Indikator zu Fehlsignalen kommen, da eine Divergenz nicht automatisch zu einer Korrektur führen muss. Die Wahrscheinlichkeit ist um so höher, je höher die Divergenz angezeigt wird. Die Stärke einer Korrektur kann mit dem Indikator nicht prognostiziert werden.
Für welche Symbole funktioniert der Indikator?
Der Indikator funktioniert ausschließlich für folgende Symbole:
S&P500: SPX, SPY, ES1!, US500 Index über MA50: S5FI
Russel2000: IWM, US2000, RTY1!, RUT, IWO Index über MA50: R2FI
NASDAQ100: NDX, NAS100, NQ1!, US100, QQQ Index über MA50: NDFI
NASDAQ: IXIC, ONEQ, QCN1!, NDAQ Index über MA50: NCFI
NYSE: XAX, NYA Index über MA50: MMFI
DowJones100: DJX, DJI, DIA, MYM1!, YM1! Index über MA50: DIFI
DowJonesComp: DOW, IYY Index über MA50: DCFI

Divergence Macd+RSI Fast[RSU] -- No RepaintThis indicator combines the divergence of rsi and macd and displays it on the candlestick chart.
RSI:
1. When rsi is at a high point, once it falls by 1 k line, it will detect the divergence from the previous high point. This can quickly find the divergence that has taken effect and help you quickly capture the trend before a sharp decline or rise.
The difference between other RSI divergence indicators: the official divergence indicator is to detect the 5 and the k line, which may lead to a large amount of decline.
2. This indicator detects the previous high and the previous low of 5, 10, 20 lengths at the same time, instead of only detecting a fixed length, so that more deviations can be found.
MACD:
1. When MACD-diff line(orange color) is at a high point, once it falls by 1 k line, it will detect the divergence from the previous high point. This can quickly find the divergence that has taken effect and help you quickly capture the trend before a sharp decline or rise.
2. This indicator detects the previous high and the previous low of 5, 10, 20, 40 , 60 lengths at the same time, instead of only detecting a fixed length, so that more divergences can be found.
Notice:
Because it is a quick divergence detection, it is recommended to confirm that the divergence takes effect after the current k is completely closed first. I have identified this state in the indicator as "k not end".
Disadvantages and Risks:
Since it is a quick discovery, there will be error identification. Error divergences will recolor to grey.
Suggestion:
Use Alert catching divergence occurrences.
Please do not:
Don't go short in the uptrend, don't go long in the downtrend.
Top divergences that occur because of a strong uptrend are usually only temporary pullbacks. Bottom divergences in persistent declines are also temporary rallies. Do not attempt to trade such low-return trades.
It is recommended to use the divergence indicator when the stock price has made a new high and retraced, and once again made a new high, because this often leads to the end of the trend.
Divergence how to use:
1. After the previous candlestick was completely closed, a bottom divergence was found.
2. Open an long order at the beginning of the second bar, or as close to the bottom as possible (because the stop loss will be smaller).
3. Break the stop loss price below the previous low where the divergence occurred, which already means that the divergence is wrong.

Divergences + Alerts (ANY Indicator)📊 Divergences + Alerts (ANY Indicator)
This versatile indicator detects four types of divergences between price action and an oscillator:
Buyer Exhaustion
Buyer Absorption
Seller Exhaustion
Seller Absorption
Each divergence type is automatically identified and visually marked on the chart with colored lines. The indicator also includes built-in alert conditions for all four divergence types, allowing traders to receive real-time notifications when potential reversal signals occur.
By default, the oscillator is a candle-style visualization of the Money Flow Index (MFI), enhanced with volatility filtering via a VWMA-based ATR. However, users can replace the default MFI oscillator with any external source using the “Plug External Source” input, enabling full customization and compatibility with other indicators.
Key features:
🔍 Detects both exhaustion and absorption divergences
🔔 Alerts for each divergence type
🕯️ Candle-style oscillator visualization
🔌 Optional input for external indicator sources
⚙️ ATR-based filtering for precision
Ideal for traders seeking to spot early signs of trend reversals or momentum shifts with customizable flexibility.

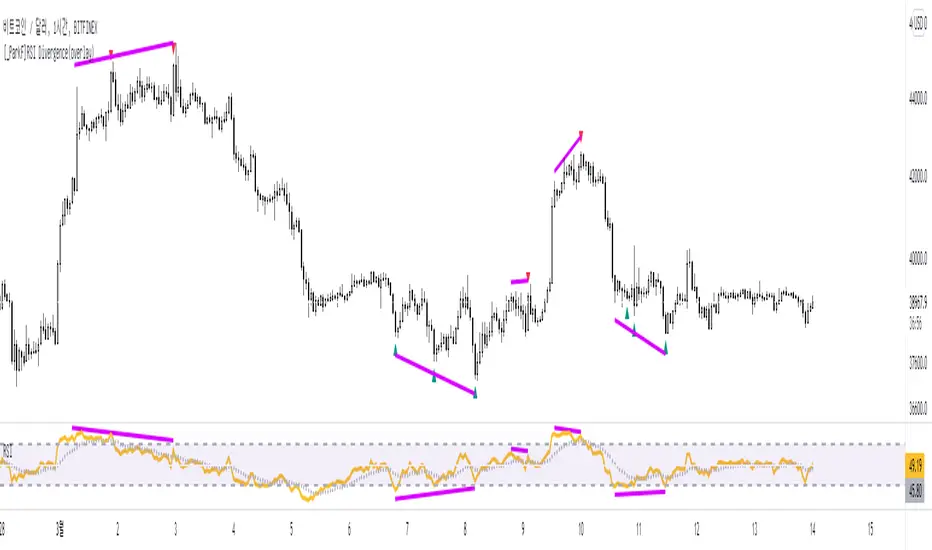
[_ParkF]RSI Divergence_overlayRSI Divergence_overlay
Does not include RSI indicator.
Up Signal = Displayed green dot below the candle
Down Signal = Dispalyed red dot above the candle
* Don't trade just at the signal
RSI 다이버전스
RSI 지표 미포함.
상승 신호 = 초록색 점으로 캔들 아래 표시.
하락 신호 = 빨간색 점으로 캔들 위에 표시.
* 신호만 보고 매매하지 마세요
Divergence-Support/ResistenceAnother script based on zigzag, divergence, and to yield support and resistence levels.
This idea started with below two concepts:
▶ Support and resistence are simply levels where price has rejected to go further down or up. Usually, we can derive this based on pivots. But, if we start looking at every pivot, there will be many of them and may be confusing to understand which one to consider.
▶ Lot of people asked about one of my previous script on divergence detector on how to use it. I believe divergence should be considered as area of support and resistence because, they only amount to temporary weakness in momentum and nothing more. As per my understanding
Trend > Hidden Divergence > Divergence > Oscillator Levels of Overbought and Oversold
⬜ Process
▶ Now combining the above two concepts - what we are trying to do here is draw support resistence lines only on pivots which has observed either divergence or hidden divergence. Continuation and indecision pivots are ignored.
▶ Input requires only few parameters.
Zigzag lengths and oscillator to be used. Oscillator periods are automatically calculated based on zigzag length. Hence no other information required. You can also chose custom oscillator via external source.
▶ Display include horizontal lines of support/resistence which are drawn from the candle from where divergence or hidden divergence is detected.
▶ Support resistence lines are colored based on divergence. Green shades for bullish divergence and bullish hidden divergence whereas red shades for bearish divervence and bearish hidden divergence. Please note, red and green lines does not mean they only provide resistence or support. Any lines which are below the price should be treated as support and any line which are above the price should be treated as resistence.
▶ Divergence symbols are also printed on the bar from where divergence/hidden divergence is detected.
↗ - Bullish Hidden Divergence
↘ - Bearish Hidden Divergence
⤴ - Bullish Divergence
⤵ - Bearish Divergence
▶ Script also demonstrates usage of libraries effectively. I have used following libraries in this code.
import HeWhoMustNotBeNamed/ zigzag /2 as zg
import HeWhoMustNotBeNamed/enhanced_ta/8 as eta
import HeWhoMustNotBeNamed/ supertrend /4 as st
Can be good combination to use it with harmonic patterns.

Divergence/Convergence v1.0 [LonesomeTheBlue]The script is developed to find Divergence/Convergence for various indicators
it counts number of Divergence/Convergence and draws arrow
Arrow length changes according to number of Divergence/Convergence
that means if there is Divergence/Convergence on one indicator then arrow length = 1
if there is Divergence/Convergence on two indicator then arrow length = 2 etc.
Currently script checks Divergence/Convergence for RSI, MACD, MACD Histogram, Momentum, CMF indicators
You can add/remove many other indicators to check if there is Divergence/Convergence

Divergence AnalyzerUnlock the potential of your trading strategy with the Divergence Analyzer, a sophisticated indicator designed to identify divergence patterns between two financial instruments. Whether you're a seasoned trader or just starting, this tool provides valuable insights into market trends and potential trading opportunities.
Key Features:
1. Versatility in Symbol Selection:
- Choose from a wide range of symbols for comparison, including popular indices like XAUUSD and SPX.
- Seamlessly toggle between symbols to analyze divergences and make informed trading decisions.
2. Flexible Calculation Options:
- Customizable options allow you to use a different symbol for calculation instead of the chart symbol.
- Fine-tune your analysis by selecting specific symbols for comparison based on your trading preferences.
3. Logarithmic Scale Analysis:
- Utilizes logarithmic scales for accurate representation of price movements.
- Linear regression coefficients are calculated on the logarithmic scale, providing a comprehensive view of trend strength.
4. Dynamic Length and Smoothing:
- Adjust the length parameter to adapt the indicator to different market conditions.
- Smoothed linear regression with exponential moving averages enhances clarity and reduces noise.
5. Standard Deviation Normalization:
- Normalizes standard deviations over 200 periods, offering a standardized view of price volatility.
- Easily compare volatility levels across different symbols for effective divergence analysis.
6. Color-Coded Divergence Visualization:
- Clearly distinguish positive and negative divergences with customizable color options.
- Visualize divergence deltas with an intuitive color scheme for quick and effective interpretation.
7. Symbol Information Table:
- An included table provides at-a-glance information about the selected symbols.
- Identify Symbol 1 and Symbol 2, along with their corresponding positive and negative divergence colors.
How to Use:
1. Select symbols for analysis using the user-friendly inputs.
2. Customize calculation options based on your preferences.
3. Analyze the divergence delta plot for clear visual indications.
4. Refer to the symbol information table for a quick overview of selected instruments.
Empower your trading strategy with the Divergence Analyzer and gain a competitive edge in the dynamic world of financial markets. Start making more informed decisions today!

Divergence for Many Indicators v4 Screener▋ INTRODUCTION:
The “Divergence for Many Indicators v4 Screener” is developed to provide an advanced monitoring solution for up to 24 symbols simultaneously. It efficiently collects signals from multiple symbols based on the “ Divergence for Many Indicators v4 ” and presents the output in an organized table. The table includes essential details starting with the symbol name, signal price, corresponding divergence indicator, and signal time.
_______________________
▋ CREDIT:
The divergence formula adapted from the “ Divergence for Many Indicators v4 ” script, originally created by @LonesomeTheBlue . Full credit to his work.
_______________________
▋ OVERVIEW:
The chart image can be considered an example of a recorded divergence signal that occurred in $BTCUSDT.
_______________________
▋ APPEARANCE:
The table can be displayed in three formats:
1. Full indicator name.
2. First letter of the indicator name.
3. Total number of divergences.
_______________________
▋ SIGNAL CONFIRMATION:
The table distinguishes signal confirmation by using three different colors:
1. Not-Confirmed (Orange): The signal is not confirmed yet, as the bar is still open.
2. Freshly Confirmed (Green): The signal was confirmed 1 or 2 bars ago.
3. Confirmed (Gray): The signal was confirmed 3 or more bars ago.
_______________________
▋ INDICATOR SETTINGS:
Section(1): Table Settings
(1) Table location on the chart.
(2) Table’s cells size.
(3) Chart’s timezone.
(4) Sorting table.
- Signal: Sorts the table by the latest signals.
- None: Sorts the table based on the input order.
(5) Table’s colors.
(6) Signal Confirmation type color. Explained above in the SIGNAL CONFIRMATION section
Section(2): Divergence for Many Indicators v4 Settings
As seen on the Divergence for Many Indicators v4
* Explained above in the APPEARANCE section
Section(3): Symbols
(1) Enable/disable symbol in the screener.
(2) Entering a symbol.
_______________________
▋ FINAL COMMENTS:
For best performance, add the Screener indicator to an active symbol chart, such as QQQ, SPY, AAPL, BTCUSDT, ES, EURUSD, etc., and avoid mixing symbols from different market allocations.
The Divergence for Many Indicators v4 Screener indicator is not a primary tool for making trading decisions.

Divergence Screener [Mr_Zed]Divergence Screener
This script allows you to scan multiple assets and timeframes for bullish and bearish divergences based on the RSI (Relative Strength Index) indicator.
Features
Supports up to 40 different assets and timeframes for simultaneous scanning.
Customizable settings for RSI period and source.
Adjustable lookback periods for identifying pivot highs and pivot lows.
Flexible range limits for filtering divergences based on the number of bars since the last pivot point.
Alerts for bullish and bearish divergences on confirmed bars.

Divergence for Many [Dimkud - v5]Strategy is based on "Divergence for Many Indicators v4 ST" strategy by CannyTolany01
which is based on "Divergence for Many Indicator" indicator by LonesomeTheBlue
This strategy is searching for divergences on 18 indicators which you can select and optimise one by one.
Additionally you can connect any other External Indicator value. (just add this indicator the the chart and select option in settings)
To the original indicator/strategy I have added 9 additional indicators:
( Money Flow Index, Williams_Vix, Stochastic RSI , SMI Ergodic Oscillator, Volume Weighted MACD , Bull Bear Power, Balance of Power , Relative Volatility Index , Logistic Settings).
Converted strategy to v5 of Pine Script.
Added Static SL/TP in percents (%).
Added filters to filter enters:
1. Volume Weighted MACD - Multi-TimeFrame Filter
(It checks for histogram to falling or rising for a set periods of bars)
2. Money Flow Index - Multi-TimeFrame Filter
(It checks if MFI Oscillator is in the set diapason.
Also It checks if MFI is falling or rising for a set periods of bars )
3. ATR filter
(check changes in fast ATR to slow ATR )
Strategy shows good backtest results on many crypto tokens on 45m - 1h periods. (with parameters optimisation for every indicator)
To find best parameters - you can enable indicators one-by one, and optimise best parameters for each of them.
Then enable all indicators with successful results.
Optimise SL/TP.
Then try to enable and optimise filters (channels etc.)
The better is to optimise parameters separately for Short and Long trading. And run two separate bots (in settings enable only Long or only Short.)
Updates:
- Added visualisation for open trades (SL/TP)
- Added Volatility filter by ATR with many options for tests.
- Fixed some small bugs.
- Added second RSI filter (you can use two RSIs with different TF or settings)
- Updated ATR volatility and MFI filter. Removed non-effective options
- Added CCI filter
- Added option to Enable/Disable visualisation of TP/SL on chart
- Fixed one small quick bug. ("ATR filter short" was not working)
- Added Super Trend filter
- Added Momentum filter
- Added Volume Filter
- All "request.security" MultiTimeFrame calls changed to 100% non-repait function "f_security()"

Divergence and Pivot - Detector For Any IndicatorI present to you an indicator capable of determining the divergence and convergence points for any indicator you choose. It will also determine Pivot points.
All you need to do is add the indicator to your favorites and call it. Next, you need a second indicator for which you want to find divergences or pivots. Next you need choise 'Oscillator Source' section in my indicator, after that you need to choose the name of the indicator for which you want to find divergences . - Done!
Thanks to the developers of TradingView for posting the source code of the "Divergence Indicator" indicator.
