RSI Divergence Indicator - Trading VidhyalayaThis indicator automatically identifies RSI-based bullish and bearish divergences and visually marks them directly on the candlestick chart, making it easier for traders to spot potential reversals.
✅ Key Features:
Bullish Divergence
When the price makes a lower low, but the RSI makes a higher low, the indicator highlights the candle with a green arrow or label to signal potential upward reversal.
Bearish Divergence
When the price makes a higher high, but the RSI forms a lower high, the indicator marks the candle with a red arrow or label to indicate a possible downside move.
Real-time Detection
Divergences are plotted in real-time, helping traders react quickly to changing market conditions.
Candlestick Overlay
Signals are shown directly on the chart, rather than below in a separate panel, allowing for faster and clearer decision-making.
📊 Benefits:
Helps in identifying early trend reversals
Works well with other indicators like MACD, Moving Averages, or Volume
Great for both beginners and advanced traders
Saves time by automating divergence spotting, reducing manual errors
Cerca negli script per "Divergence"

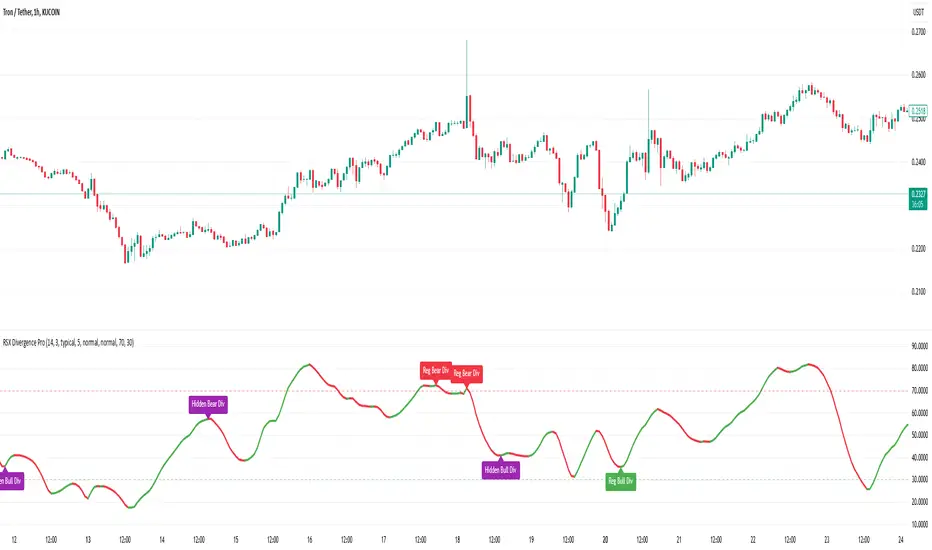
RSX Divergence ProRSX Divergence Pro detects regular and hidden divergences using a smoothed Relative Strength Xtra (RSX) oscillator. It helps traders identify trend reversals and trend continuation signals with clear visual labels. Users can enable/disable divergences, adjust RSX length, customize label colors/sizes, and choose different price types. The indicator also includes dynamic RSX coloration and adjustable overbought/oversold levels for better market insights. Perfect for traders seeking precision in divergence detection and smoother signals than traditional RSI. 🚀
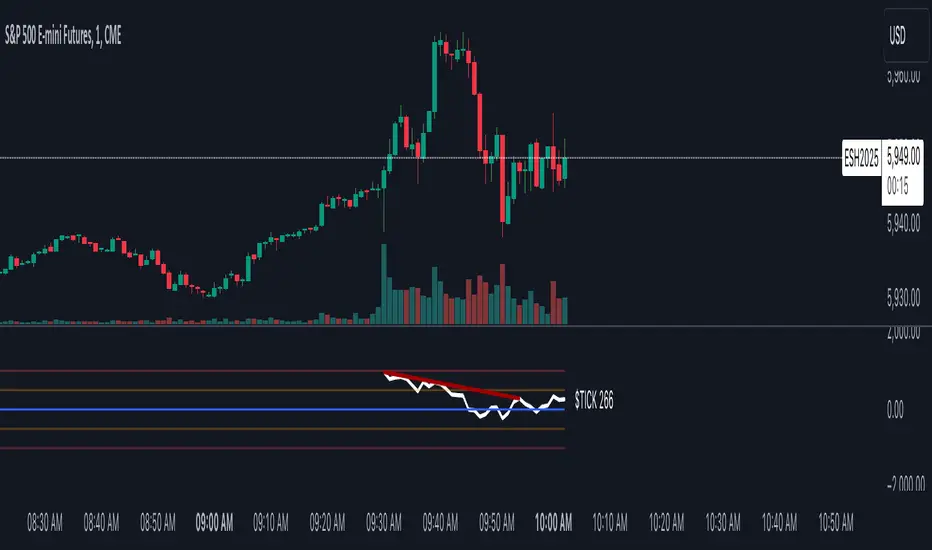
TICK Charting & DivergencesOverview
The TICK index measures the number of NYSE stocks making an uptick versus a downtick. This indicator identifies divergences between price action and TICK readings, potentially signaling trend reversals.
Key Features
Real-time TICK monitoring during market hours (9:30 AM - 4:00 PM ET)
Customizable smoothing factor for TICK values
Regular and hidden divergences detection
Reference lines at ±500 and ±1000 levels
Current TICK value display
TICK Internals Interpretation
Above +1000: Strong buying pressure, potential exhaustion
Above +500: Moderate buying pressure
Below -500: Moderate selling pressure
Below -1000: Strong selling pressure, potential exhaustion
Best Practices
Use in conjunction with support/resistance levels, market trend direction, and time of day.
Higher probability setups with multiple timeframe confirmation, divergence at key price levels, and extreme TICK readings (±1000).
Settings Optimization
Smoothing Factor: 1-3 (lower for faster signals)
Pivot Lookback: 5-10 bars (adjust based on timeframe)
Range: 5-60 bars (wider for longer-term signals)
Warning Signs
Multiple failed divergences
Choppy price action
Low volume periods
Major news events pending
Remember: TICK divergences are not guaranteed signals. Always use proper risk management and combine with other technical analysis tools.
Multi-Spectral RSI Deviations [AlgoAlpha]🌌 Multi-Spectral RSI Deviations by AlgoAlpha - Dive into Market Dynamics! 🌠
Dive deep into the essence of market trends with our 🚀 Multi-Spectral RSI Deviations indicator, a comprehensive tool designed by AlgoAlpha to enhance your trading strategy. By harnessing the power of multiple RSI lengths and innovative smoothing techniques, this indicator offers a unique perspective on market momentum and potential reversals.
🔍 Key Features:
🎨 Customizable up and down colors for immediate trend recognition.
🔢 Three RSI lengths for multi-layered market analysis.
🔄 Various Moving Average (MA) types including SMA, EMA, and more for tailored smoothing.
✅ Bullish and Bearish divergence plotting for spotting potential reversals.
🕵️♂️ Adjustable divergence sensitivity settings to fine-tune signal detection.
🔔 Built-in alerts for trend shifts and reversal conditions, ensuring you never miss a trading opportunity.
🚀 Quick Guide to Using the Multi-Spectral RSI Deviations Indicator
🛠 Add the Indicator: Search for "Multi-Spectral RSI Deviations" in TradingView's Indicators & Strategies. Adjust the RSI lengths and MA settings to suit your trading strategy.
🔍 Market Analysis: Keep an eye on the color changes for trend direction and use divergence plots to anticipate potential market reversals.
🔔 Alerts Setup: Activate the built-in alerts for trend shifts and reversals to stay ahead of the game without having to constantly monitor the charts.
🧠 How It Works:
At the core of the Multi-Spectral RSI Deviations indicator is its ability to analyze the market through various RSI lengths, providing a comprehensive view of momentum. The indicator calculates the Relative Strength Index (RSI) over three different periods, creating a spectrum of momentum insights. These RSI values are then compared to each other to identify the momentum shifts within the market.
To refine these insights, the differences between these RSI values are smoothed using a selected Moving Average type, such as SMA, EMA, etc., based on user preference. This smoothing process helps in highlighting the overall trend direction and potential reversal points with greater clarity.
Furthermore, the indicator employs a color-coding system, where the plotted line changes color based on the momentum's direction—shifting to an up color for positive momentum and a down color for negative momentum. This visual cue enables traders to quickly discern the market trend at a glance.
Divergences between the price action and the indicator's values are another cornerstone of this tool. By plotting potential bullish and bearish divergences, the indicator provides early signals of possible trend reversals, offering traders a strategic advantage.
Embrace the power of our 🌌 Multi-Spectral RSI Deviations and elevate your trading to stellar heights! 🌠✨

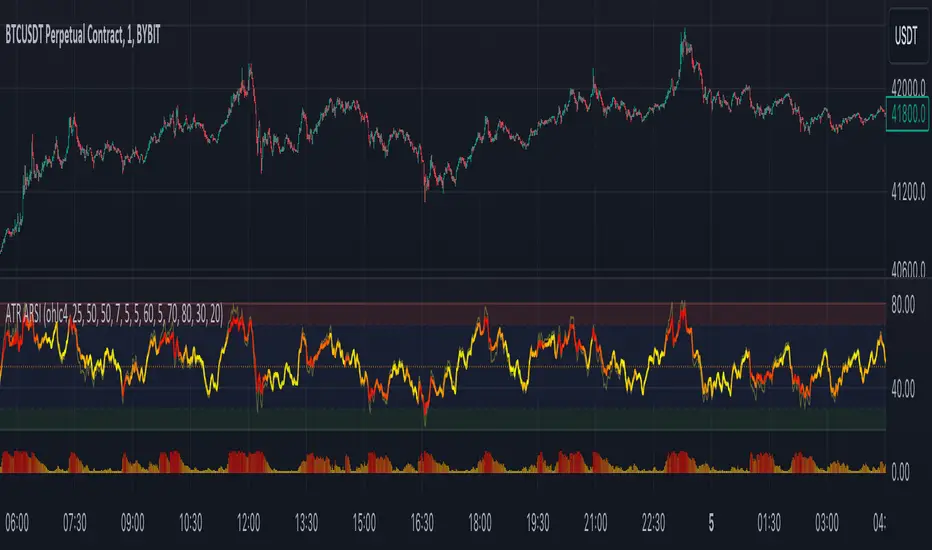
ATR Adaptive RSI OscillatorThe " ATR Adaptive RSI Oscillator " is a versatile technical analysis tool designed to help traders make informed decisions in dynamic market conditions. It combines the Relative Strength Index (RSI) with the Average True Range (ATR) to provide adaptive and responsive insights into price trends.
Key Features :
Adaptive RSI Periods : The indicator introduces the concept of adaptive RSI periods based on the ATR (Average True Range) of the market. When enabled, it dynamically adjusts the RSI calculation period, offering longer periods during high volatility and shorter periods during low volatility. This adaptability enhances the accuracy of RSI signals across varying market conditions.
Volume-Based Smoothing : The indicator includes a smoothing feature that computes a time-decayed weighted moving average of RSI values over the last two bars, using volume-based weights. This approach offers a time-sensitive smoothing effect, reducing noise for a clearer view of trend strength compared to the standard RSI.
Divergence Detection : Traders can enable divergence detection to identify potential reversal points in the market. The indicator highlights regular bullish and bearish divergences, providing valuable insights into market sentiment shifts.
Customizable Parameters : Traders have the flexibility to customize various parameters, including RSI length, adaptive mode, ATR length, and divergence settings, to tailor the indicator to their trading strategy.
Overbought and Oversold Levels : The indicator includes overbought (OB) and oversold (OS) boundary lines that can be adjusted to suit individual preferences. These levels help traders identify potential reversal zones.
The "ATR Adaptive RSI Oscillator" is a powerful tool for traders seeking to adapt their trading strategies to changing market dynamics. Whether you're a trend follower or a contrarian trader, this indicator provides valuable insights to support your decision-making process.
Dark Energy Divergence OscillatorThe Dark Energy Divergence Oscillator (DEDO)
What makes The Universe grow at an accelerating pace?
Dark Energy.
What makes The Economy grow at an accelerating pace?
Debt.
Debt is the Dark Energy of The Economy.
I pronounce DEDO "Deed-oh", but variations are fine with me.
Note: The Pine Script version of DEDO is improved from the original formula, which used a constant all-time high calculation in the normalization factor. This was technically not as accurate for calculating liquidity pressure in historical data because it meant that historical prices were being tested against future liquidity factors. Now using Pine, the functions can be normalized for the bar at the time of calculation, so the liquidity factors are normalized per candle, not across the entire series, which feels like an improvement to me.
Thought Process:
It's all about the liquidity. What I started with is a correlation between major stock indices such as SPX and WRESBAL , a balance sheet metric on FRED
After September 2008, when QE was initiated, many asset valuations started to follow more closely with liquidity factors. This led me to create a function that could combine asset prices and liquidity in WRESBAL , in order to calculate their divergence and chart the signal in TradingView.
The original formula:
First, we don't want "non-QE" data. we only want data for the market affected by QE .
So, find SPX on the day of pre-QE: 1255.08 and subtract that from the 2022 top 4818.62 = 3563.54
With this post-QE SPX range, now you can normalize the price level simply by dividing by the range = ( SPX -1255.08)/3563.54)
Normalization produces values from 0 to 1 so that they can be compared with other normalized figures.
In order to test the 0 to 1 normalized SPX range measure against the liquidity number, WRESBAL , it's the same idea: normalize it using the max as the denominator and you get a 0 to 1 liquidity index:
( WRESBAL /4276000000000)
Subtract one from the other to get the divergence:
(( WRESBAL /4276000000000)-(( SPX -1255.08)/3563.54))*10
x10 to reduce decimal places, but this option is configurable in DEDO's input settings tab.
Positive values indicate there's ample liquidity to hold up price or even create bullish momentum in some cases. Negative values mean price levels are potentially extended beyond what liquidity levels can support.
Note: many viewers of the charts on social media wanted the values to go down in alignment with price moving down, so inverting the chart is what I do with Option + I. I like the fact that negative values represent a deficit in liquidity to hold up price but that's just me.
Now with Pine Script and some help from other liquidity focused accounts on TradingView , I was able to derive a script that includes central bank liquidity and Reverse Repo liquidity drain, all in one algorithm, with adjustable settings.
Central bank assets included in this version:
-JPY (Japan)
-CNY (China)
-UK (British Pound)
-SNB (Swiss National Bank)
-ECB (European Central Bank )
Central Bank assets can be adjusted to an allocation % so that the formula is adjusted for the market cap of the asset.
A handy table in the lower right corner displays useful information about the asset market cap, and percentage it represents in the liquidity pool.
Reverse repo soak is also an optional addition in the Input settings using the RRPONTSYD value from FRED. This value is subtracted from global liquidity used to determine divergence since it is swept away from markets when residing in the Fed's reverse repo facility.
There is an option to draw a line at the Zero bound. This provides a convenience so that the line doesn't keep having to be redrawn on every chart. The normalized equation produces a value that should oscillate around zero, as price/valuation grows past liquidity support, falls under it, and repeats in cycles.

KDJ [JoseMetal]============
ENGLISH
============
- Description:
This indicator is a modification of the common KDJ, as you may know the KDJ is just a Stochastic (K+D) with an extra line which is J, the J line can be used as "movement strength" filter and also for overbought and oversold conditions anticipating the K and D.
In this particular modification I've tested many different settings to find the best possible ones, it also has customizable MA type for the calculation and a histogram calculated with the difference between J and D, this is useful to spot divergences and determine trend strength easily, the histogram has a smooth option to make it even more clearer.
- Visual:
So you have K and D from the Stochastic (green and red lines) as well as the J line (white).
Then you have the histogram to show the difference between J and D, the histogram has a similar color scale as a MACD to determine the strength of the trend easily, lighter = stronger, darker = weaker, there are 2 default customizable color setups by the way.
Crossovers between lines (which generates LONG and SHORT entries) are presented with a DOT (green for long and red for short).
Background color also changes, green for bullish, red for bearish, crossovers also marks the background color even more.
- Customization:
As usual in my indicators, everything is customizable, you can pick yours, settings, colors, figures etc.
- Usage and recommendations:
I've tested many different setting setups, for now, the best are the default (14, 21, 21) for the KDJ and (7) for the histogram smooth, 20 and 80 for oversold and overbought levels.
Histogram is great to spot divergences, I recommend to wait for a divergence on a 4H timeframe and wait for the LONG or SHORT signal to appear to enter a trade in the divergence direction.
Enjoy!
============
ESPAÑOL
============
- Descripción:
Éste indicador es una modificación del KDJ común, como sabrás el KDJ es solo un estocástico (K+D) con una línea extra que es la J, la línea J puede ser usada como filtro de "fuerza de movimiento" y también para condiciones de sobrecompra y sobreventa anticipando la K y la D.
En esta modificación en particular he probado muchas configuraciones diferentes para encontrar las mejores posibles, también tiene un tipo de MA personalizable para el cálculo y un histograma calculado con la diferencia entre J y D, esto es útil para detectar divergencias y determinar la fuerza de la tendencia fácilmente, el histograma tiene una opción suave para hacerlo aún más claro.
- Visual:
Por lo tanto, tenemos por un lado la K y D del estocástico (líneas verde y roja), así como la línea J (blanco).
Luego tenemos el histograma para mostrar la diferencia entre J y D, el histograma tiene una escala de colores similar a la del MACD para determinar la fuerza de la tendencia fácilmente, más claro = más fuerte, más oscuro = más débil, hay 2 escalas de color personalizables por defecto.
Los cruces entre líneas (que generan entradas LARGAS y CORTAS) se presentan con un PUNTO (verde para LARGO y rojo para CORTO).
El color de fondo también cambia, verde para alcista, rojo para bajista, los cruces también resaltan el color de fondo aún más.
- Personalización:
Como es habitual en mis indicadores, todo es personalizable, puedes elegir los tuyos, ajustes, colores, figuras, etc.
- Uso y recomendaciones:
He probado muchas configuraciones diferentes, por ahora, las mejores son las predeterminadas (14, 21, 21) para el KDJ y (7) para el histograma suave, 20 y 80 para los niveles de sobreventa y sobrecompra.
El histograma es excelente para detectar divergencias, recomiendo esperar una divergencia en un marco de tiempo de 4H y esperar a que aparezca la señal de LARGO o CORTO para entrar en una operación en la dirección de la divergencia.
¡Que lo disfrutéis!

Jurik Smoothed Stochastic - TraderHalaiJurik Smoothed Stochastic
The stochastic indicator has been long used by traders to identify inflection points in the price and to give a direction on Bullish and Bearish bias.
This indicator aims to improve on the plots the %K value smoothed using a Jurik Filter instead of a simple moving average. This allows for a more adaptive K value average price, whilst also providing superior smoothing to traditional moving averages.
As the Jurik Filter is a proprietary and non-open-source implementation, this script uses a common filters library implementation of Jurik MA which is a suitable proxy to the actual Jurik MA filter.
Big thanks to LastGuru for making his version freely available. You can find his version of the Jurik Filters in the credits section below.
%K is the Jurik Smoothed Version of the original Stochastic Formula
%D is calculated using the following formula. This idea was borrowed from John Ehler’s stochastic implementation and can be seen below:
%D = 0.05 + 0.95 * K
Features
%K line, Overbought and Oversold level and Mid Line Level
Oversold / Overbought reversal indicators and signals - Shown in Red and Green
Bullish / Bearish Divergences – Including Hidden divergences to spot reversals and continuations of trend (Big thanks to the developers of the built-in RSI Divergence indicator) - Shown as below:
Bullish / Bearish crossover of %K with %D - Shown in Cyan and Fuschia
Alerts for all of the above conditions
Double Jurik smoothing mode - similar to slow Stochastic
Credits :
Massive shoutout to the following scripts:
LastGuru JurikMA implementation (Common Filters Library)
Divergence Indicator – Built into TradingView and coded by TradingView Developers
This script is published as open source to allow for criticism, further development of this strategy and use by the community. Feel free to use this indicator/source code as you see fit.
Enjoy! :)

Trend Momentum Divergence (TMD)Shout out to Lazy Bear, Bunghole, and Trading View for script code for this make.
In this study you will have a visual representation of the strength and momentum of a trend and possibilities of where the market is heading. You can use the Blue and White momentum waves to spot divergences in a up oe down trend for potential reversals. When a green dot appears under the lower level with divergence then it is a indication that we should consider looking to buy. If the red dot appears over the upper level with divergence we should be looking to short/sell. The custom MFI indicator determines how much money is flowing into the market. If it is green that means money is flowing into the market and if it shows red it means that money is flowing out of the market. You can spot divergences in the money flow as well as the RSI. The Blue and Green lines from the RCI3line indicator are used for higher timeframe momentum based on current chart timeframe and we can see when they cross over.

Cryptogrithm's Secret Momentum and Volatility IndicatorThis indicator is hard-coded for Bitcoin, but you may try it on other asset classes/coins. I have not updated this indicator in over 3 years, but it seems to still work very well for Bitcoin.
This indicator is NOT for beginners and is directed towards intermediate/advanced traders with a sensibility to agree/disagree with what this indicator is signalling (common sense).
This indicator was developed back in 2018 and I has not been maintained since, which is the reason why I am releasing it. (It still works great though! At the time of this writing of May 2022).
How to use:
Terms:
PA (Price Action): Literally the candlestick formations on your chart (and the trend formation). If you don't know how to read and understand price action, I will make a fast-track video/guide on this later (but in the meanwhile, you need to begin by learning Order-Flow Analysis, please google it first before asking).
CG Level (Cryptogrithm Level/Yellow Line): PA level above = bullish, PA level below = bearish
CG Bands (Cryptogrithm Bands): This is similar to how bollingers work, you can use this the same was as bollinger bands. The only difference is that the CG bands are more strict with the upper and lower levels as it uses different calculations to hug the price tighter allowing it to be more reactive to drastic price changes (earlier signals for oversold/overbought).
CG Upper Band (Red Upper Line): Above this upper bound line means overbought.
CG Middle Band (Light Blue Line): If PA trades above this line, the current PA trend is bullish continuing in the uptrend. If PA trades below this line, the current PA trend is bearish continuing in the downtrend. This band should only be used for short-term trends.
CG Lower Band (Green Lower Line): Below this lower bound line means oversold.
What the CG Level (yellow line) tells you:
PA is trading above CG Level = Bullish
PA is trading below CG Level = Bearish
Distance between CG Level and price = Momentum
What this means is that the further away the price is from the CG Level, the greater the momentum of the current PA trend. An increasing gap between the CG Level and PA indicates the price's strength (momentum) towards the current upward/downward trend. Basically when the PA and CG Level diverge, it means that the momentum is increasing in the current trend and when they converge, the current trend is losing momentum and the direction of the PA trend may flip towards the other direction (momentum flip).
PA+CG Level Momentum:
To use the CG Level as a momentum indicator, you need to pay attention to how the price and the CG level are moving away/closer from each other:
PA + CG Level Diverges = Momentum Increasing
PA + CG Level Converges = Momentum Decreasing
Examples (kind of common sense, but just for clarity):
Case 1: Bullish Divergence (Bullish): The PA is ABOVE and trending AWAY above from the CG Level = very bullish, this means that momentum is increasing towards the upside and larger moves will come (increasing gap between the price and CG Level)
Case 2: Bearish Convergence (Bearish): - The PA is ABOVE the CG Level and trending TOWARDS the CG Level = bearish, there is a possibility that the upward trend is ending. Look to start closing off long positions until case 1 (divergence) occurs again.
Case 3: Neutral - The PA is trading on the CG Level (no clear divergence or convergence between the PA and CG Level) = Indicates a back and forth (tug of war) between bears and bulls. Beware of choppy price patterns as the trend is undecisive until either supply/liquidity is dried out and a winner between bull/bear is chosen. This is a no trade zone, but do as you wish.
Case 4: Bearish Divergence (Bearish): The PA is BELOW and trending AWAY BELOW from the CG Level = very bearish, this means that momentum is increasing towards the downside and larger downward moves will come (increasing gap between the price and CG Level).
Case 5: Bullish Convergence (Bullish): - The PA is BELOW the CG Level and trending TOWARDS the CG Level = bullish, there is a possibility that the downward trend is ending and a trend flip is occuring. Look to start closing off short positions until case 4 (divergence) occurs again.
CG Bands + CG Level: You can use the CG bands instead of the PA candles to get a cleaner interpretation of reading the momentum. I won't go into detail as this is pretty self-explanatory. It is the same explanation as PA+CG Level Momentum, but you are replacing the PA candles with the CG Bands for interpretation. So instead of the PA converging/diverging from the CG Level, the Upper and Lower Bound levels are converging/diverging from the CG level instead.
Convergence: CG Level (yellow line) trades inside the CG bands
Divergence: CG Level (yellow line) trades outside the CG bands
Bullish/Bearish depends on whether the CG Band is trading below or above the CG level. If CG Band is above the CG Level, this is bullish. If CG Band is below the CG level, this is bearish.
Crosses (PA or CG Band crosses with CG level): This typically indicates volatility is incoming.
There are MANY MANY MANY other ways to use this indicator that is not explained here and even other undiscovered methods. Use some common sense as to how this indicator works (it is a momentum indicator and volatility predictor). You can get pretty creative and apply your own methods / knowledge to it and look for patterns that occur. Feel free to comment and share what you came up with!

MTF DPO-RSI IndicatorThis indicator uses the principle of taking the RSI of DPO readings across multiple time frames in order to provide trade signals and an overarching view of market conditions to the trader. My hope with creating this indicator was to present more divergence based signals than your typical indicator, while still keeping those signals at a high quality.
In the settings menu, you may specify:
Indicator Timeframe - the chart resolution that is used to calculate values.
Source DPO Length - the number of bars used to calculate the Detrended Price Oscillator value. The DPO value is the source for the RSI calculations.
DPO Hull Smoothing - how much smoothing is applied to the DPO . Smoothing is accomplished by taking a Hull Moving Average of the closing price, and using this to calculate the DPO value.
RSI Length - the number of bars used to calculate the RSI of the DPO value.
Time Multipliers 1 through 6 - use this to define what resolution each plot will represent. A value of 1 will represent the current Indicator Timeframe. A value of 3 will represent 3 times the current Indicator Timeframe, etc.
Show Plot 1 through 6 - toggles the display of plots.
How I trade with this indicator:
A value of under 30 represents an over sold state for that particular plot. A value of over 70 represents an overbought state for that plot.
Identify divergences on a lower timeframe plot which are apparent in overbought or oversold conditions, and confirm the signal with an overbought or oversold condition, or a divergence on a higher timeframe plot. Divergences which begin in oversold or overbought territory and end inside the 30-70 range tend to be more reliable signals, in my experience. Like all indicators, this is best when used in conjunction with other indicators. Trend indicators, such as double EMA's and Supertrend are my favorite pairing, and a stochastic RSI is a good tool to have as well.
This is my first published indicator! If you find unique ways to use it, drop me a message. I'd love to know what you find. :)

MACD including 6-period Forecast and Divergences█ OVERVIEW
This is my personal interpretation of the classic MACD Indicator. I am using the MACD as part of my analysis, and often I was wondering when I can expect the next signal (e.g. a Histogram cross). As I had come across some EMA forecast logics on tradingview, my goal was to use the EMA forecast calculation as basis to come to a complete MACD forecast. Here is the result.
Starting point is the classic MACD which is then plotted with MACD-Line, Signal Line and Histogram. In addition to the classic MACD, a 6 period Forecast for MACD, Signal and Histogram is available and divergences can be displayed on either the Histogram or the MACD Line.
Important:
As I am considering the closing price of the current candle as the basis for the calculation, the forecast values will REPAINT. But in my opinion this is fine as this indicator will not provide direct trading signals, but more an outlook into a potential future.
█ CALCULATION LOGIC
Below some details regarding the additional functionalities:
MACD Forecast:
The MACD Forecast is mainly based on a combination of EMA Forecasts. The inspiration for this basic forecast calculation is taken from the below tradingview members:
--> EMA Forecast input taken from "Triple MA Forecast" by yatrader2
--> Forecast Bias input taken from "Fancy Bollinger Bands" by BigBitsIO
When showing the forecast, the following options are available:
- Forecast Type: Determines if the Forecast is assuming a Flat price (last values of the MA calculation are replaced by current value) or if a Linear Regression is taken
- Number of candles taken for Linear Regression Calculation
- Bias of Forecast (Based on the recent Average True Range, the forecast values are either more bullish or more bearish calculated. "Neutral" turns off this function)
- Number of ATR Periods used to calculate Bias adjustment value
- Possibility to weight the Bias via a Multiplier - Default value is 1
Based on the above inputs, the forecasted values for MACD, Signal Line and Histogram are calculated and plotted for the next 6 periods.
Divergence Detection:
Based on the default tradingview divergence script with some adjustments:
- User can select to use either Histogram or MACD Line as basis for Divergence detection (Histogram by default)
- User can select if Divergence detection should be based on the candles including Wicks or only the Candle Bodies (Wicks by default)
█ DISCLAIMER
This is an experimental indicator and I do not know if my theory works in real life. So treat this not as financial advise, but purely for entertainment and educational purposes.
I publish this code open so that everyone can re-use it or hopefully even improve it.
Let me know if you have any ideas for improvement and if it is within my coding capabilities (which to be honest are quite limited), I will try to accomodate it.
Have fun.

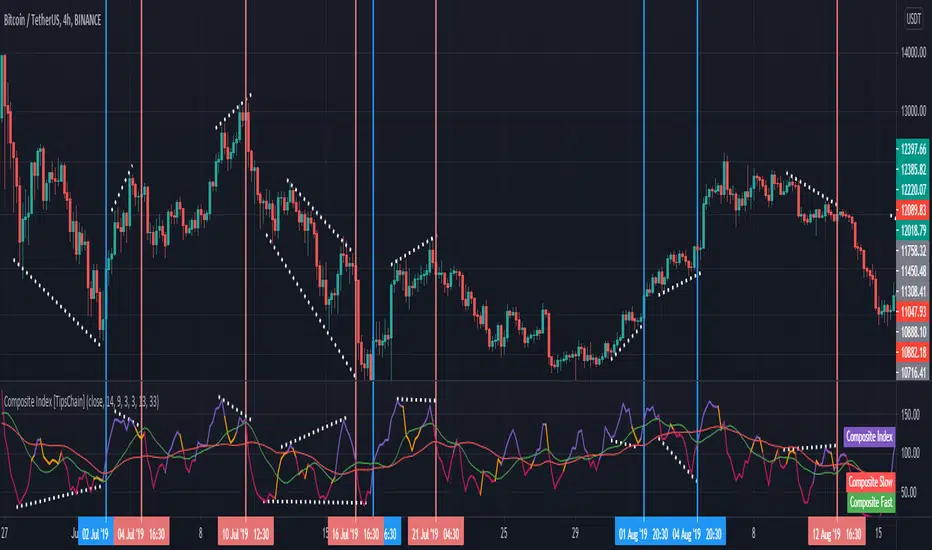
Composite Index [TipsChain]This is a formula Ms Brown developed to identify divergence failures with in the RSI . This also highlights the horizontal support levels with in the indicator area.
The Composite Index study comprises 2 momentum indicators on the RSI which are smoothed using a moving average. Control of the upper and lower indicators can be used to adjust the periods represented by each through the Object Properties dialog box for the study.
The Composite Index is an oscillator that will warn when the RSI is failing to detect a price trend reversal by forming divergences with the RSI. It can be used in any time frame or market.
Usage:
1. Check hidden and regular divergences on RSI+COMPOSITE_INDEX and PRICE+COMPOSITE_INDEX.
2. After finding divergence wait for COMPOSITE_INDEX to cross under/over it's moving averages to trigger.
RSI Divergence (Pine v4)Summary
Script highlights the divergences in RSI worth taking notice of. By comparing current envionment to relative sample we can see more than
the standard divergences that many catch through analysis. This framework aims to remove the bias or noise many see when looking for any supporting
evidence to their given emotion on a market.
Step-by-Step Walkthrough
Calculates RSI
Sets Divergence Framework
-------> a. Defining variable values, mandatory in Pine 4)
-------> b. Identify Divergences --> "If bar with lowest / highest is current bar, use it's value"
Compare high of current bar being examined with previous bar's high --> "If curr bar high is higher than the max bar high in the lookback window range"
Finds pivot point with at least 2 right candles with lower value
Finds pivot point with at least 2 right candles with lower value
Plot
Set Alerts
This RSI Script is intended for public use and can be shared / implemented as needed
Questions? I do not monitor my TradingView inbox. See email address in signature at the bottom of this page for contact information.

Bull Bear Divergence IndicatorFor Constance Brown-like analysis with divergence signals between price and indicator (i.e. stock close / RSI divergence)
Using two different lines: an indicator high line for bearish, and an indi low line for bullish divergences
For your individual studies, choose your indicator and replace rsi in line 10 with it, any thing else is auto. Script bottom: optional comparison linse addable
Note1: The script only shows divergences to recent pivots, not between actual pivot and one "a few pivots ago"
Note2: Though reversal predictions with the example of SPLK here are quite good, in general better results are obtained with un-normalized indicators.

Relative Strength Index, Divergences, color and more lines.Modified RSI technical indicator with divergences. Additional colors and more lines have been added.

Relative Strength Index - More Lines, Color and Divergence.Modified RSI technical indicator with divergences. Additional colors and more lines have been added.Enjoy.

RSI Divergence LiquidityRSI Divergence Liquidity is an indicator designed to help you catch high-probability BUY reversals by combining two powerful concepts:
OANDA:XAUUSD
Liquidity Sweep / Swing Low: automatically marks swing-low levels and tracks when price sweeps below them and reacts back.
Bullish RSI Divergence: filters noise by comparing RSI at the swing area versus RSI at the retest, favoring reversals with stronger momentum confirmation.
How it works
The script draws Swing Low lines using Pivot Lows. When a new Swing Low forms, the previous one is cut/frozen .
When price retests a Swing Low and the candle conditions are met (bar n bullish, bar n-1 bearish), the script checks:
Whether RSI at n/n-1 is higher than the RSI at the swing (bullish divergence logic)
Whether min RSI at the swing is below a threshold (default < 36) to focus on oversold swing areas
If all conditions pass, the indicator prints an upward triangle right when bar n closes → a potential BUY signal.
How to use
Enter BUY when an up triangle appears at/near the Swing Low (liquidity sweep zone).
Stop Loss idea: below the most recent swing low / below the sweep wick.
Take Profit idea: nearest supply zone, prior high, or fixed RR such as 1:2 / 1:3 depending on your system.
Recommended settings
Best on: M5–H1 (depending on your style), especially effective when price is trending down and performs a clear sweep.
For stricter filtering: lower Max minRSI at Swing (x) to only take signals from deeper RSI lows.
Smaller Pivot Lookback → more swings/signals; larger values → fewer but cleaner swings.
Note: This tool improves probability, not certainty. Combine it with market structure / key levels and proper risk management for best results.

Volume Weighted Price OscillatorThis indicator calculates the Percentage Price Oscillator (PPO), a momentum oscillator similar to the MACD. It displays the distance between two moving averages as a percentage, making it comparable across different assets. This implementation enhances the PPO with optional volume weighting and a built-in divergence engine.
Key Features:
Customizable MA & Volume Weighting: Both the fast and slow moving averages (and the signal line) can be customized using different MA types (e.g., EMA, SMA, WMA). An option (Volume weighted) applies volume weighting to all three MAs.
MACD-Style Display: Provides the three core components: the PPO line (momentum), a signal line (trigger), and a histogram (momentum acceleration). The histogram is color-coded to show increasing or decreasing momentum.
Full Divergence Suite (Class A, B, C): A built-in divergence engine automatically detects and plots all three major divergence classes between price and the PPO line:
Regular (A): Signals potential trend reversals.
Hidden (B): Signals potential trend continuations.
Exaggerated (C): Signals weakness at double tops/bottoms.
Divergence Filtering and Visualization:
Price Tolerance Filter: Divergence detection is enhanced with a percentage-based price tolerance (pivPrcTol) to filter out insignificant market noise.
Persistent Visualization: Divergence markers are plotted for the entire duration of the signal and are visually anchored to the PPO level of the confirming pivot.
Note on Confirmation (Lag): Divergence signals rely on a pivot confirmation method to ensure they do not repaint.
The Start of a- divergence is only detected after the confirming pivot is fully formed (a delay based on Pivot Right Bars).
The End of a divergence is detected either instantly (if the signal is invalidated by price action) or with a delay (when a new, non-divergent pivot is confirmed).
Multi-Timeframe (MTF) Capability:
MTF PPO Lines: The PPO, signal line, and histogram can be calculated on a higher timeframe, with standard options to handle gaps (Fill Gaps) and prevent repainting (Wait for...).
Limitation: The Divergence detection engine (pivDiv) is disabled if a timeframe other than the chart's timeframe is selected. Divergences are only calculated on the active chart timeframe.
Integrated Alerts: Includes 18 comprehensive alerts for:
The start and end of all 6 divergence types.
The PPO line crossing its signal line.
The PPO line crossing the zero line.
The histogram changing direction (reverting).
DISCLAIMER
For Informational/Educational Use Only: This indicator is provided for informational and educational purposes only. It does not constitute financial, investment, or trading advice, nor is it a recommendation to buy or sell any asset.
Use at Your Own Risk: All trading decisions you make based on the information or signals generated by this indicator are made solely at your own risk.
No Guarantee of Performance: Past performance is not an indicator of future results. The author makes no guarantee regarding the accuracy of the signals or future profitability.
No Liability: The author shall not be held liable for any financial losses or damages incurred directly or indirectly from the use of this indicator.
Signals Are Not Recommendations: The alerts and visual signals (e.g., crossovers) generated by this tool are not direct recommendations to buy or sell. They are technical observations for your own analysis and consideration.

Relative Distance to Moving AverageThis indicator calculates the Relative Distance to a Moving Average (RDMA), a momentum oscillator that measures how overextended a price is from its moving average baseline. It expresses this distance as a percentage, oscillating around a zero line. High positive values may indicate overbought conditions, while large negative values may suggest oversold conditions.
Key Features:
Customizable MA Baseline: The oscillator's baseline is a moving average. Users can select from a wide range of MA types (e.g., EMA, SMA, WMA) and apply volume weighting (Volume weighted) for enhanced responsiveness.
Normalization (Geometric Average): Includes an optional 'Normalize' mode. When enabled, the indicator uses a Geometric Moving Average (GMA) as its baseline and measures the percentage distance from this compound growth average, making it suitable for exponential markets.
Full Divergence Suite (Class A, B, C): The indicator's primary feature is its integrated divergence engine. It automatically detects and plots all three major divergence classes between price and the RDMA:
Regular (A): Signals potential trend exhaustion and reversals.
Hidden (B): Signals potential trend continuations during pullbacks.
Exaggerated (C): Signals weakness at double tops/bottoms.
Divergence Filtering and Visualization:
Price Tolerance Filter: Divergence detection is enhanced with a percentage-based price tolerance (pivPrcTol) to filter out insignificant market noise.
Persistent Visualization: Divergence markers are plotted for the entire duration of the signal and are visually anchored to the RDMA level of the confirming pivot.
Note on Confirmation (Lag): Divergence signals rely on a pivot confirmation method to ensure they do not repaint.
The Start of a- divergence is only detected after the confirming pivot is fully formed (a delay based on Pivot Right Bars).
The End of a divergence is detected either instantly (if the signal is invalidated by price action) or with a delay (when a new, non-divergent pivot is confirmed).
Multi-Timeframe (MTF) Capability:
MTF RDMA Line: The RDMA oscillator itself can be calculated on a higher timeframe, with standard options to handle gaps (Fill Gaps) and prevent repainting (Wait for...).
Limitation: The Divergence detection engine (pivDiv) is disabled if a timeframe other than the chart's timeframe is selected. Divergences are only calculated on the active chart timeframe.
Integrated Alerts: Includes 14 comprehensive alerts for:
The start and end of all 6 divergence types.
The RDMA oscillator crossing the zero line.
DISCLAIMER
For Informational/Educational Use Only: This indicator is provided for informational and educational purposes only. It does not constitute financial, investment, or trading advice, nor is it a recommendation to buy or sell any asset.
Use at Your Own Risk: All trading decisions you make based on the information or signals generated by this indicator are made solely at your own risk.
No Guarantee of Performance: Past performance is not an indicator of future results. The author makes no guarantee regarding the accuracy of the signals or future profitability.
No Liability: The author shall not be held liable for any financial losses or damages incurred directly or indirectly from the use of this indicator.
Signals Are Not Recommendations: The alerts and visual signals (e.g., crossovers) generated by this tool are not direct recommendations to buy or sell. They are technical observations for your own analysis and consideration.

MACD (classic) + Divergences (wicks & bodies, fast/slow)macd with divergences. Wicks + bodies. Two settings for right bar

Apex Edge - RSI Trend LinesThe Apex Edge - RSI Trend Lines indicator is a precision tool that automatically draws real-time trendlines on the RSI oscillator using confirmed pivot highs and lows. These dynamic trendlines track RSI structure in motion, helping you anticipate breakout zones, reversals, and hidden divergences.
Every time a new pivot forms, the indicator automatically re-draws the RSI trendline between the two most recent pivots — giving you an always-current view of momentum structure. You’ll instantly see when RSI begins compressing or expanding, long before price reacts.
Key Features: • Dynamic RSI trendlines drawn from the last 2 pivots
• Auto re-draws in real-time as new pivots form
• Optional "Full Extend" or "Pivot Only" modes
• Slope color-coded: green = support, red = resistance
• Built-in dotted RSI levels (30/70 default)
• Alert conditions for RSI trendline breakout signals
• Ideal for spotting divergence, compression, and early SMC confluence
This is not your average RSI — it’s a fully reactive momentum edge overlay designed to give you clarity, structure, and timing from within the oscillator itself. Perfect for traders using Smart Money Concepts, divergence setups, or algorithmic trend tracking.
⚔️ Built for precision. Built for edge. Built for Apex.

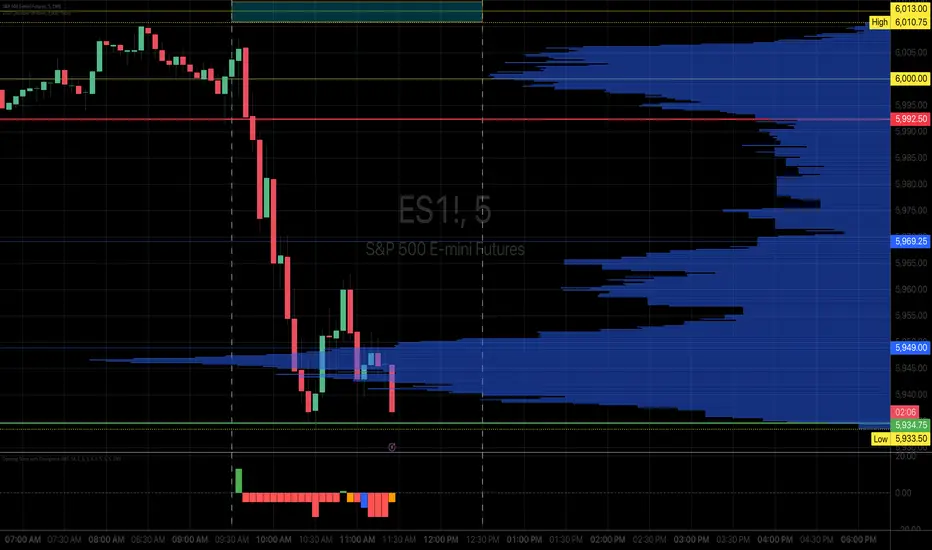
Opening Score with DivergenceOverview
The Opening Score Indicator is a versatile tool designed to help traders assess market sentiment, trend direction, and potential reversals. By combining Opening Range Breakout (ORB), VWAP, Trend, Volatility, and Divergence Detection, this indicator provides a composite score that adapts to different market conditions.
This version includes divergence detection between the Opening Score and price, which highlights potential trend reversals or continuations before they happen. When a regular divergence occurs, the histogram bar turns orange, signaling an increased probability of a trend change.
Best for Both Intraday & Longer-Term Charts
📊 Optimized for intraday trading → Works well on 1m to 30m timeframes for short-term strategies.
📈 Also effective on longer-term charts → Can be used on 1-hour, 4-hour, daily, or weekly charts to identify macro trends and momentum shifts.
🕰️ Adapts to different market conditions → Whether you’re a day trader, swing trader, or position trader, the Opening Score helps you track trend health and reversals.
How It Works
📊 Composite Opening Score Calculation
• ORB Signal → Detects bullish/bearish breakouts based on the opening range.
• VWAP Signal → Measures price positioning relative to VWAP for trend confirmation.
• Trend Signal → Uses a moving average to determine market direction.
• Volatility Signal → Tracks ATR changes to assess market strength.
• Divergence Detection → Identifies regular and hidden divergences for potential reversals or trend continuation.
🔹 Reversal Alerts with Color-Coded Histogram
• Green Bars → Normal bullish Opening Score.
• Red Bars → Normal bearish Opening Score.
• Orange Bars → Warning! Regular Divergence detected → Possible trend reversal.
🔹 Hidden & Regular Divergence Detection
• Regular Divergence (Reversal Signals)
• 📉 Bearish Regular Divergence → Price makes a Higher High, but Opening Score makes a Lower High → 🔻 Possible Downtrend Reversal.
• 📈 Bullish Regular Divergence → Price makes a Lower Low, but Opening Score makes a Higher Low → 🔼 Possible Uptrend Reversal.
• Hidden Divergence (Trend Continuation Signals)
• 📉 Bearish Hidden Divergence → Price makes a Lower High, but Opening Score makes a Higher High → 🔻 Trend Likely to Continue Down.
• 📈 Bullish Hidden Divergence → Price makes a Higher Low, but Opening Score makes a Lower Low → 🔼 Trend Likely to Continue Up.
How to Use It
✅ Watch for Reversal Alerts (Orange Bars) → These highlight potential market turning points.
✅ Use the Zero Line as a Trend Filter → A score above 0 suggests bullish conditions, while below 0 signals bearish conditions.
✅ Combine with Market Structure & Volume Profile → Works well when paired with support/resistance levels, liquidity zones, and order flow data.
✅ Adjust settings based on timeframe → Increase moving average length & lookback periods for longer-term analysis.
Why Use This Indicator?
🚀 Works for both short-term and long-term traders → Adapts to intraday and higher timeframes.
📊 Multi-Factor Analysis → Combines multiple key market indicators for better accuracy.
🎯 Customizable Weighting → Adjust the influence of each signal to suit your trading style.
✅ No Clutter – Only the Opening Score is plotted → Keeps your chart clean & efficient.
🔔 Recommended for Intraday Trading (1m – 30m) AND Longer-Term Analysis (1H – Weekly) → Use this indicator to enhance your trend detection & reversal strategy! 🚀