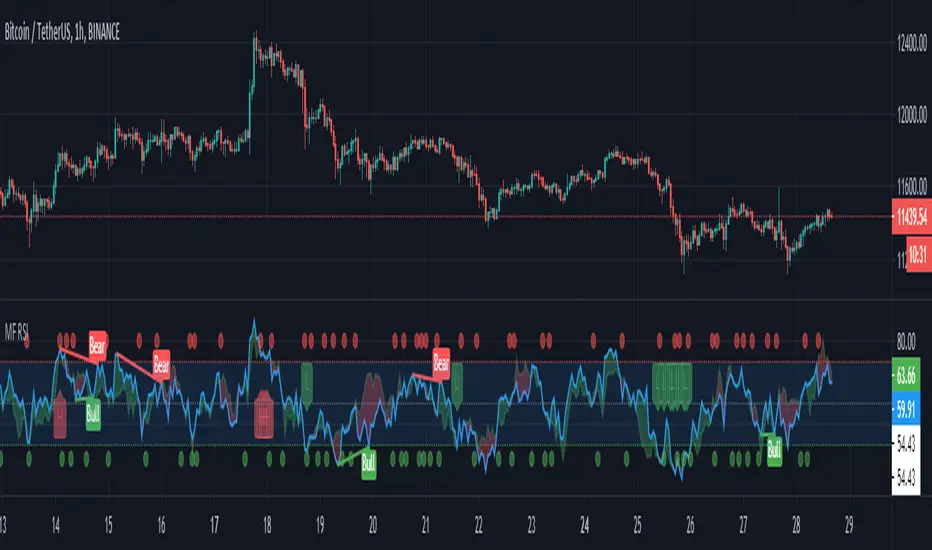
MF RSIUsing built-in code from Divergence Indicator I've created the MF RSI indicator.
A great way to combine two great indicators and divergence.
A alert condition is available on a potential reversal MFI crosses RSI on overbought or oversold.
Cerca negli script per "Divergence"
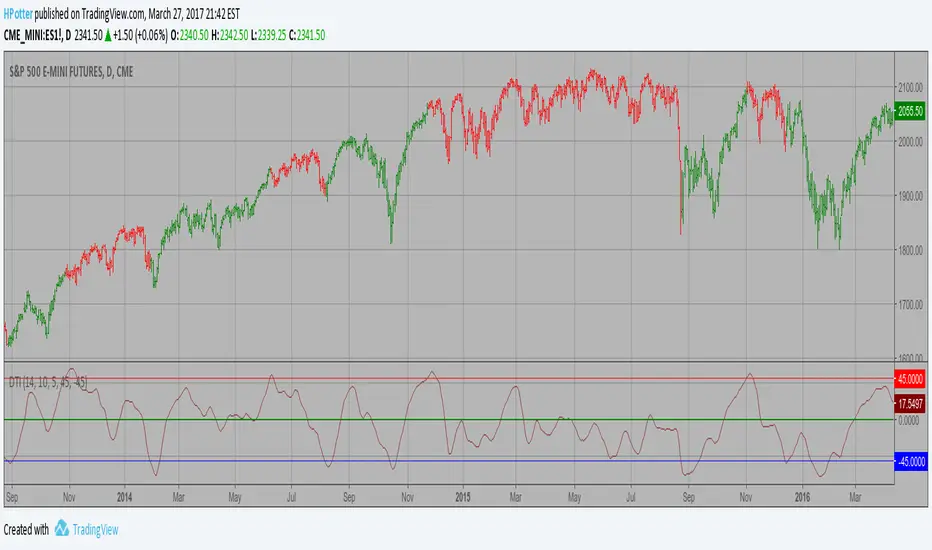
Directional Trend Index (DTI) Strategy This technique was described by William Blau in his book "Momentum,
Direction and Divergence" (1995). His book focuses on three key aspects
of trading: momentum, direction and divergence. Blau, who was an electrical
engineer before becoming a trader, thoroughly examines the relationship between
price and momentum in step-by-step examples. From this grounding, he then looks
at the deficiencies in other oscillators and introduces some innovative techniques,
including a fresh twist on Stochastics. On directional issues, he analyzes the
intricacies of ADX and offers a unique approach to help define trending and
non-trending periods.
Directional Trend Index is an indicator similar to DM+ developed by Welles Wilder.
The DM+ (a part of Directional Movement System which includes both DM+ and
DM- indicators) indicator helps determine if a security is "trending." William
Blau added to it a zeroline, relative to which the indicator is deemed positive or
negative. A stable uptrend is a period when the DTI value is positive and rising, a
downtrend when it is negative and falling.
CCI Extreme and OBV DivergenceThis is my second set of two indicators combined utilize Multi time frame analysis of 5 minutes and 15 minutes.
CCI:
Green = uptrending
Red = downtrending
Bright Green = overbought, look to go SHORT
Bright Red = oversold, look to go LONG
OBV:
this use to predict the market direction buy drawing trend line.
It is also very good indicator to sport Smart Money moment. When price move higher but OBV trend lower, smart money is taking profit and reversing their position, look to go Short to you spot this type of divergence.
Also else already not there is no holy grail indicator so I also use this set of indicator to improve the signal

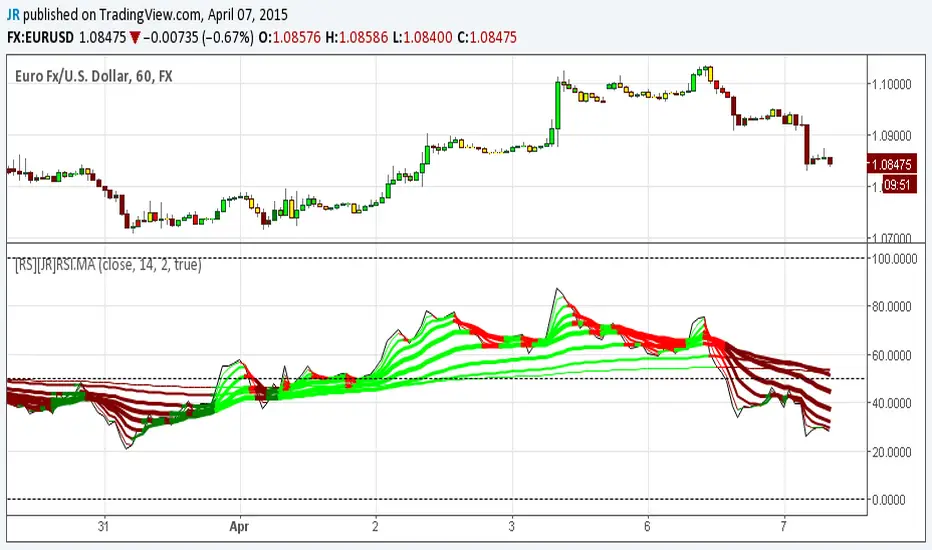
[RS][JR]RSI Ribbon + CandleRSI Ribbon + Candle
By Ricardo Santos and JR
In this chart rendering we are combining RSI and Moving Averages. For an added features we included colors to the candles and ribbons. Lime and green displays a strong bullish trend, yellow is caution or no trade, red and maroon are bearish trends. You can also find divergences using the ribbon.
Divergence
Mawreez' Aggregated DivergencesAutomatically detect regular and hidden divergences in multiple oscillators and visualize them through creative use of the histogram plot. I've open-sourced the code behind the indicator so that any user or their tech-savvy friend may easily add more oscillators of their choice.
Known bugs:
When two divergences occur within the same lookback period, only the first one is found.
There is some overhead when searching for tops and bottoms.
The oscillator and price source are still allowed to cross the trendline connecting their respective tops and bottoms.
Planned features:
Some mechanism to warn for divergences which are still awaiting confirmation.
More sophisticated method for finding tops and bottoms.

SP - MACD with DivergenceIdentifies Bullish and Bearish Divergences on any time frame.
Using with a combination of candlestick and a trend bias based on long term trend of the underlying can pic reversals quiet effectively.

MARA + IREN / BTC Divergence Monitor (v6, fixed)This indicator tracks the relative performance of two major Bitcoin miners — MARA (Marathon Digital Holdings) and IREN (Irene Energy) against Bitcoin (BTC). It calculates smoothed ratios (Miner Price ÷ BTC Price) for each miner and automatically detects divergences and convergences between them.

icreature RSI Divergence + OB/OSThis script simply showing all divergences and fill in colours when ob or os . Enjoy!
LEAP Put Edge — Top Risk Oscillator (v6, divergences + HTF)Pinpoint market tops with precision — a composite oscillator built to spot exhaustion, bearish divergences, and high-probability LEAP Put entry zones.
The LEAP Put Edge — Top Risk Oscillator is designed specifically to help identify high-probability entry points for long-dated Put options (LEAPs) by highlighting exhaustion at market tops. Unlike generic overbought/oversold tools, it combines slower MACD and DMI/ADX for trend quality, RSI and Stochastic RSI for momentum extremes, volume spike and upper-wick exhaustion signals for capitulation risk, and optional bearish divergences in RSI and MACD to confirm weakening strength. The output is a smoothed composite score scaled from -100 to +100, where higher values indicate rising top-risk and bearish edge conditions. Clear thresholds, color-coded plots, and built-in alerts make it straightforward and practical for traders seeking simple, actionable signals to time Put entries with confidence.

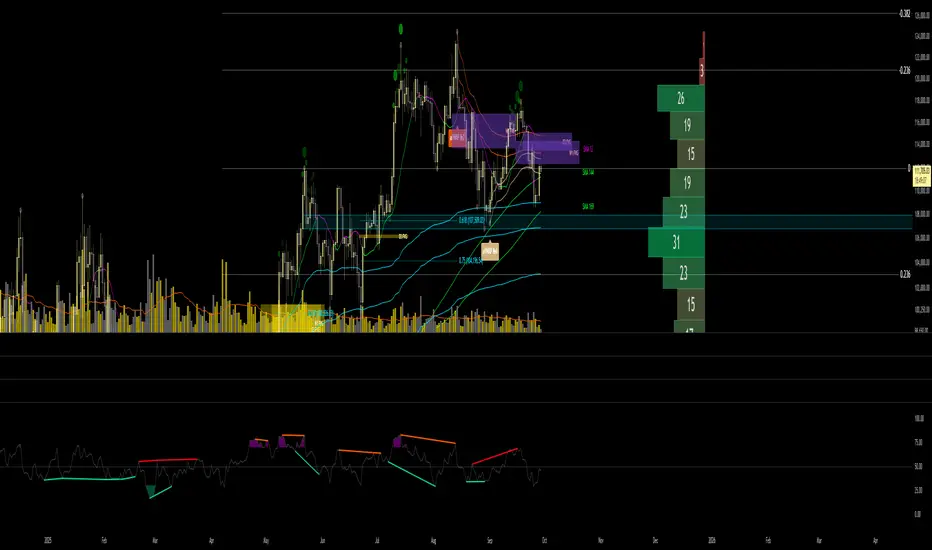
True stock performance based on EY Bar divergenceI created this indicator to be used in conjunction with my other indicator "True stock performance based on Earnings Yield". I've detailed in that description how true performance is calculated. In short it measures how much EY is moving in relation to the stock price. The theory is that if stock price is moving heavily while EY isn't you have a sentiment driven trend and the stock isn't traded on fundamentals.
This indicators marks bars when stock performance divergences from true performance.
Green upward triangle = The true performance closes lower than previous while stock price is closing higher. This indicates a optimistic sentiment as stock price is pushed up even though price based on EY is moving down.
Red downward triangle = The true performance closes higher than previous while stock price closing lower. This indicates a negative sentiment as stock price is pushed down even though price based on EY is moving up.
How do I use it?
I use it to confirm when sentiment has taken taken over a stock. If you have a fair uptrend (when both stock performance and true performance are doing higher highs), optimistic divergencies are welcome. I've used NVIDIA from 2017 to 2019 to demonstrate.
But if true performance starts to make lower highs while stock performance keeps going up and you see optimistic divergencies, you can tell that the market is getting overoptimistic.
When the stock had crashed it eventually bottomed and started to make higher lows together with an uptrend of true performance, which I count as a fair uptrend. Regardless of that you start to see some negative divergencies indicating that people are scared that the stock will drop again and oversell. These opportunities can be good places to buy more.
But i don't care about earnings, I'm a technical trader. Do i have any use for it?
You possibly could, yes. If you want to follow the crowd, optimistic divergencies confirms that the market is still interested in the stock and may keep pushing the price up. But be careful. Negative divergencies almost never marks any tops, it often confirms downtrends and may indicate bottoms. Often the optimistic divergencies marks the top so don't buy more blindly using this indicator.

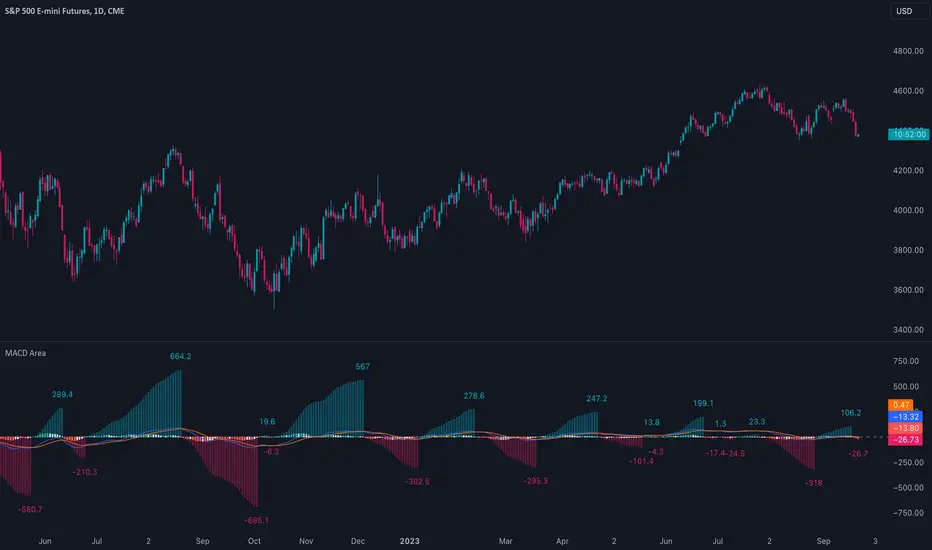
MACD AreaThis indicator calculates and displays the cumulative area for each region above and below the zero line in the MACD histogram. This area measurement serves as a momentum metric, where larger cumulative areas indicate stronger momentum. Divergences between the area and price can also potentially indicate an impending reversal. For example, when the stock price makes a higher high but the area makes a lower high, the current momentum may be unsustainable.
Strength Comparison @joshuuuexample:
if you want to find the stronger/weaker pair between eurusd and gbpusd, what you can do is check the eurgbp charts. if eurgbp is bullish, that means, that longs longs on eurusd are better than on gbpusd.
Unfortunately, there is no such thing to compare for example usoil with ukoil, or us100 with us500.
That's where this indicator comes in handy. You can choose whatever two symbols you want, that are supported by tradingview and you will get a chart, which shows symbol1/symbol2.
Now you can use normal market structure, or the ema option, to find out the stronger symbol.
This can also help predicting the so called SMT Divergences, taught by ICT.
⚠️ Open Source ⚠️
Coders and TV users are authorized to copy this code base, but a paid distribution is prohibited. A mention to the original author is expected, and appreciated.
⚠️ Terms and Conditions ⚠️
This financial tool is for educational purposes only and not financial advice. Users assume responsibility for decisions made based on the tool's information. Past performance doesn't guarantee future results. By using this tool, users agree to these terms.

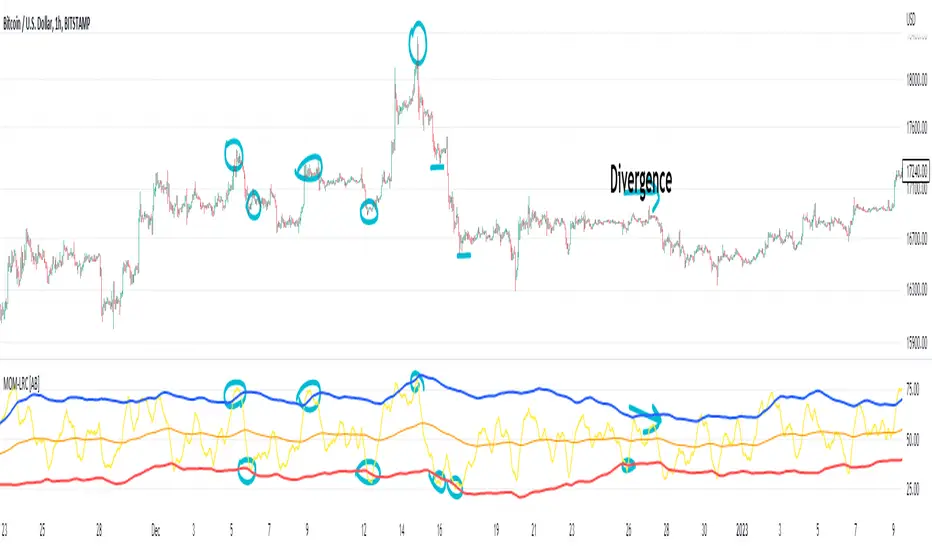
(Very promising) [Abdullah Ahmed] Momentum indicator V.1Description: MOM-LRC is a powerful technical analysis indicator designed to provide traders with signals based on the momentum of an asset's price and its deviation from its mean value. The indicator calculates the exponential RSI and uses a custom function to determine the percentage change from the mean. The upper and lower bands of the momentum channel are then calculated using linear regression of the rate of change from the mean. The channel multiplier can be adjusted to increase or decrease the sensitivity of the indicator.
How to use :
1 - Using MOM-LRC , look for buy signals when the price of the asset is below the lower border of the channel and retracing up. The opposite is true in the case of sell signals.
2 - It is also used in the case of negative and positive divergences, just as you use RSI
The indicator can be used on any time frame and any asset, making it a versatile tool for traders of all levels.
features:
Calculates exponential RSI and percentage change from the mean
Uses linear regression to calculate upper and lower bands of momentum channel
Adjustable channel multiplier for increased sensitivity
Suitable for any time frame and any asset
Happy trading!
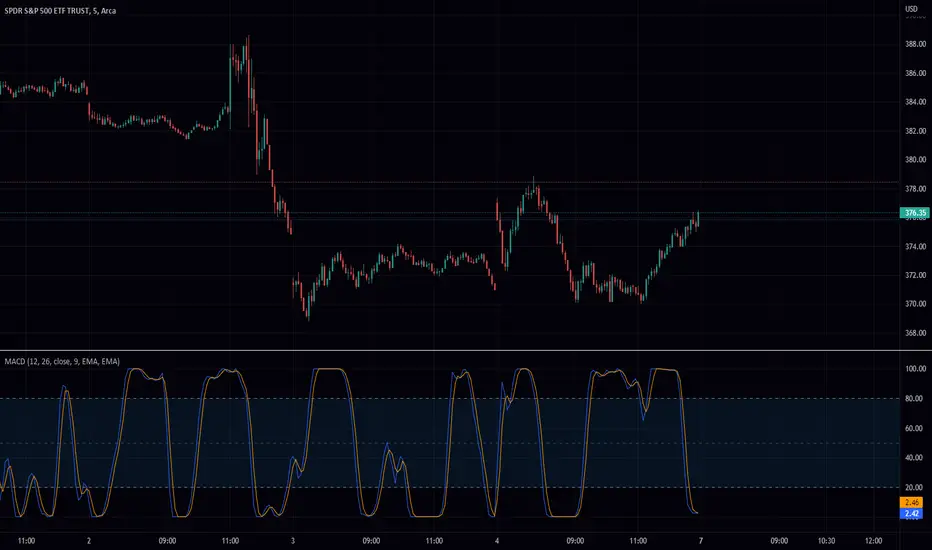
Stochastic Moving Average Convergence Divergence (SMACD)This is my attempt at making a Stochastic MACD indicator. To get this to work I have introduced a DC offset to the MACD histogram output. I figured that if theirs a Stochastic RSI their might as well be a Stochastic everything else! lmao enjoy. Honestly, from what I can tell it's even faster than Stochastic Smooth RSI.
The Stochastic Oscillator (STOCH) is a range bound momentum oscillator. The Stochastic indicator is designed to display the location of the close compared to the high/low range over a user defined number of periods. Typically, the Stochastic Oscillator is used for three things; Identifying overbought and oversold levels, spotting divergences and also identifying bull and bear set ups or signals
MACD is an extremely popular indicator used in technical analysis. MACD can be used to identify aspects of a security's overall trend. Most notably these aspects are momentum, as well as trend direction and duration. What makes MACD so informative is that it is actually the combination of two different types of indicators. First, MACD employs two Moving Averages of varying lengths (which are lagging indicators) to identify trend direction and duration. Then, MACD takes the difference in values between those two Moving Averages (MACD Line) and an EMA of those Moving Averages (Signal Line) and plots that difference between the two lines as a histogram which oscillates above and below a center Zero Line. The histogram is used as a good indication of a security's momentum
OBV+EMA HistogramHistogram of the difference between On Balance Volume and an EMA of the On Balance Volume (OBV + EMA).
Using a 55 EMA, on the daily timeframe of BTC, bull/bear trends occur when the histogram is above/below the zero line respectively.
Divergences also have a notable effect.
-- Added alert conditions when OBV crosses EMA to signal a possible trend change, for bullish and bearish cases.

Bogdan Ciocoiu - MoonshotDescription
Moonshot is an indicator that encapsulates the value delivered by the TSI, MACD, Awesome Oscillator and CCI algorithms to produce signals to enable users to enter positions in ideal market conditions. Moonshot integrates the value delivered by the above four algorithms into one script.
This indicator is particularly useful when trading continuation/reversal divergence strategies.
Uniqueness
The Moonshot's uniqueness stands from integrating the above algorithms into the same visual area and leveraging preconfigured parameters suitable for 1-3 minute scalping techniques.
In addition, Moonshot allows swapping or furthermore configuring the above four algorithms in such a way to align signals by colour-coding or shape thickness to aid the users with identifying any emerging patterns quicker.
Furthermore, Moonshot's uniqueness is also reflected in the way it has standardised the outputs of each algorithm to look and feel the same (including the scale at which the shapes are shown) and, in doing so, enables users to plug them in/out as needed.
Open-source
The indicator leverages the following open-source scripts/algorithms:
www.tradingview.com
www.tradingview.com
www.tradingview.com
www.tradingview.com

Relative Strength Index - Divergences, Stoch, Reverse StochThis is aggregation of RSI indicators - RSI, Divergences, Reverse & Stochastic RSI
Thanks to ©JayTradingCharts and ©mohanee for the RSI Divergences code
Thanks to BApig - Motgench, balipour and Wugamlo for the reverse stoch code
Changes:
1. Add option to calc divs based on close or wicks or both (RSI is close based)
2. Add pivots (marking local high/low)
3. Update to Pine v5
4. Cleanup of unused code

OBV+OBV with an extra twist.
Add up to 4 moving averages and choose from simple, exponential, smoothed, etc.
Choose to display a trend fill. Fill will be green when above the MA4 or red when below it. If the difference between the MA1 and MA4 is growing, the trend fill will be a more solid color indicating a strengthening trend. If the gap is lessening, it will gradually get more transparent indicating a weakening trend.
Finally, options to display bullish and bearish regular and hidden divergences are included.

+ %UMAIf you are familiar with the %B for use with Bollinger Bands, then you will understand this indicator immediately.
Designed for use with my +UMA moving average, this works in exactly the same way, with a few differences.
First off, as you can choose on which type of moving average the calculations are made, so too you will want to match this up with the one you are using. That of course goes for the standard deviation as well (just like you would with Bollinger Bands and %B). Here, because the +UMA uses highs and lows to create a sort of moving average channel, and then also to create the bands, I've opted to set the inner part of the bands as the extreme edge that the %UMA equates with the upper and lower lines.
I've added a moving average, donchian channels, and auto-plotted divergences as well, if you like. Typical color related stuff that I do. Alerts for everything.
Hope you like it!
The above image is comparing two of the same indicator, but based on different moving averages, and how it might plot divergences differently between the two.

On Balance VolumeEnhanced the original OBV (On Balance Volume) indicator:
- Draw max lines of OBV in the last 30 candles so that we can notice the trend, as well as divergences easier.
- If you use fiat as base currency (USDT in cryptocurrency for example), we can display the OBV in fiat, so that we can compare total trading volume across a list of symbols to find healthy symbols to trade easier.

Tipsy EMA Tipsy EMA
v0.2a
Coded by vaidab.
A simple strategy to buy dips in an uptrend.
How to use:
- buy on trend when price retraces to the orange "buy" line and compound orders
- sell when price reaches red line (stop loss) or at 💰 (take profit)
Note that you can reverse trade on the 💰 sign for a short scalp / day trade.
Uptrend: green/red background. Danger zone: orange bg. No go zone: no bg.
Potential buys (in a clear trend): 55, 100, 200 EMA touches and
fibo retracements to .382 and .618.
Potential stop loss: when price breaks the 200 EMA (marked by a red line).
Exit signs: opposite trend divergences (RSI).
Take profit: EMA 55 crossing down EMA 100.
Use it in confluence with market structure. E.g. If 200 EMA ligns up with
past market structure, if there are whole numbers or if there's a monthly level.
Tested BTCUSDT D, 4H

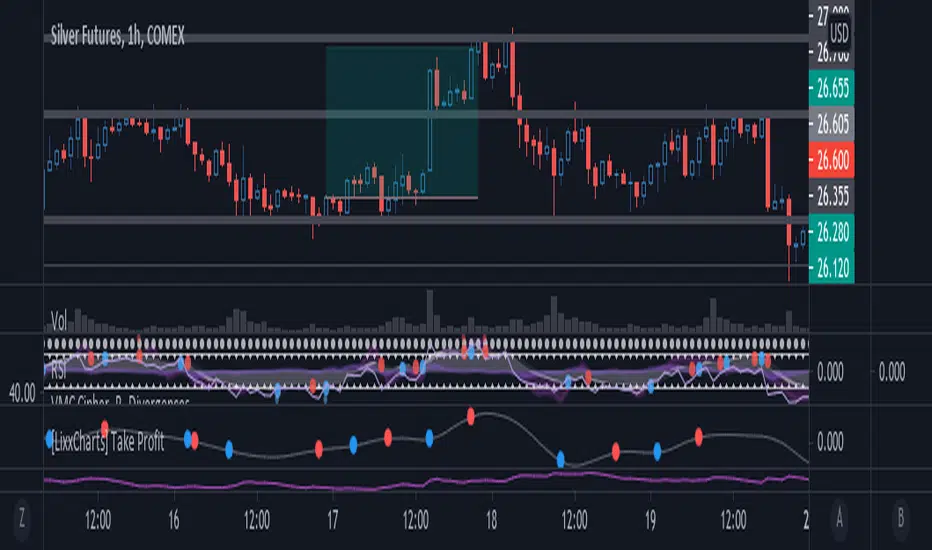
[Lixx] MESA(EMA/SMA) and ROC(ROC/MESA) Take Profit TriggersThis script uses the MESA EMA and SMA as well as the ROC/MESA cross to help find the take profit areas when trading divergences using market cipher or wavetrend. It is inspired by jordanfungs MESA indicator, however this one is different because it is not lagging in the signals.
Hope you enjoy it, and make sure to backtest any strategy before you use it.
MOVE/VXTLT CorrelationMany know of the VIX for equity trading. Yet, many are unaware that there is the same kind of volatility measure for trading bonds, called the MOVE Index.
"The Merrill Lynch Option Volatility Estimate (MOVE) Index is a yield curve weighted index of the normalized implied volatility on 1-month Treasury options which are weighted on the 2, 5, 10, and 30 year contracts."
With this script one can see the the correlation and divergences between bonds and its volatility measure to make educated decisions in trading or hedging.
The idea of this script comes from NicTheMajestic.
