Vdubus Divergence Wave Pattern Generator V1The Vdubus Divergence Wave Theory
10 years in the making & now finally thanks to AI I have attempted to put my Trading strategy & logic into a visual representation of how I analyse and project market using Core price action & MacD. Enjoy :)
A Proprietary Structural & Momentum Confluence SystemPart 1: The Strategic Concept1. The Core Philosophy: "Geometry + Physics"Traditional technical analysis often fails because traders confuse location with timing.Geometry (Price Patterns): Tells us WHERE the market is likely to reverse (e.g., at a resistance level or harmonic D-point).Physics (Momentum): Tells us WHEN the energy driving the trend has actually shifted. The Vdubus Theory posits that a trade should never be taken based on Geometry alone. A valid signal requires a specific, fractal decay in momentum—a "Handshake" between price structure and energy exhaustion.2. The 3-Wave Momentum Filter (The Engine)Most traders look for simple divergence (2 points). The Vdubus Theory demands a 3-Wave Structure to confirm the true state of the market.A. The Standard Reversal (Exhaustion)This is the "Safe" entry, catching the slow death of a trend.Wave 1 $\rightarrow$ 2 (The Warning): Price pushes higher, but momentum is lower (Standard Divergence). This signals that the trend is tapping the brakes.Wave 2 $\rightarrow$ 3 (The Confirmation): Price pushes to a final extreme (often a stop-hunt), but momentum is flat or lower than Wave 2 ("No Divergence").The Logic: This confirms that the buyers have expended all remaining energy. The engine is dead.
B. The Climax Reversal (The Trap)This is the "Aggressive" entry, catching V-shape reversals.Wave 1 $\rightarrow$ 2 (The Bait): Price pushes higher, and momentum is Stronger/Higher (No Divergence). This sucks in retail traders who believe the trend is accelerating.Wave 2 $\rightarrow$ 3 (The Snap): Price pushes again, but momentum suddenly collapses (Divergence).The Logic: A "Strong to Weak" shift. The market traps traders with a show of strength before hitting a "concrete wall" of limit orders.C. The Predator (The Trend Continuation)The Logic: Trends rarely move in straight lines. The "Predator" looks for Hidden Divergence during a pullback.The Signal: Price makes a Higher Low (Trend Structure Intact), but Momentum makes a Lower Low (Oversold Trap). This signals the end of the correction and the resumption of the main trend.3. The "Clean Path" PrincipleA trade is only valid if there is no opposing force. If you are looking to Sell (Bearish Reversal), the opposing Bullish momentum must be weak or neutral. If the "Enemy" is strong, the trade is skipped.
Part 2: The Indicator Breakdown
Tool Name: Vdubus Divergence Wave Pattern Generator V1
This script automates your analysis by combining ZigZag Pattern Recognition (Geometry) with your Custom MACD Logic (Physics).
1. The "Golden" Settings
The physics engine is tuned to your specific discovery:
Fast Length: 8
Slow Length: 21
Signal Length: 5
Lookback: 3 (Sensitive enough to catch the exact pivot points).
2. Signal Generation Logic
The indicator scans for four distinct setups. Here is the exact logic code translated into English:
Signal 1: Standard Reversal (Green/Red Pattern)
Geometry: The ZigZag algorithm identifies a 5-point structure (X-A-B-C-D), such as a Gartley, Bat, or Butterfly.
Physics Check:
Finds the last 3 momentum peaks matching the price highs.
Rule: Momentum Peak 2 must be < Peak 1 (Divergence).
Rule: Momentum Peak 3 must be <= Peak 2 (Confirmation/No Div).
Output: Draws the colored pattern and labels it (e.g., "Bearish Gartley (Exhaustion)").
Signal 2: Climax Reversal (Orange Pattern)
Geometry: Identifies the same 5-point structures.
Physics Check:
Rule: Momentum Peak 2 is >= Peak 1 (Strength/No Div).
Rule: Momentum Peak 3 is < Peak 2 (Sudden Failure/Div).
Output: Draws the pattern in Orange labeled "⚠️ CLIMAX REVERSAL". This is your "Trap" detector.
Signal 3: Rounded Top/Bottom (Navy/Maroon Label)
Geometry: Price is compressing or rounding over.
Physics Check:
Scans for 4 consecutive waves of momentum decay.
Rule: Peak 1 > Peak 2 > Peak 3 > Peak 4.
Output: Places a label indicating a "Multi-Wave Decay," identifying turns that don't have sharp pivots.
Signal 4: The Predator (Purple Pattern)
Geometry: Identifies a trend pullback (Higher Low for Buys).
Physics Check:
Rule: Momentum makes a Lower Low while Price makes a Higher Low (Hidden Divergence).
Output: Draws a Purple pattern labeled "🦖 PREDATOR" to signal trend continuation.
3. The Confluence Dashboard
Located in the corner of the screen, this provides a final "Safety Check."
Logic: It compares the absolute value (strength) of the most recent Bearish Momentum Peak vs. the most recent Bullish Momentum Low.
Output:
Green (Bulls Strong): Buying pressure is dominant. Safe to Buy, Dangerous to Sell.
Red (Bears Strong): Selling pressure is dominant. Safe to Sell, Dangerous to Buy.
Grey (Neutral): Forces are balanced.
Summary of Potential
This system solves the "Trader's Dilemma" of entering too early or too late. By waiting for the 3rd Wave, you effectively filter out the market noise and only commit capital when the opposing side has structurally and physically collapsed. It transforms trading from a guessing game into a disciplined execution of identifying Geometric Exhaustion.
Logic 1 / PREVIOUS DIVERGENCE PROJECTS future TREND BREAKS / Reversals *Not in script*
Logic 2 / Wave 1 to 2 = Divergence / Wave 2 to 3 = NO divergence = Signal
Reverse logic: Wave 1 to 2 = NO Divergence / Wave 2 to 3 = Divergence = Signal
Cerca negli script per "Divergence"

Liquidity Grab + RSI Divergence═══════════════════════════════════════════════════════════════
LIQUIDITY GRAB + RSI DIVERGENCE INDICATOR
═══════════════════════════════════════════════════════════════
📌 OVERVIEW
This indicator identifies high-probability reversals by combining:
• Liquidity sweeps (stop hunts)
• RSI divergence confirmation
• Filters false breakouts automatically
═══════════════════════════════════════════════════════════════
🟢 BUY SIGNAL (Green Triangle Up)
REQUIRES BOTH CONDITIONS:
1. Liquidity Grab Below Previous Low
• Price breaks BELOW recent low
• Candle CLOSES ABOVE that low
• Traps sellers who shorted the breakdown
2. Bullish RSI Divergence
• Price: Lower Low (LL)
• RSI: Higher Low (HL)
• Shows weakening downward momentum
➜ Result: Potential bullish reversal
═══════════════════════════════════════════════════════════════
🔴 SELL SIGNAL (Red Triangle Down)
REQUIRES BOTH CONDITIONS:
1. Liquidity Grab Above Previous High
• Price breaks ABOVE recent high
• Candle CLOSES BELOW that high
• Traps buyers who bought the breakout
2. Bearish RSI Divergence
• Price: Higher High (HH)
• RSI: Lower High (LH)
• Shows weakening upward momentum
➜ Result: Potential bearish reversal
═══════════════════════════════════════════════════════════════
📊 VISUAL INDICATORS
Main Signals:
🔺 Large Green Triangle = BUY (Liq Grab + Bullish Div)
🔻 Large Red Triangle = SELL (Liq Grab + Bearish Div)
Reference Levels:
━ Red Line = Previous High Level
━ Green Line = Previous Low Level
Additional Markers (Optional):
○ Small Green Circle = Liquidity grab low only
○ Small Red Circle = Liquidity grab high only
✕ Small Blue Cross = Bullish divergence only
✕ Small Orange Cross = Bearish divergence only
═══════════════════════════════════════════════════════════════
⚙️ SETTINGS
1. Lookback Period (Default: 20)
• Range: 5-100
• Sets how far back to identify previous highs/lows
• Higher = fewer but stronger levels
• Lower = more frequent but weaker levels
2. RSI Length (Default: 14)
• Range: 5-50
• Standard RSI calculation period
• 14 is industry standard
3. RSI Divergence Lookback (Default: 5)
• Range: 3-20
• Controls pivot point sensitivity
• Higher = fewer divergence signals
• Lower = more divergence signals
4. Show Labels (Default: ON)
• Toggle BUY/SELL text labels
• Disable for cleaner chart view
═══════════════════════════════════════════════════════════════
💡 HOW TO USE
Step 1: WAIT FOR CONFIRMATION
• Only trade LARGE TRIANGLE signals
• Ignore small circles/crosses alone
Step 2: CHECK TIMEFRAME
• Best on: 15min, 1H, 4H, Daily
• Avoid: 1min, 5min (too noisy)
Step 3: CONFIRM CONTEXT
• Check overall market trend
• Identify key support/resistance
• Look for confluence with price action
Step 4: ENTRY & RISK MANAGEMENT
• Enter on signal candle close or pullback
• Stop loss below/above the liquidity grab wick
• Target: Previous swing high/low or key levels
• Risk/Reward: Minimum 1:2 ratio
Step 5: SET ALERTS
• Create alert for "BUY Signal"
• Create alert for "SELL Signal"
• Never miss opportunities
═══════════════════════════════════════════════════════════════
✅ BEST PRACTICES
DO:
✓ Use on multiple timeframes for confluence
✓ Combine with support/resistance zones
✓ Wait for both conditions (liq grab + divergence)
✓ Practice on demo account first
✓ Use proper position sizing
DON'T:
✗ Trade every small circle/cross
✗ Use on very low timeframes (<15min)
✗ Ignore overall market context
✗ Trade without stop loss
✗ Risk more than 1-2% per trade
═══════════════════════════════════════════════════════════════
⚠️ IMPORTANT NOTES
• This is a CONFIRMATION tool, not a holy grail
• No indicator is 100% accurate
• Combine with your trading strategy
• Backtest on your preferred instruments
• Adjust parameters for your trading style
• Higher timeframes = more reliable signals
• Always use risk management
═══════════════════════════════════════════════════════════════
🔔 ALERTS INCLUDED
Two alert conditions are built-in:
1. "BUY Signal" - Liquidity Grab + Bullish RSI Divergence
2. "SELL Signal" - Liquidity Grab + Bearish RSI Divergence
═══════════════════════════════════════════════════════════════
📈 RECOMMENDED SETTINGS BY TIMEFRAME
5-15 Min Charts:
• Lookback: 10-15
• RSI Length: 14
• RSI Div Lookback: 3-5
1H-4H Charts:
• Lookback: 20-30
• RSI Length: 14
• RSI Div Lookback: 5-7
Daily Charts:
• Lookback: 30-50
• RSI Length: 14
• RSI Div Lookback: 7-10
═══════════════════════════════════════════════════════════════
Good luck and trade safe! 🚀

Imbalance RSI Divergence Strategy# Imbalance RSI Divergence Strategy - User Guide
## What is This Strategy?
This strategy identifies **imbalance** zones in the market and combines them with **RSI divergence** to generate trading signals. It aims to capitalize on price gaps left by institutional investors and large volume movements.
### Main Settings
- **RSI Period (14)**: Period used for RSI calculation. Lower values = more sensitive, higher values = more stable signals.
- **ATR Period (10)**: Period for volatility measurement using Average True Range.
- **ATR Stop Loss Multiplier (2.0)**: How many ATR units to use for stop loss calculation.
- **Risk:Reward Ratio (4.0)**: Risk-reward ratio. 2.0 = 2 units of reward for 1 unit of risk.
- **Use RSI Divergence Filter (true)**: Enables/disables the RSI divergence filter.
### Imbalance Filters
- **Minimum Imbalance Size (ATR) (0.3)**: Minimum imbalance size in ATR units to filter out small imbalances.
- **Enable Lookback Limit (false)**: Activates historical lookback limitations.
- **Maximum Lookback Bars (300)**: Maximum number of bars to look back.
### Visual Settings
- **Show Imbalance Size**: Displays imbalance size in ATR units.
- **Show RSI Divergence Lines**: Shows/hides divergence lines.
- **Divergence Line Colors**: Colors for bullish/bearish divergence lines.
### Volatility-Based Adjustments
- **Low volatility markets**:
- Minimum Imbalance Size: 0.2-0.4 ATR
- ATR Stop Loss Multiplier: 1.5-2.0
- **High volatility markets**:
- Minimum Imbalance Size: 0.5-1.0 ATR
- ATR Stop Loss Multiplier: 2.5-3.5
### Risk Tolerance
- **Conservative approach**:
- Risk:Reward Ratio: 2.0-3.0
- RSI Divergence Filter: Enabled
- Minimum Imbalance Size: Higher (0.5+ ATR)
- **Aggressive approach**:
- Risk:Reward Ratio: 4.0-6.0
- Minimum Imbalance Size: Lower (0.2-0.3 ATR)
###Market Conditions
- **Trending markets**: Higher RSI Period (21-28)
- **Sideways markets**: Lower RSI Period (10-14)
- **Volatile markets**: Higher ATR Multiplier
## Recommended Testing Procedure
1. **Start with default settings** and backtest on 3-6 months of historical data
2. **Adjust RSI Period** to see which value produces better results
3. **Optimize ATR Multiplier** for stop loss levels
4. **Test different Risk:Reward ratios** comparatively
5. **Fine-tune Minimum Imbalance Size** to improve signal quality
## Important Considerations
- **False positive signals**: Imbalances may be less reliable during low volatility periods
- **Market openings**: First hours often produce more imbalances but can be riskier
- **News events**: Consider disabling strategy during major news releases
- **Backtesting**: Test across different market conditions (trending, sideways, volatile)
## Recommended Settings for Beginners
**Safe settings for new users:**
- RSI Period: 14
- ATR Period: 14
- ATR Stop Loss Multiplier: 2.5
- Risk:Reward Ratio: 3.0
- Minimum Imbalance Size: 0.5 ATR
- RSI Divergence Filter: Enabled
## Advanced Tips
### Signal Quality Improvement
- **Combine with market structure**: Look for imbalances near key support/resistance levels
- **Volume confirmation**: Higher volume during imbalance formation increases reliability
- **Multiple timeframe analysis**: Confirm signals on higher timeframes
### Risk Management
- **Position sizing**: Never risk more than 1-2% of account per trade
- **Maximum drawdown**: Set overall stop loss for the strategy
- **Market hours**: Consider avoiding low liquidity periods
### Performance Monitoring
- **Win rate**: Track percentage of profitable trades
- **Average R:R**: Monitor actual risk-reward achieved vs. target
- **Maximum consecutive losses**: Set alerts for strategy review
This strategy works best when combined with proper risk management and market analysis. Always backtest thoroughly before using real money and adjust parameters based on your specific market and trading style.

On Balance Volume W DivergenceOBV With Divergence Indicator
A comprehensive On Balance Volume (OBV) indicator enhanced with divergence detection capabilities.
Core Features:
Classic OBV calculation with volume-based price movement tracking
Advanced divergence detection system
Multiple smoothing options for OBV
Bollinger Bands integration
Technical Components:
Volume-based price movement analysis
Pivot point detection for divergence
Customizable lookback periods
Adjustable divergence range parameters
Customization Options:
Multiple Moving Average types (SMA, EMA, SMMA, WMA, VWMA)
Bollinger Bands with adjustable standard deviation
Divergence sensitivity settings
Visual customization for signals and alerts
The indicator combines traditional OBV analysis with modern divergence detection, offering traders a powerful tool for identifying potential trend reversals and market momentum shifts.
Key Parameters:
- Pivot Lookback Right/Left: 5 (default)
- Divergence Range: 5-60 bars
- MA Length: 14 (default)
- BB StdDev: 2.0 (default)
Alert System:
- Bullish divergence alerts
- Bearish divergence alerts
- Customizable alert messages
Note: The indicator requires volume data to function properly and will display an error if volume data is not available.
RSI Missmatch(Divergence) OSC. by Neo_ with Missmatch Alert█ Definition
A divergence or missmatch occurs when an asset’s price is moving opposite to a specific technical indicator or is moving in a different direction from other relevant data. The divergence indicator warns traders and technical analysts of changes in a price trend, oftentimes that it is weakening or changing direction.
Divergence or missmatch can be either positive, signifying the possibility of a move that is higher in the asset’s price, or it can be negative, signifying the possibility of a move that is lower in the asset’s price.
█ Takeaways
Divergence or missmatch often works with other indicators and data. It is usually used by technical analysts and traders when the asset’s price is moving counter to the direction of another indicator.
As mentioned above, positive divergence or missmatch indicates that the price could start rising and usually occurs when the price is moving lower, but while another indicator counters this direction by moving higher. In other words, showing bullish signals.
Negative divergence or missmatch indicates that the price could start declining and usually occurs when the price is moving higher, while another indicator moves lower as well. In other words, showing bearish signals.
█ What to look for
Divergence or missmatch is most often used to track and analyze the momentum in an asset’s price and the odds of a price reversal within the current trend. While using divergence, traders and analysts can decide on whether or not they would like to exit the position or set a stop loss in the case the divergence is negative and prices begin to fall.
█ Limitations
It is best to use divergence or missmatch with the aid of other indicators and analysis tools in order to help identify and confirm trend reversals and major market patterns. Divergence should not be relied on by itself to tell you the pertinent information you need to know as an investor. Risk control is key in your analysis and the fact that divergence is not always present in price reversals should definitely be what pushes you to combine it with other tools and indicators.
Additionally, divergence or missmatch can reflect long-term or short-term changes. When making snap decisions, acting on divergence alone could prove detrimental to your trading. Make sure you have other risk factors applied to your charting and general market analysis.
█ What exactly is RSI Missmatches discrepancies using a lookback period in trading?
In trading, lookback period is the number of periods of historical data used for observation and calculation. It is how far into the past the system looks when trying to calculate the variable under consideration. The concept was based on the fact that history can provide information about the future, and my aim was to predict the periods when trend changes would begin within these periods with the RSI oscillator. But this is only true if you're locked back far enough, not locked any further or less!
We already use the idea of looking back in different aspects of our lives, and even in the world of financial trading it can be used in various ways. Of course you will want to learn more about the concept, so in this article we will cover the following topics:
█ What kind of hindsight is this?
The aim here is to check whether trends will change in certain cycles, so we chose the High + Low / 2 formula as the source. Because no matter how much the prices swing up or down, sometimes the rebound can go further. The aim here is to notice the points where the price leaves a needle at the levels where it oscillates and the slowdown in momentum.
█ What does look-back period mean in trade?
To understand what a lookback period means in trading, you need to ask yourself: What is a lookback period in trading? In financial trading, period refers to the duration of a particular trading session. For example, a one-week period means one full week of trading sessions or five trading days. In 5 trading days, the average time is 120 hours in FX markets and 40 hours in stock markets. Regardless of what happens in these cycles, I prefer to choose a time period of 55 periods. Because I noticed that in all the charts I examined, the cycles generally changed during this time period.
█ Let's talk about the meaning of catching Missmatches
As you know, technical indicators are all a mathematical calculation using historical market data (price, volume, or a combination of both). It shows the behavior of the price better and helps in the analysis of price movement. But the indicator can only serve your intended purpose if you get the lookback time right. What we mean here is the setting parameter that determines how much historical data it will use in its calculation. In other words, it is the retrospective review period.
For example, on the RSI indicator you can set this period to 13 periods (default setting) or even 2 periods. The period you choose can determine what the indicator tells you, which in turn determines the strategy you can create with the indicator. The 13- period RSI gives you information about price momentum, so you can effectively use it to create a momentum strategy. On the other hand, the 2-periods RSI can be used to create a mean reversion strategy. To catch any incompatibilities, I set this period to 55 periods. Nothing more, nothing less!
█ Summary
The missmatch indicator helps traders assess changes in the price trend and indicates when price will move with or against the direction of another indicator. It can be either positive or negative, but it is important to note its limitations and that it should be used with other indicators that can also monitor price trends.
We wish you to identify these incompatibilities in the market in the best way possible... Good luck.
█ Tanım
Bir varlığın fiyatı belirli bir teknik göstergenin tersi yönünde hareket ettiğinde veya diğer ilgili verilerden farklı bir yönde hareket ettiğinde bir sapma veya uyumsuzluk meydana gelir. Farklılık göstergesi, tüccarları ve teknik analistleri fiyat eğilimindeki değişiklikler konusunda uyarır; çoğu zaman zayıflıyor veya yön değiştiriyor.
Farklılık veya uyumsuzluk, varlığın fiyatında daha yüksek bir hareket olasılığını işaret ederek pozitif olabilir veya varlığın fiyatında daha düşük bir hareket olasılığını işaret ederek negatif olabilir.
█ Çıkarımlar
Farklılık veya uyumsuzluk çoğu zaman diğer göstergeler ve verilerle de çalışır. Genellikle teknik analistler ve yatırımcılar tarafından varlığın fiyatı başka bir göstergenin yönünün tersine hareket ettiğinde kullanılır.
Yukarıda bahsedildiği gibi pozitif sapma veya uyumsuzluk, fiyatın yükselmeye başlayabileceğini gösterir ve genellikle fiyat düşerken meydana gelir, ancak başka bir gösterge bu yöne yükselerek karşı koyar. Başka bir deyişle yükseliş sinyalleri veriyor.
Negatif sapma veya uyumsuzluk, fiyatın düşmeye başlayabileceğini gösterir ve genellikle fiyat yükselirken başka bir gösterge de düşerken meydana gelir. Başka bir deyişle düşüş sinyalleri veriyor.
█ Nelere bakılmalı
Farklılık veya uyumsuzluk çoğunlukla bir varlığın fiyatındaki momentumu ve mevcut trend içinde fiyatın tersine dönme olasılığını izlemek ve analiz etmek için kullanılır. Farklılaşmayı kullanırken tüccarlar ve analistler, sapmanın negatif olması ve fiyatların düşmeye başlaması durumunda pozisyondan çıkmak isteyip istemeyeceklerine veya zararı durdurma kararı verip veremeyeceklerine karar verebilirler.
█ Sınırlamalar
Trend dönüşlerini ve ana piyasa modellerini tanımlamaya ve doğrulamaya yardımcı olmak için diğer göstergeler ve analiz araçlarının yardımıyla sapmayı veya uyumsuzluğu kullanmak en iyisidir. Bir yatırımcı olarak bilmeniz gereken ilgili bilgileri size söylemesi için farklılığa tek başına güvenilmemelidir. Risk kontrolü analizinizin anahtarıdır ve fiyat dönüşlerinde farklılığın her zaman mevcut olmaması gerçeği kesinlikle sizi onu diğer araç ve göstergelerle birleştirmeye iten şey olmalıdır.
Ek olarak, farklılık veya uyumsuzluk uzun vadeli veya kısa vadeli değişiklikleri yansıtabilir. Ani kararlar verirken yalnızca farklılıklara göre hareket etmek ticaretinize zarar verebilir. Grafiğinize ve genel piyasa analizinize başka risk faktörlerinin uygulandığından emin olun.
█ Ticarette yeniden inceleme dönemi kullanan RSI Missmatches tutarsızlıkları tam olarak nedir?
Ticarette yeniden inceleme süresi, gözlem ve hesaplama için kullanılan geçmiş verilerin dönemlerinin sayısıdır. Söz konusu değişkeni hesaplamaya çalışırken sistemin ne kadar geçmişe baktığıdır. Konsept tarihin geleceğe dair bilgi verebileceği gerçeği üzerine kuruluydu ve amacım RSI osilatörü ile bu dönemler içerisinde trend değişimlerinin başlayacağı dönemleri tahmin etmekti. Ancak bu yalnızca yeterince geriye kilitlenmişseniz geçerlidir, daha fazla veya daha az kilitlenmemişseniz!
Geriye bakma fikrini hayatımızın farklı yönlerinde zaten kullanıyoruz ve hatta finansal ticaret dünyasında bile bu fikir çeşitli şekillerde kullanılabilir. Elbette konsept hakkında daha fazla bilgi edinmek isteyeceksiniz, bu nedenle bu yazıda aşağıdaki konuları ele alacağız:
█ Bu nasıl bir sonradan görmedir?
Burada amaç belli döngülerde trendlerin değişip değişmeyeceğini kontrol etmek olduğundan kaynak olarak Yüksek + Düşük / 2 formülünü seçtik. Çünkü fiyatlar ne kadar yukarı veya aşağı hareket ederse etsin bazen toparlanma daha da ileri gidebiliyor. Burada amaç fiyatın salınım yaptığı seviyelerde iğne bıraktığı noktaları ve momentumdaki yavaşlamayı fark etmektir.
█ Ticarette geriye bakma süresi ne anlama geliyor?
Ticarette yeniden inceleme süresinin ne anlama geldiğini anlamak için kendinize şu soruyu sormanız gerekir: Ticarette yeniden inceleme süresi nedir? Finansal ticarette dönem, belirli bir ticaret seansının süresini ifade eder. Örneğin, bir haftalık dönem, bir tam haftalık işlem seansı veya beş işlem günü anlamına gelir. 5 işlem gününde ortalama süre döviz piyasalarında 120 saat, borsalarda ise 40 saattir. Bu döngülerde ne olursa olsun 55 periyotluk bir zaman dilimini seçmeyi tercih ediyorum. Çünkü incelediğim tüm grafiklerde bu zaman diliminde döngülerin genel olarak değiştiğini fark ettim.
█ Kaçak Eşleşmeleri yakalamanın anlamı hakkında konuşalım
Bildiğiniz gibi teknik göstergeler, geçmiş piyasa verileri (fiyat, hacim veya her ikisinin birleşimi) kullanılarak yapılan matematiksel hesaplamalardır. Fiyatın davranışını daha iyi gösterir ve fiyat hareketinin analizine yardımcı olur. Ancak gösterge yalnızca yeniden inceleme süresini doğru yaparsanız amacınıza hizmet edebilir. Burada kast ettiğimiz, hesaplamasında ne kadar geçmiş veri kullanacağını belirleyen ayar parametresidir. Bir başka deyişle geriye dönük inceleme dönemidir.
Örneğin RSI göstergesinde bu süreyi 13 döneme (varsayılan ayar) ve hatta 2 döneme ayarlayabilirsiniz. Seçeceğiniz dönem, göstergenin size ne söyleyeceğini belirleyebilir ve bu da gösterge ile oluşturabileceğiniz stratejiyi belirler. 13 dönemlik RSI size fiyat momentumu hakkında bilgi verir, böylece onu bir momentum stratejisi oluşturmak için etkili bir şekilde kullanabilirsiniz. Öte yandan, ortalamaya dönüş stratejisi oluşturmak için 2 dönemlik RSI kullanılabilir. Herhangi bir uyumsuzluğu yakalamak için bu periyodu 55 periyoda ayarladım. Ne fazla ne eksik!
█ Özet
Uyumsuzluk göstergesi, yatırımcıların fiyat eğilimindeki değişiklikleri değerlendirmesine yardımcı olur ve fiyatın ne zaman başka bir göstergenin yönüne göre veya ona karşı hareket edeceğini gösterir. Olumlu ya da olumsuz olabilir, ancak sınırlamalarına dikkat etmek ve fiyat eğilimlerini de izleyebilecek diğer göstergelerle birlikte kullanılması gerektiğini unutmamak önemlidir.
Piyasadaki bu uyumsuzlukları en iyi şekilde tespit etmenizi dileriz... Bol Kazançlar.
TALibrary "TA"
General technical analysis functions
div_bull(pS, iS, cp_length_after, cp_length_before, pivot_length, lookback, no_broken, pW, iW, hidW, regW)
Test for bullish divergence
Parameters:
pS : Price series (float)
iS : Indicator series (float)
cp_length_after : Bars after current (divergent) pivot low to be considered a valid pivot (optional int)
cp_length_before : Bars before current (divergent) pivot low to be considered a valid pivot (optional int)
pivot_length : Bars before and after prior pivot low to be considered valid pivot (optional int)
lookback : Bars back to search for prior pivot low (optional int)
no_broken : Flag to only consider divergence valid if the pivot-to-pivot trendline is unbroken (optional bool)
pW : Weight of change in price, used in degree of divergence calculation (optional float)
iW : Weight of change in indicator, used in degree of divergence calculation (optional float)
hidW : Weight of hidden divergence, used in degree of divergence calculation (optional float)
regW : Weight of regular divergence, used in degree of divergence calculation (optional float)
Returns:
flag = true if divergence exists (bool)
degree = degree (strength) of divergence (float)
type = 1 = regular, 2 = hidden (int)
lx1 = x coordinate 1 (int)
ly1 = y coordinate 1 (float)
lx2 = x coordinate 2 (int)
ly2 = y coordinate 2 (float)
div_bear(pS, iS, cp_length_after, cp_length_before, pivot_length, lookback, no_broken, pW, iW, hidW, regW)
Test for bearish divergence
Parameters:
pS : Price series (float)
iS : Indicator series (float)
cp_length_after : Bars after current (divergent) pivot high to be considered a valid pivot (optional int)
cp_length_before : Bars before current (divergent) pivot highto be considered a valid pivot (optional int)
pivot_length : Bars before and after prior pivot high to be considered valid pivot (optional int)
lookback : Bars back to search for prior pivot high (optional int)
no_broken : Flag to only consider divergence valid if the pivot-to-pivot trendline is unbroken (optional bool)
pW : Weight of change in price, used in degree of divergence calculation (optional float)
iW : Weight of change in indicator, used in degree of divergence calculation (optional float)
hidW : Weight of hidden divergence, used in degree of divergence calculation (optional float)
regW : Weight of regular divergence, used in degree of divergence calculation (optional float)
Returns:
flag = true if divergence exists (bool)
degree = degree (strength) of divergence (float)
type = 1 = regular, 2 = hidden (int)
lx1 = x coordinate 1 (int)
ly1 = y coordinate 1 (float)
lx2 = x coordinate 2 (int)
ly2 = y coordinate 2 (float)

Relative Strength Index (OSC)Hello everyone, I'm sorry that the previous open-source version was hidden due to the house rules, I've re-edited the description and re-posted it
(1) Indicator introduction
This is RSI indicator with original divergence algorithm
This indicator is plotted on the RSI and can display the divergence locations and corresponding divergence intensity
The tolerance of N Klines at the top or bottom positions for price and indicator is supported, which is set by the "Tolerant Kline Number"
Support the display of divergence intensity, that is, the REG/HID value displayed on the label, which is less than 0. The smaller the intensity value, the more obvious divergence
Support the filtering of divergence intensity, which is set by "Cov Threshold". The divergence that REG/HID divergence intensity greater than this value will be ignored
In the label, REG indicates regular top/bottom divergence while HID indicates hidden top/bottom divergence
In the label, SRC(x-y) indicates a divergence occurred from the x-th kline to the y-th kline
In the label, OSC(x-y) indicates a divergence occurred from the indicator corresponding to the x-th kline to the y-th kline
(2) Parameter introduction
- RSI Settings
Source: The source to calculate RSI, close by default
RSI Length: The length of RSI, 14 by default
- RSI Divergence
Pivot Lookback Right: Number of K-line bars recalling the pivot top/bottom point to the right
Pivot Lookback Left: Number of K-line bars recalling the pivot top/bottom point to the left
Max of Lookback Range: Maximum number of retracing K-line bars to find the pivot top/bottom point
Min of Lookback Range: Minimum number of retracing K-line bars to find the pivot top/bottom point
Tolerant Kline Number: Maximum tolerance in indexing top/bottom points of Klines and indicators
Cov Threshold: Divergence intensity, which is less than 0. The smaller the intensity value, the more obvious divergence
Plot Bullish: Whether to draw regular bullish divergence label
Plot Hidden Bullish: Whether to draw hidden bullish divergence label
Plot Bearish: Whether to draw regular bearish divergence label
Plot Hidden Bearish: Whether to draw hidden bearish divergence label
Happy trading and enjoy your life!
————————————————————————————————————————
各位朋友大家好,很抱歉之前的开源版本因为规则原因被隐藏,我已经重新编辑了说明并重新发布
(1) 指标说明
该指标绘制于 RSI 上,并在对应位置显示背离点以及背离程度
支持顶底位置 N 根K线的容差,由 Tolerant Kline Number 参数设置
支持背离强度的显示,即标签上显示的 REG/HID 值,该值小于 0,且越小说明背离程度越大
支持背离强度的过滤,由 Cov Threshold 参数设置, REG/HID 值大于这个值的背离会被忽略
标签中,REG 表示常规顶/低背离,而 HID 表示隐藏顶/底背离
标签中,SRC(x-y) 表示从当前第 x 根 bar 开始到第 y 跟 bar 出现背离
标签中,OSC(x-y) 表示从当前第 x 根 bar 所对应的指标开始到第 y 跟 bar 所对应的指标出现背离
(2) 参数说明
- RSI Settings
Source: 计算 RSI 指标的 source,默认为 close
RSI Length: 计算 RSI 指标的长度,默认为 14
- RSI Divergence
Pivot Lookback Right: 枢纽顶/底点往右回顾的 K线 bar 数量
Pivot Lookback Left: 枢纽顶/底点往左回顾的 K线 bar 数量
Max of Lookback Range: 回寻找枢纽顶/底点的最大回溯 K线 bar 数量
Min of Lookback Range: 回寻找枢纽顶/底点的最小回溯 K线 bar 数量
Tolerant Kline Number: K线和指标的顶/底点索引的最大误差
Cov Threshold: 背离程度,该值小于 0,且越小说明背离程度越大
Plot Bullish: 是否绘制常规底背离提示
Plot Hidden Bullish: 是否绘制隐藏底背离提示
Plot Bearish: 是否绘制常规顶背离提示
Plot Hidden Bearish: 是否绘制隐藏顶背离提示
祝大家交易愉快

Relative Strength Index (SRC)Hello everyone, I'm sorry that the previous open-source version was hidden due to the house rules, I've re-edited the description and re-posted it
(1) Indicator introduction
This is RSI indicator with original divergence algorithm
This indicator is plotted on the klines and can display the divergence locations and corresponding divergence intensity
The tolerance of N Klines at the top or bottom positions for price and indicator is supported, which is set by the "Tolerant Kline Number"
Support the display of divergence intensity, that is, the REG/HID value displayed on the label, which is less than 0. The smaller the intensity value, the more obvious divergence
Support the filtering of divergence intensity, which is set by "Cov Threshold". The divergence that REG/HID divergence intensity greater than this value will be ignored
In the label, REG indicates regular top/bottom divergence while HID indicates hidden top/bottom divergence
In the label, SRC(x-y) indicates a divergence occurred from the x-th kline to the y-th kline
In the label, OSC(x-y) indicates a divergence occurred from the indicator corresponding to the x-th kline to the y-th kline
(2) Parameter introduction
- RSI Settings
Source: The source to calculate RSI, close by default
RSI Length: The length of RSI, 14 by default
- RSI Divergence
Pivot Lookback Right: Number of K-line bars recalling the pivot top/bottom point to the right
Pivot Lookback Left: Number of K-line bars recalling the pivot top/bottom point to the left
Max of Lookback Range: Maximum number of retracing K-line bars to find the pivot top/bottom point
Min of Lookback Range: Minimum number of retracing K-line bars to find the pivot top/bottom point
Tolerant Kline Number: Maximum tolerance in indexing top/bottom points of Klines and indicators
Cov Threshold: Divergence intensity, which is less than 0. The smaller the intensity value, the more obvious divergence
Plot Bullish: Whether to draw regular bullish divergence label
Plot Hidden Bullish: Whether to draw hidden bullish divergence label
Plot Bearish: Whether to draw regular bearish divergence label
Plot Hidden Bearish: Whether to draw hidden bearish divergence label
Happy trading and enjoy your life!
————————————————————————————————————————
各位朋友大家好,很抱歉之前的开源版本因为规则原因被隐藏,我已经重新编辑了说明并重新发布
(1) 指标说明
该指标绘制于 K线 上,并在对应位置显示背离点以及背离程度
支持顶底位置 N 根K线的容差,由 Tolerant Kline Number 参数设置
支持背离强度的显示,即标签上显示的 REG/HID 值,该值小于 0,且越小说明背离程度越大
支持背离强度的过滤,由 Cov Threshold 参数设置, REG/HID 值大于这个值的背离会被忽略
标签中,REG 表示常规顶/低背离,而 HID 表示隐藏顶/底背离
标签中,SRC(x-y) 表示从当前第 x 根 bar 开始到第 y 跟 bar 出现背离
标签中,OSC(x-y) 表示从当前第 x 根 bar 所对应的指标开始到第 y 跟 bar 所对应的指标出现背离
(2) 参数说明
- RSI Settings
Source: 计算 RSI 指标的 source,默认为 close
RSI Length: 计算 RSI 指标的长度,默认为 14
- RSI Divergence
Pivot Lookback Right: 枢纽顶/底点往右回顾的 K线 bar 数量
Pivot Lookback Left: 枢纽顶/底点往左回顾的 K线 bar 数量
Max of Lookback Range: 回寻找枢纽顶/底点的最大回溯 K线 bar 数量
Min of Lookback Range: 回寻找枢纽顶/底点的最小回溯 K线 bar 数量
Tolerant Kline Number: K线和指标的顶/底点索引的最大误差
Cov Threshold: 背离程度,该值小于 0,且越小说明背离程度越大
Plot Bullish: 是否绘制常规底背离提示
Plot Hidden Bullish: 是否绘制隐藏底背离提示
Plot Bearish: 是否绘制常规顶背离提示
Plot Hidden Bearish: 是否绘制隐藏顶背离提示
祝大家交易愉快

On Balance Volume wi Normalization (OSC)Hello everyone, I'm sorry that the previous open-source version was hidden due to the house rules, I've re-edited the description and re-posted it
(1) Indicator introduction
This indicator is a normalized OBV that never dulls and has a better divergence accuracy than RSI
This indicator is plotted on the Normalized OBV and can display the divergence locations and corresponding divergence intensity
The tolerance of N Klines at the top or bottom positions for price and indicator is supported, which is set by the "Tolerant Kline Number"
Support the display of divergence intensity, that is, the REG/HID value displayed on the label, which is less than 0. The smaller the intensity value, the more obvious divergence
Support the filtering of divergence intensity, which is set by "Cov Threshold". The divergence that REG/HID divergence intensity greater than this value will be ignored
In the label, REG indicates regular top/bottom divergence while HID indicates hidden top/bottom divergence
In the label, SRC(x-y) indicates a divergence occurred from the x-th kline to the y-th kline
In the label, OSC(x-y) indicates a divergence occurred from the indicator corresponding to the x-th kline to the y-th kline
(2) Parameter introduction
- Normalized On Balance Volume
MA Type: Type of moving average for calculating the normalized OBV, default is SMA
MA Period: Period of moving average of normalized OBV, which is SMA14 by default
NOBV Sigma: Upper and lower range of normalized OBV
- Normalized On Balance Volume Divergence
Pivot Lookback Right: Number of K-line bars recalling the pivot top/bottom point to the right
Pivot Lookback Left: Number of K-line bars recalling the pivot top/bottom point to the left
Max of Lookback Range: Maximum number of retracing K-line bars to find the pivot top/bottom point
Min of Lookback Range: Minimum number of retracing K-line bars to find the pivot top/bottom point
Tolerant Kline Number: Maximum tolerance in indexing top/bottom points of Klines and indicators
Cov Threshold: Divergence intensity, which is less than 0. The smaller the intensity value, the more obvious divergence
Plot Bullish: Whether to draw regular bullish divergence label
Plot Hidden Bullish: Whether to draw hidden bullish divergence label
Plot Bearish: Whether to draw regular bearish divergence label
Plot Hidden Bearish: Whether to draw hidden bearish divergence label
Happy trading and enjoy your life!
————————————————————————————————————————
各位朋友大家好,很抱歉之前的开源版本因为规则原因被隐藏,我已经重新编辑了说明并重新发布
(1) 指标说明
该指标是 OBV 的归一化版本,永不钝化,背离准确率高于 RSI
该指标绘制于 归一化OBV 上,并在对应位置显示背离点以及背离程度
支持顶底位置 N 根K线的容差,由 Tolerant Kline Number 参数设置
支持背离强度的显示,即标签上显示的 REG/HID 值,该值小于 0,且越小说明背离程度越大
支持背离强度的过滤,由 Cov Threshold 参数设置, REG/HID 值大于这个值的背离会被忽略
标签中,REG 表示常规顶/低背离,而 HID 表示隐藏顶/底背离
标签中,SRC(x-y) 表示从当前第 x 根 bar 开始到第 y 跟 bar 出现背离
标签中,OSC(x-y) 表示从当前第 x 根 bar 所对应的指标开始到第 y 跟 bar 所对应的指标出现背离
(2) 参数说明
- Normalized On Balance Volume
MA Type: 计算归一化 OBV 的移动平均的类型,默认为 SMA
MA Period: 计算归一化 OBV 的移动平均的周期,默认为 SMA14
NOBV Sigma: 归一化 OBV 的过滤区间
- Normalized On Balance Volume Divergence
Pivot Lookback Right: 枢纽顶/底点往右回顾的 K线 bar 数量
Pivot Lookback Left: 枢纽顶/底点往左回顾的 K线 bar 数量
Max of Lookback Range: 回寻找枢纽顶/底点的最大回溯 K线 bar 数量
Min of Lookback Range: 回寻找枢纽顶/底点的最小回溯 K线 bar 数量
Tolerant Kline Number: K线和指标的顶/底点索引的最大误差
Cov Threshold: 背离程度,该值小于 0,且越小说明背离程度越大
Plot Bullish: 是否绘制常规底背离提示
Plot Hidden Bullish: 是否绘制隐藏底背离提示
Plot Bearish: 是否绘制常规顶背离提示
Plot Hidden Bearish: 是否绘制隐藏顶背离提示
祝大家交易愉快

On Balance Volume wi Normalization (SRC)Hello everyone, I'm sorry that the previous open-source version was hidden due to the house rules, I've re-edited the description and re-posted it
(1) Indicator introduction
This indicator is a normalized OBV that never dulls and has a better divergence accuracy than RSI
This indicator is plotted on the klines and can display the divergence locations and corresponding divergence intensity
The tolerance of N Klines at the top or bottom positions for price and indicator is supported, which is set by the "Tolerant Kline Number"
Support the display of divergence intensity, that is, the REG/HID value displayed on the label, which is less than 0. The smaller the intensity value, the more obvious divergence
Support the filtering of divergence intensity, which is set by "Cov Threshold". The divergence that REG/HID divergence intensity greater than this value will be ignored
In the label, REG indicates regular top/bottom divergence while HID indicates hidden top/bottom divergence
In the label, SRC(x-y) indicates a divergence occurred from the x-th kline to the y-th kline
In the label, OSC(x-y) indicates a divergence occurred from the indicator corresponding to the x-th kline to the y-th kline
(2) Parameter introduction
- Normalized On Balance Volume
MA Type: Type of moving average for calculating the normalized OBV, default is SMA
MA Period: Period of moving average of normalized OBV, which is SMA14 by default
NOBV Sigma: Upper and lower range of normalized OBV, but the function is reserved
- Normalized On Balance Volume Divergence
Pivot Lookback Right: Number of K-line bars recalling the pivot top/bottom point to the right
Pivot Lookback Left: Number of K-line bars recalling the pivot top/bottom point to the left
Max of Lookback Range: Maximum number of retracing K-line bars to find the pivot top/bottom point
Min of Lookback Range: Minimum number of retracing K-line bars to find the pivot top/bottom point
Tolerant Kline Number: Maximum tolerance in indexing top/bottom points of Klines and indicators
Cov Threshold: Divergence intensity, which is less than 0. The smaller the intensity value, the more obvious divergence
Plot Bullish: Whether to draw regular bullish divergence label
Plot Hidden Bullish: Whether to draw hidden bullish divergence label
Plot Bearish: Whether to draw regular bearish divergence label
Plot Hidden Bearish: Whether to draw hidden bearish divergence label
Happy trading and enjoy your life!
————————————————————————————————————————
各位朋友大家好,很抱歉之前的开源版本因为规则原因被隐藏,我已经重新编辑了说明并重新发布
(1) 指标说明
该指标是 OBV 的归一化版本,永不钝化,背离准确率高于 RSI
该指标绘制于 K线 上,并在对应位置显示背离点以及背离程度
支持顶底位置 N 根K线的容差,由 Tolerant Kline Number 参数设置
支持背离强度的显示,即标签上显示的 REG/HID 值,该值小于 0,且越小说明背离程度越大
支持背离强度的过滤,由 Cov Threshold 参数设置, REG/HID 值大于这个值的背离会被忽略
标签中,REG 表示常规顶/低背离,而 HID 表示隐藏顶/底背离
标签中,SRC(x-y) 表示从当前第 x 根 bar 开始到第 y 跟 bar 出现背离
标签中,OSC(x-y) 表示从当前第 x 根 bar 所对应的指标开始到第 y 跟 bar 所对应的指标出现背离
(2) 参数说明
- Normalized On Balance Volume
MA Type: 计算归一化 OBV 的移动平均的类型,默认为 SMA
MA Period: 计算归一化 OBV 的移动平均的周期,默认为 SMA14
NOBV Sigma: 归一化 OBV 的过滤区间,其功能暂时保留
- Normalized On Balance Volume Divergence
Pivot Lookback Right: 枢纽顶/底点往右回顾的 K线 bar 数量
Pivot Lookback Left: 枢纽顶/底点往左回顾的 K线 bar 数量
Max of Lookback Range: 回寻找枢纽顶/底点的最大回溯 K线 bar 数量
Min of Lookback Range: 回寻找枢纽顶/底点的最小回溯 K线 bar 数量
Tolerant Kline Number: K线和指标的顶/底点索引的最大误差
Cov Threshold: 背离程度,该值小于 0,且越小说明背离程度越大
Plot Bullish: 是否绘制常规底背离提示
Plot Hidden Bullish: 是否绘制隐藏底背离提示
Plot Bearish: 是否绘制常规顶背离提示
Plot Hidden Bearish: 是否绘制隐藏顶背离提示
祝大家交易愉快

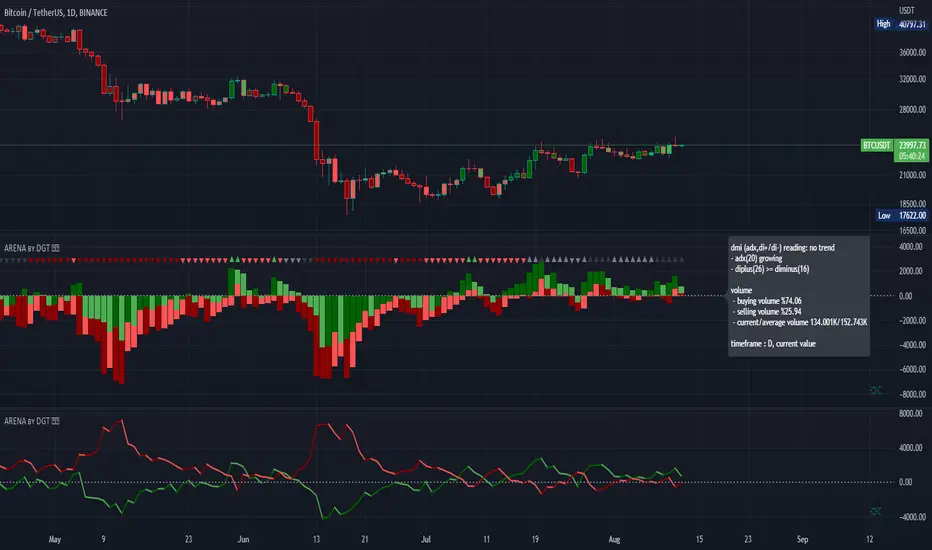
Bull vs Bear Power by DGTElder-Ray Bear and Bull Power
Dr. Alexander Elder cleverly named his first indicator Elder-Ray because of its function, which is designed to see through the market like an X-ray machine. Developed in 1989, the Elder-Ray indicator can be applied to the chart of any security and helps traders determine the strength of competing groups of bulls and bears by gazing under the surface of the markets for data that may not immediately be ascertainable from a superficial glance at prices
The Elder-Ray indicator is comprised by three elements – Bear Power, Bull Power and a 13-period Exponential Moving Average.
As the high price of any candle shows the maximum power of buyers and the low price of any candle shows the maximum power of sellers, Elder uses the 13-period EMA in order to present the average consensus of price value. Bull power shows whether buyers are capable of pushing prices above the average consensus of value. Bear power shows whether sellers are capable of pushing prices below the average consensus of value. Mathematically, Bull power is the result of subtracting the 13-period EMA from the high price of the day, and Bear power is the result of subtracting the 13-period EMA from the low price of the day.
What does this study implements
Attempts to customize interpretation of Alexander Elder's Elder-Ray Indicator (Bull and Bear Power) by
• adding additional insights to support/confirm Elder’s strategy with different indicators related with the Elder’s concept
• providing different options of visualization of the indicator
• providing smoothing capability
Other Indicators to support/confirm Elder-Ray Indicator:
Colored Directional Movement Index (CDMI) , a custom interpretation of J. Welles Wilder’s Directional Movement Index (DMI) , where :
DMI is a collection of three separate indicators ( ADX , +DI , -DI ) combined into one and measures the trend’s strength as well as its direction
CDMI is a custom interpretation of DMI which presents ( ADX , +DI , -DI ) with a color scale - representing the trend’s strength, color density - representing momentum/slope of the trend’s strength, and triangle up/down shapes - representing the trend’s direction. CDMI provides all the information in a single line with colored triangle shapes plotted on the top. DMI can provide quality information and even trading signals but it is not an easy indicator to master, whereus CDMI simplifies its usage.
Alexander Elder considers the slope of the EMA, which gives insight into the recent trend whether is up or down, and CDMI adds additional insight of verifying/confirming the trend as well as its strength
Note : educational content of how to read CDMI can be found in ideas section named as “Colored Directional Movement Index”
different usages of CDMI can be observed with studies “Candlestick Patterns in Context by DGT", “Ichimoku Colored SuperTrend + Colored DMI by DGT”, “Colored Directional Movement and Bollinger Band's Cloud by DGT”, and “Technical Analyst by DGT”
Price Convergence/Divergence , if we pay attention to mathematical formulations of bull power, bear power and price convergence/divergence (also can be expressed as price distance to its ma) we would clearly observe that price convergence/divergence is in fact the result of how the market performed based on the fact that we assume 13-period EMA is consensus of price value. Then, we may assume that the price convergence/divergence crosses of bull power, or bear power, or sum of bull and bear power could be considered as potential trading signals
Additionally, price convergence/divergence visualizes the belief that prices high above the moving average or low below it are likely to be remedied in the future by a reverse price movement
Alternatively, Least Squares Moving Average of Price Convergence/Divergence (also known as Linear Regression Curve) can be plotted instead of Price Convergence/Divergence which can be considered as a smoothed version of Price Convergence/Divergence
Note : different usages of Price Convergence/Divergence can be observed with studies “Trading Psychology - Fear & Greed Index by DGT”, “Price Distance to its MA by DGT”, “P-MACD by DGT”, where “Price Distance to its MA by DGT” can also be considered as educational content which includes an article of a research carried on the topic
Options of Visualization
Bull and Bear Power plotted as two separate
• histograms
• lines
• bands
Sum of Bull and Bear Power plotted as single
• histogram
• line
• band
Others
Price Convergence/Divergence displayed as Line
CDMI is displayed as single colored line of triangle shapes, where triangle shapes displays direction of the trend (triangle up represents bull and triangle down represent bear), colors of CDMI displays the strength of the trend (green – strong bullish, red – strong bearish, gray – no trend, yellow – week trend)
In general with this study, color densities also have a meaning and aims to displays if the value of the indicator is falling or growing, darker colors displays more intense move comparing to light one
Note : band's upper and lower levels are calculated by using standard deviation build-in function with multiply factor of 0.236 Fibonacci’s ratio (just a number for our case, no any meaning)
Smoothing
No smoothing is applied by default but the capability is added in case Price Convergence/Divergence Line is assumed to be used as a signal line it will be worth smoothing the bear, bull or sum of bear and bull power indicators
Interpreting Elder-Ray Indicator, according to Dr. Alexander Elder
Bull Power should remain positive in normal circumstances, while Bear Power should remain negative in normal circumstances. In case the Bull Power indicator enters into negative territory, this implies that sellers have overcome buyers and control the market. In case the Bear Power indicator enters into positive territory, this indicates that buyers have overcome sellers and control the market. A trader should not go long at times when the Bear Power indicator is positive and he/she should not go short at times when the Bull Power indicator is negative.
13-period EMAs slope can be used in order to identify the direction of the major trend. According to Elder, the most reliable buy signals are generated, when there is a bullish divergence between the Bear Power indicator and the price (Bear Power forms higher lows, while the market forms lower lows). The most reliable sell signals are generated, when there is a bearish divergence between the Bull Power indicator and the price (Bull Power forms lower highs, while the market forms higher highs).
There are four basic conditions, required to go long or short, with the use of the Elder-Ray method alone.
In order to go long:
1. The market is in a bull trend, as indicated by the 13-period EMA
2. Bear Power is in negative territory, but increasing
3. The most recent Bull Power top is higher than its prior top
4. Bear Power is going up from a bullish divergence
The last two conditions are optional that fine-tune the buying decision
In order to go short:
1. The market is in a bear trend, as indicated by the 13-period EMA
2. Bull Power is in positive territory, but falling
3. The most recent Bear Power bottom is lower than its prior bottom
4. Bull Power is falling from a bearish divergence
The last two conditions are optional, they provide a stronger signal for shorting but they are not absolutely essential
If a trader is willing to add to his/her position, he/she needs to:
1. add to his/her long position, when the Bear Power falls below zero and then climbs back into positive territory
2. add to his/her short position, when the Bull Power increases above zero and then drops back into negative territory.
note : terminology of the definitions used herein are as per TV dictionary
Trading success is all about following your trading strategy and the indicators should fit within your trading strategy, and not to be traded upon solely
Disclaimer : The script is for informational and educational purposes only. Use of the script does not constitute professional and/or financial advice. You alone have the sole responsibility of evaluating the script output and risks associated with the use of the script. In exchange for using the script, you agree not to hold dgtrd TradingView user liable for any possible claim for damages arising from any decision you make based on use of the script
Gold Projection DivergenceGOLD PROJECTION DIVERGENCE
Oscillator Companion for the Gold Macro Projection Model
OVERVIEW
The Gold Projection Divergence oscillator quantifies how far gold is trading from its projected fair value. While the main indicator shows where gold should be, this oscillator shows how extreme the mispricing is—providing precise timing signals for entries and exits.
HOW IT WORKS
The oscillator calculates the difference between actual gold price and the projected value, then normalizes it as a Z-score . This statistical measure shows how many standard deviations gold is trading away from its projected fair value.
Z > +2 — Gold is 2+ standard deviations above fair value (extremely overvalued)
Z > +1 — Gold is moderately overvalued
Z = 0 — Gold is trading at projected fair value
Z < -1 — Gold is moderately undervalued
Z < -2 — Gold is 2+ standard deviations below fair value (extremely undervalued)
VISUAL ELEMENTS
Histogram — Color-coded divergence magnitude
Yellow Line — Smoothed Z-score
Dashed Lines — +2 and -2 standard deviation levels
Dotted Lines — +1 and -1 standard deviation levels
Triangle Markers — Extreme crossover signals
Circle Markers — Zero-line crossings
HISTOGRAM COLORS
Dark Red — Z > +2 (extreme overvaluation)
Orange — Z between +1 and +2
Light Orange — Z between 0 and +1
Light Green — Z between -1 and 0
Green — Z between -2 and -1
Lime — Z < -2 (extreme undervaluation)
COMPONENT TABLE
The breakdown table shows divergence from each individual factor:
Silver — Is gold over/undervalued relative to silver?
M2 — Is gold over/undervalued relative to money supply?
DXY — Is gold over/undervalued relative to dollar strength?
Equity — Is gold over/undervalued relative to stocks?
TIPS — Is gold over/undervalued relative to real rates?
TRADING APPLICATIONS
Mean Reversion Strategy
Enter LONG when Z < -2 and begins rising
Enter SHORT when Z > +2 and begins falling
Use zero-line crossings for trend confirmation
Trend Following Filter
Only take long trades when Z < 0 (undervalued)
Only take short trades when Z > 0 (overvalued)
Divergence Confirmation
Bearish: Price makes new highs while Z-score makes lower highs
Bullish: Price makes new lows while Z-score makes higher lows
ALERTS
Extreme Undervaluation — Z crosses below -2
Extreme Overvaluation — Z crosses above +2
Moderate Undervaluation — Z crosses below -1
Moderate Overvaluation — Z crosses above +1
Divergence Turned Positive — Crossed above zero
Divergence Turned Negative — Crossed below zero
COMBINED USAGE
For best results, use both indicators together :
Main Indicator — Visual context of actual vs. projected on price chart
Divergence Oscillator — Precise measurement for timing decisions
The main indicator shows where gold should be; the oscillator shows how extreme the mispricing is and when to act.
Disclaimer: This indicator is for educational purposes only. Past correlations do not guarantee future relationships. Market conditions can alter historical relationships. Always use proper risk management.

Jurik Angle Flow [Kodexius]Jurik Angle Flow is a Jurik based momentum and trend strength oscillator that converts Jurik Moving Average behavior into an intuitive angle based flow gauge. Instead of showing a simple moving average line, this tool measures the angular slope of a smoothed Jurik curve, normalizes it and presents it as a bounded oscillator between plus ninety and minus ninety degrees.
The script uses two Jurik engines with different responsiveness, then blends their information into a single power score that drives both the oscillator display and the on chart gauge. This makes it suitable for identifying trend direction, trend strength, exhaustion conditions and early shifts in market structure. Built in divergence detection between price and the Jurik angle slope helps highlight potential reversal zones while bar coloring and a configurable no trade zone assist with visual filtering of choppy conditions.
🔹 Features
🔸 Dual Jurik slope engine
The indicator internally runs two Jurik Moving Average calculations on the selected source price. A slower Jurik stream models the primary trend while a faster Jurik stream reacts more quickly to recent changes. Their slopes are measured as angles in degrees, scaled by Average True Range so that the slope is comparable across different instruments and timeframes.
🔸 Angle based oscillator output
Both Jurik streams are converted into angle values by comparing the current value to a lookback value and normalizing by ATR. The result is passed through the arctangent function and expressed in degrees. This creates a smooth oscillator that directly represents steepness and direction of the Jurik curve instead of raw price distance.
🔸 Normalized power score
The angle values are transformed into a normalized score between zero and one hundred based on their absolute magnitude, then the sign of the angle is reapplied. This yields a symmetric score where extreme positive values represent strong bullish pressure and extreme negative values represent strong bearish pressure. The final power score is a weighted blend of the slow and fast Jurik scores.
🔸 Adaptive color gradients
The main oscillator area and the fast slope line use gradient colors that react to the angle strength and direction. Rising green tones reflect bullish angular momentum while red tones reflect bearish pressure. Neutral or shallow slopes remain visually softer to indicate indecision or consolidation.
🔸 Trend flip markers
Whenever the primary Jurik slope crosses through zero from negative to positive, an up marker is printed at the bottom of the oscillator panel. Whenever it crosses from positive to negative, a down marker is drawn at the top. These flips act as clean visual signals of potential trend initiation or termination.
🔸 Divergence detection on Jurik slope
The script optionally scans the fast Jurik slope for pivot highs and lows. It then compares those oscillator pivots against corresponding price pivots.
Regular bullish divergence is detected when the oscillator prints a higher low while price prints a lower low.
Regular bearish divergence is detected when the oscillator prints a lower high while price prints a higher high.
When detected, the tool draws matching divergence lines both on the oscillator and on the chart itself, making divergence zones easy to notice at a glance.
🔸 Bar coloring and no trade filter
Bars can be colored according to the primary Jurik slope gradient so that price bars reflect the same directional information as the oscillator. Additionally a configurable no trade threshold can visually mute bars when the absolute angle is small. This highlights trending sequences and visually suppresses noisy sideways stretches.
🔸 On chart power gauge
A creative on chart gauge displays the composite power score beside the current price action. It shows a vertical range from plus ninety to minus ninety with a filled block that grows proportionally to the normalized score. Color and label updates occur in real time and provide a quick visual summary of current Jurik flow strength without needing to read exact oscillator levels.
🔹 Calculations
Below are the main calculation blocks that drive the core logic of Jurik Angle Flow.
Jurik core update
method update(JMA self, float _src) =>
self.src := _src
float phaseRatio = self.phase < -100 ? 0.5 : self.phase > 100 ? 2.5 : self.phase / 100.0 + 1.5
float beta = 0.45 * (self.length - 1) / (0.45 * (self.length - 1) + 2)
float alpha = math.pow(beta, self.power)
if na(self.e0)
self.e0 := _src
self.e1 := 0.0
self.e2 := 0.0
self.jma := 0.0
self.e0 := (1 - alpha) * _src + alpha * self.e0
self.e1 := (_src - self.e0) * (1 - beta) + beta * self.e1
float prevJma = self.jma
self.e2 := (self.e0 + phaseRatio * self.e1 - prevJma) * math.pow(1 - alpha, 2) + math.pow(alpha, 2) * self.e2
self.jma := self.e2 + prevJma
self.jma
This method implements the Jurik Moving Average engine with internal state and phase control, producing a smooth adaptive value stored in self.jma.
Angle calculation in degrees
method getAngle(float src, int lookback=1) =>
float rad2degree = 180 / math.pi
float slope = (src - src ) / ta.atr(14)
float ang = rad2degree * math.atan(slope)
ang
The slope between the current value and a lookback value is divided by ATR, then converted from radians to degrees through the arctangent. This creates a volatility normalized angle oscillator.
Normalized score from angle
method normScore(float ang) =>
float s = math.abs(ang)
float p = s / 60.0 * 100.0
if p > 100
p := 100
p
The absolute angle is scaled so that sixty degrees corresponds to a score of one hundred. Values above that are capped, which keeps the final score within a fixed range. The sign is later reapplied to restore direction.
Slow and fast Jurik streams and power score
var JMA jmaSlow = JMA.new(jmaLen, jmaPhase, jmaPower, na, na, na, na, na)
var JMA jmaFast = JMA.new(jmaLen, jmaPhase, 2.0, na, na, na, na, na)
float jmaValue = jmaSlow.update(src)
float jmaFastValue = jmaFast.update(src)
float jmaSlope = jmaValue.getAngle()
float jmaFastSlope = jmaFastValue.getAngle()
float scoreJma = normScore(jmaSlope) * math.sign(jmaSlope)
float scoreJmaFast = normScore(jmaFastSlope) * math.sign(jmaFastSlope)
float totalScore = (scoreJma * 0.6 + scoreJmaFast * 0.4)
A slower Jurik and a faster Jurik are updated on each bar, each converted to an angle and then to a signed normalized score. The final composite power score is a weighted blend of the slow and fast scores, where the slow score has slightly more influence. This composite drives the on chart gauge and summarizes the overall Jurik flow.

VCAI RSI Divergence +VCAI RSI Divergence+ is an RSI that shows trend, momentum, and divergence using V-CoresAI colour logic instead of a single white line.
What it shows:
Yellow RSI line → bullish momentum (RSI above its MA; buy-side pressure in control)
Purple RSI line → bearish momentum (RSI below its MA; sell-side pressure in control)
Thin blue line → fast RSI moving average that drives the colour flips
Dashed 70/30 lines → classic OB/OS zones
Background bands → soft purple in OB, soft yellow in OS to mark exhaustion areas
How to read it:
Yellow & rising → momentum shifting bullish; pullbacks into yellow OS band can be accumulation zones
Purple & falling → momentum shifting bearish; pushes into purple OB band can be distribution/sell zones
Hard colour flips (yellow ↔ purple) mark trend regime changes, not minor RSI noise
Divergence mode (on/off)
The divergence engine scans RSI and price pivot structure:
Bullish divergence (yellow) → price lower low + RSI higher low
Bearish divergence (purple) → price higher high + RSI lower high
Lines and tags appear only where a meaningful disagreement between price and RSI exists, giving early context for potential reversals or fade setups.
Together, the momentum colours + optional divergence mapping give a far clearer market read than a standard RSI, with zero clutter and no guesswork.

Momentum Divergence Oscillator by JJMomentum Divergence Oscillator by JJ
A powerful, all-in-one momentum tool designed to streamline trade confluence, combining multi-timeframe trend analysis with automatic divergence spotting and classic MACD signals.
How to Use This Indicator
This oscillator is designed to be used in the lower pane of your chart, beneath your primary price chart. It provides three main types of signals:
1. Multi-Timeframe (MTF) Trend Confirmation
The background shading is your primary trend filter. It looks at the MACD trend on two higher timeframes (30m and 60m by default) to confirm the market's overarching direction.
Green Shading: Indicates that both higher timeframes are in a bullish trend (MACD above signal line). Focus on looking for BUY signals during this time.
Red Shading: Indicates that both higher timeframes are in a bearish trend. Focus on looking for SELL signals during this time.
Grey/No Shading: The higher timeframes are not in agreement or are consolidating. Exercise caution or stick to standard price action rules.
2. Automatic Divergence Signals
Divergence is a powerful early warning system where the indicator moves in the opposite direction of the price. The indicator automatically flags these occurrences:
"Bull RSI Div" (Green Label-Up): Bullish divergence identified using the RSI oscillator. This suggests a potential reversal to the upside after a downtrend.
"Bear RSI Div" (Red Label-Down): Bearish divergence identified using the RSI oscillator. This suggests a potential reversal to the downside after an uptrend.
Tip: These signals are often most reliable when they occur within the corresponding MTF background colour (e.g., a "Bull RSI Div" during a Green MTF background).
3. Momentum Shifts and Crossovers
The standard plots provide immediate insight into market momentum:
Blue/Orange Lines: The traditional MACD line (Blue) and Signal line (Orange).
Histogram (Green/Red Bars): Represents the momentum difference between the MACD and Signal lines.
Zero-Line Crosses (Triangles): Tiny triangles appear when the MACD line crosses the zero line, indicating a shift in long-term momentum.
Peaks & Troughs (X-Crosses): The 'X' markers identify local peaks and troughs in the histogram, sometimes indicating short-term exhaustion of the current move.
Disclaimer: Trading involves significant risk and is not suitable for every investor. This indicator is for educational purposes only and should not be considered financial advice. Always use appropriate risk management.

Bollinger Band ToolkitBollinger Band Toolkit
An advanced, adaptive Bollinger Band system for traders who want more context, precision, and edge.
This indicator expands on the classic Bollinger Bands by combining statistical and volatility-based methods with modern divergence and squeeze detection tools. It helps identify volatility regimes, potential breakouts, and early momentum shifts — all within one clean overlay.
🔹 Core Features
1. Adaptive Bollinger Bands (σ + ATR)
Classic 20-period bands enhanced with an ATR-based volatility adjustment, making them more responsive to true market movement rather than just price variance.
Reduces “overreacting” during chop and avoids bands collapsing too tightly during trends.
2. %B & RSI Divergence Detection
🟢 Green dots: Positive %B divergence — price makes a lower low, but %B doesn’t confirm (bullish).
🔴 Red dots: Negative %B divergence — price makes a higher high, but %B doesn’t confirm (bearish).
✚ Red/green crosses: RSI divergence confirmation — momentum fails to confirm the price’s new extreme.
These signals highlight potential reversal or slowdown zones that are often invisible to the naked eye.
3. Bollinger Band Squeeze (with Volume Filter)
Yellow squares (■) show periods when Bollinger Bands are at their narrowest relative to recent history.
Volume confirmation ensures the squeeze only triggers when both volatility and participation contract.
Often marks the “calm before the storm” — breakout potential zones.
4. Multi-Timeframe Breakout Markers
Optionally displays breakouts from higher or lower timeframes using different colors/symbols.
Lets you see when a higher timeframe band break aligns with your current chart — a strong trend continuation signal.
5. Dual- and Triple-Band Visualization (±1σ, ±2σ, ±3σ)
Optional inner (±1σ) and outer (±3σ) bands provide a layered volatility map:
Price holding between ±1σ → stable range / mean-reverting behavior
Price riding near ±2σ → trending phase, sustained momentum
Price touching or exceeding ±3σ → volatility expansion or exhaustion zone
This triple-band layout visually distinguishes normal movement from statistical extremes, helping you read when the market is balanced, expanding, or approaching its limits.
⚙️ Inputs & Customization
Choose band type (SMA/EMA/SMMA/WMA/VWMA)
Adjust deviation multiplier (σ) and ATR multiplier
Toggle individual features (divergence dots, squeeze markers, inner bands, etc.)
Multi-timeframe and colour controls for advanced users
🧠 How to Use
Watch for squeeze markers followed by a breakout bar beyond ±2σ → volatility expansion signal.
Combine divergence dots with RSI or price structure to anticipate slowdowns or reversals.
Confirm direction using multi-timeframe breakouts and volume expansion.
💬 Why It Works
This toolkit transforms qualitative chart reading (tight bands, hidden divergence) into quantitative, testable conditions — giving you objective insights that can be backtested, coded, or simply trusted in live setups.

cd_indiCATor_CxGeneral:
This indicator is the redesigned, simplified, and feature-enhanced version of the previously shared indicators:
cd_cisd_market_Cx, cd_HTF_Bias_Cx, cd_sweep&cisd_Cx, cd_SMT_Sweep_CISD_Cx, and cd_RSI_divergence_Cx.
Within the holistic setup, the indicator tracks:
• HTF bias
• Market structure (trend) in the current timeframe
• Divergence between selected pairs (SMT)
• Divergence between price and RSI values
• Whether the price is in an important area (FVG, iFVG, and Volume Imbalance)
• Whether the price is at a key level
• Whether the price is within a user-defined special timeframe
The main condition and trigger of the setup is an HTF sweep with CISD confirmation on the aligned timeframe.
When the main condition occurs, the indicator provides the user with a real-time market status summary, enriched with other data.
________________________________________
What’s new?
-In the SMT module:
• Triad SMT analysis (e.g.: NQ1!, ES1!, and YM1!)
• Dyad SMT analysis (e.g.: EURUSD, GBPUSD)
• Alternative pair definition and divergence analysis for non-correlated assets
o For crypto assets (xxxUSDT <--> xxxUSDT.P) (e.g.: SOLUSDT.P, SOLUSDT)
o For stocks, divergence analysis by comparing the asset with its value in another currency
(BIST:xxx <--> BIST:xxx / EURTRY), (BAT:xxx <--> BAT:xxx / EURUSD)
-Special timeframe definition
-Configurable multi-option alarm center
-Alternative summary presentation (check list / status table / stickers)
________________________________________
Details and usage:
The user needs to configure four main sections:
• Pair and correlated pairs
• Timeframes (Auto / Manual)
• Alarm center
• Visual arrangement and selections
Pair Selections:
The user should adjust trading pairs according to their trade preferences.
Examples:
• Triad: NQ1!-ES1!-YM1!, BTC-ETH-Total3
• Dyad: NAS100-US500, XAUUSD-XAGUSD, XRPUSDT-XLMUSDT
Single pairs:
-Crypto Assets:
If crypto assets are not in the triad or dyad list, they are automatically matched as:
Perpetual <--> Spot (e.g.: DOGEUSDT.P <--> DOGEUSDT)
If the asset is already defined in a dyad list (e.g., DOGE – SHIB), the dyad definition takes priority.
________________________________________
-Stocks:
If stocks are defined in the dyad list (e.g.: BIST:THYAO <--> BIST:PGSUS), the dyad definition takes priority.
If not defined, the stock is compared with its value in the selected currency.
For example, in the Turkish Stock Exchange:
BIST:FENER stock, if EUR is chosen from the menu, is compared as BIST:FENER / OANDA:EURTRY.
Here, “OANDA” and the stock market currency (TRY) are automatically applied for the exchange rate.
For NYSE:XOM, its pair will be NYSE:XOM / EURUSD.
________________________________________
Timeframes:
By default, the menu is set to “Auto.” In this mode, aligned timeframes are automatically selected.
Aligned timeframes (LTF-HTF):
1m-15m, 3m-30m, 5m-1h, 15m-4h, 1h-D, 4h-W, D-M
Example: if monitoring the chart on 5m:
• 1h sweep + 5m CISD confirmation
• D sweep + 1h CISD confirmation (bias)
• 5m market structure
• 1h SMT and 1h RSI divergence analysis
For manual selections, the user must define the timeframes for Sweep and HTF bias.
FVG, iFVG, and Volume Imbalance timeframes must be manually set in both modes.
________________________________________
Alarm Center:
The user can choose according to preferred criteria.
Each row has options.
“Yes” → included in alarm condition.
“No” → not included in alarm condition.
If special timeframe criteria are added to the alarm, the hour range must also be entered in the same row, and the “Special Zone” tab (default: -4) should be checked.
Key level timeframes and plot options must be set manually.
Example alarm setup:
Alongside the main Sweep + CISD condition, if we also want HTF bias + Trend alignment + key level (W, D) and special timeframe (09:00–11:00), we should set up the menu as follows:
________________________________________
Visual Arrangement and Selections:
Users can control visibility with checkboxes according to their preferences.
In the Table & Sticker tab, table options and labels can be controlled.
• Summary Table has two options: Check list and Status Table
• From the HTF bias section, real-time bias and HTF sweep zone (optional) are displayed
• The RSI divergence section only shows divergence analysis results
• The SMT 2 sub-section only functions when triad is selected
Labels are shown on the bar where the sweep + CISD condition occurs, displaying the current situation.
With the Check box option, all criteria’s real-time status is shown (True/False).
Status Table provides a real-time summary table.
Although the menu may look crowded, most settings only need to be adjusted once during initial use.
________________________________________
What’s next?
• Suggestions from users
• Standard deviation projection
• Mitigation/order blocks (cd special mtg)
• PSP /TPD
________________________________________
Final note:
Every additional criterion in the alarm settings will affect alarm frequency.
Multiple conditions occurring at the same time is not, by itself, sufficient to enter a trade—you should always apply your own judgment.
Looking forward to your feedback and suggestions.
Happy trading! 🎉

M2 Liquidity Divergence ModelM2 Liquidity Divergence Model
The M2 Liquidity Divergence Model is a macro-aware visualization tool designed to compare shifts in global liquidity (M2) against the performance of a benchmark asset (default: Bitcoin). This script captures liquidity flows across major global economies and highlights whether price action is aligned ("Agreement") or diverging ("Divergence") from macro trends.
🔍 Core Features
M2 Global Liquidity Index (GLI):
Aggregates M2 money supply from major global economies, FX-adjusted, including extended contributors like India, Brazil, and South Africa. The slope of this composite is used to infer macro liquidity trends.
Lag Offset Control:
Allows the M2 signal to lead benchmark asset price by a configurable number of days (Lag Offset), useful for modeling the forward-looking nature of macro flows.
Gradient Macro Context (Background):
Displays a color-gradient background—aqua for expansionary liquidity, fuchsia for contraction—based on the slope and volatility of M2. This contextual backdrop helps users visually anchor price action within macro shifts.
Divergence Histogram (Optional):
Plots a histogram showing dynamic correlation or divergence between the liquidity index and the selected benchmark.
Agreement Mode: M2 and asset are moving together.
Divergence Mode: Highlights break in expected macro-asset alignment.
Adaptive Transparency Scaling:
Histogram and background gradients scale their visual intensity based on statistical deviation to emphasize stronger signals.
Toggle Options:
Show/hide the M2 Liquidity Index line.
Show/hide divergence histogram.
Enable/disable visual offset of M2 to benchmark.
🧠 Suggested Usage
Macro Positioning: Use the background context to align directional trades with macro liquidity flows.
Disagreement as Signal: Use divergence plots to identify when price moves against macro expectations—potential reversal or exhaustion zones.
Time-Based Alignment: Adjust Lag Offset to synchronize M2 signals with asset price behavior across different market conditions.
⚠️ Disclaimer
This indicator is designed for educational and analytical purposes only. It does not constitute financial advice or an investment recommendation. Always conduct your own research and consult a licensed financial advisor before making trading decisions.

Combined ATPC & MACD DivergenceTrend Optimizer + Divergence Finder in One Unified Tool
🔍 Overview:
This powerful dual-system indicator merges two proven analytical engines:
✅ The Algorganic Typical Price Channel (ATPC) — a custom trend oscillator that highlights mean-reversion and directional bias.
✅ A refined MACD system with divergence detection, enhanced with an adjusted Donchian midline for real-time trend strength filtering.
Together, they provide a high-confidence, multi-signal system ideal for swing trading, scalping, or confirming reversals with context.
⚙️ Core Components & Logic
🧠 1. ATPC Engine (Trend Commodity Index)
A momentum and volatility-normalized oscillator based on the typical price (H+L+C)/3:
TrendCI Line (Blue) – Main trend signal based on smoothed CCI logic.
TrendLine2 (Orange) – A slower smoothing of TrendCI for crossovers.
Key Zones (customizable):
🔴 Ultra Overbought: +73
🟣 Overbought: +58
🟣 Oversold: -58
🔴 Ultra Oversold: -73
Trade Logic:
✅ Buy Signal: TrendCI crosses above TrendLine2 while in oversold zone
❌ Sell Signal: TrendCI crosses below TrendLine2 while in overbought zone
Additional visual feedback:
Histogram Bars show strength and direction of momentum shift
Green/Red Circles highlight potential long/short setups
📉 2. MACD System + Divergence Finder
Classic MACD enhanced with a Donchian Midline overlay to filter trend bias.
🔷 MACD Line and 🟠 Signal Line show crossover momentum
🟩/🟥 Histogram shows distance from the signal line
🟪 Adjusted Donchian Midline dynamically adapts to range-bound vs trending environments
Background Color provides real-time trend state:
✅ Green = Bullish Trend
❌ Red = Bearish Trend
No color = Neutral / Choppy
MACD Boundaries (user-defined):
Overbought: +1.0
Oversold: -1.0
🔀 3. Divergence Detection
Spot hidden power shifts before price reacts:
🔼 Positive Divergence – Price makes lower lows, but MACD histogram rises
🔽 Negative Divergence – Price makes higher highs, but MACD histogram weakens
These are visually marked with:
Green “+Div” label (bullish reversal cue)
Red “–Div” label (bearish exhaustion signal)
🎯 How to Use It
For Trend Traders:
Stay in sync with macro trend using MACD histogram + background
Use ATPC crossovers for precision entries
Avoid signals during neutral background (chop filter)
For Reversal Traders:
Look for bullish +Div with ATPC buy signal in oversold zone
Look for bearish –Div with ATPC sell signal in overbought zone
Mid-Donchian line can act as confluence or breakout trigger
For Scalpers & Intraday Traders:
Combine with VWAP, liquidity zones, or order flow levels
ATPC crossovers + MACD histogram zero-line flip = potential scalp entry
Use histogram slope and divergence to avoid false momentum traps
🧩 Customizable Inputs
🎛️ ATPC: Channel & Smoothing lengths, overbought/oversold thresholds
🎛️ MACD: Fast/slow EMAs, signal smoothing, Donchian period, bounds
🎨 Fully theme-compatible with adjustable colors and line styles
🔔 Alerts (Add Your Own)
While this version doesn’t contain built-in alerts, you can easily add alerts based on:
buySignal or sellSignal from ATPC logic
Histogram cross zero or trend flip
MACD Divergence event
📜 “This indicator doesn't just show signals—it tells a story about who’s in control of the market, and when that control might be slipping.”

Quadratic Kernel with Quadratic Divergence [PinescriptLabs]This indicator combines a quadratic kernel regression with adaptive deviation bands to provide a unique view of market trends.
Key Features:
**Customizable Parameters:**
- Regression Period: Adjusts the sensitivity of the central line (default 50).
- Time Deformation: Modifies the weight of recent vs. older data (default 1.0). Increasing the "Time Deformation" makes more recent data more relevant, while decreasing it gives more weight to older data in the regression calculation.
- Confidence Band Width: Controls the width of the bands (default 3.0). Determines how many standard deviations are added to or subtracted from the central line to form the confidence bands. The standard deviations are calculated as the difference between the central line and the closing prices. A higher confidence value will result in wider bands, indicating a broader range of expected price variation, while a lower confidence value will result in narrower bands, indicating a narrower range of expected price variation.
**How to Use the Indicator Based on Price Crossings with the Kernel Divergence Line?**
Short: We need a candle to cross and close below the Kernel Divergence Line (bullish), and at the same time, the quadratic channels must be in a Bearish state for confirmation. Once the entry is executed, our exit will be when the Divergence Line changes its color by at least two confirmation points, or the price crosses above, which nullifies the entry.
Long: We need a candle to cross and close above the Kernel Divergence Line (bearish), and at the same time, the quadratic channels must be in a Bullish state for confirmation. Once the entry is executed, our exit will be when the Divergence Line changes its color by at least two confirmation points, or the price crosses below, which nullifies the entry.
**How to Use the Indicator Based Solely on Kernel Divergence??**
We observe the Kernel Divergence line, which indicates bullish momentum while the price is declining, and we are looking for the Reversal point.
**Confirmation of the Reversal Point:** When the Kernel Divergence changes from bullish (green color) to bearish (red color), we look for the price at its lowest point to be below the first lower Quadratic channel or even outside the Quadratic channel. This signals a potential strong reversal.
How to Use the Indicator Based Solely on Quadratic Channels?
Use only confirmations of changes from Bullish to Bearish or vice versa. It is recommended to have at least three confirmation points in the same direction.
Quadratic Kernel Regression: Provides a smoothed trend line that adapts to market movements.
Adaptive Deviation Bands: Dynamically calculated to show market volatility.
Buy/Sell Signals: Based on the price crossing the central line and the direction of the trend.
Quadratic Kernel Regression calculates a smoothed central line based on recent prices.
The deviation bands automatically adjust according to market volatility.
The trend is determined by comparing the current position of the central line with its previous position.
Buy signals are generated when the price crosses above the central line in an uptrend.
Sell signals are generated when the price crosses below the central line in a downtrend.
Español:
Este indicador combina una regresión de kernel cuadrático con bandas de desviación adaptativas para proporcionar una visión única de la tendencia del mercado.
Características principales:
**Parámetros personalizables:**
- Período de regresión: Ajusta la sensibilidad de la línea central (por defecto 50).
- Deformación del tiempo: Modifica el peso de los datos recientes vs. antiguos (por defecto 1.0). Aumentar la "Deformación del tiempo" hace que los datos más recientes sean más relevantes, mientras que disminuirla da más peso a los datos antiguos en el cálculo de la regresión.
- Ancho de bandas de confianza: Controla la amplitud de las bandas (por defecto 3.0). Determina cuántas desviaciones estándar se añaden o restan a la línea central para formar las bandas de confianza. Las desviaciones estándar se calculan como la diferencia entre la línea central y los precios de cierre. Un valor mayor de confianza resultará en bandas más anchas, indicando un rango más amplio de variación esperada en los precios, mientras que un valor menor de confianza resultará en bandas más estrechas, indicando un rango más estrecho de variación esperada.
* *Cómo usar el Indicador Basados en los Cruces de Precio con la Línea de Divergencia del Kernel?**
Short: Necesitamos que una vela cruce y cierre por debajo de la línea de Divergencia del Kernel (bullish) y al mismo tiempo los Canales cuadráticos deben estar en un momento Bearish para confirmación. Una vez ejecutada la entrada, nuestra salida será cuando la Línea de Divergencia haga su cambio de color al menos dos puntos de confirmación o el precio haga un cruce por arriba, lo que anula la entrada.
Long: Necesitamos que una vela cruce y cierre por Encima de la linea de Divergencia del Kernel( Bearish) y al mismo tiempo los Canales cuadráticos deben estar en un momento Bullish para confirmación, una vez ejecutada la entrada nuestra salida será cuando la Linea de Divergencia haga su cambio de color al menos dos puntos de confirmación o el precio haga un cruce por Debajo lo que anula la entrada:
Como usar el indicador Basado en solo en Divergencia del Kernel? : Observamos la linea de Divergencia del Kernel la cual nos indica un momentum bullish mientras que precio va a la baja y lo que buscamos es el punto de Reversion.
Confirmación de punto de reversion: cuando la Divergencia de Kernel pasa de bullish ( color verde) a bearish ( color rojo) buscamos que el precio en su punto mas bajo este por debajo del primer canal inferior Quadratico o fuera incluso del canal Quadratico lo que nos indica una posible reversion con fuerza.
Como usar el indicador basado solo en Canales Quadraticos?
Utilizar únicamente las confirmaciones de Cambio de Bullish a Bearish o visceversa, se recomienda al menos tres puntos de confirmación en la misma dirección.
Regresión de kernel cuadrático: Ofrece una línea de tendencia suavizada que se adapta a los movimientos del mercado.
Bandas de desviación adaptativas: Calculadas dinámicamente para mostrar la volatilidad del mercado.
Señales de compra/venta: Basadas en el cruce del precio con la línea central y la dirección de la tendencia.
La regresión de kernel cuadrático calcula una línea central suavizada basada en los precios recientes.
Las bandas de desviación se ajustan automáticamente según la volatilidad del mercado.
La tendencia se determina comparando la posición actual de la línea central con su posición anterior.
Las señales de compra se generan cuando el precio cruza por encima de la línea central en una tendencia alcista.
Las señales de venta se generan cuando el precio cruza por debajo de la línea central en una tendencia bajista.
RSI Divergence SmoothedRSI Divergence Smoothed
This indicator is based on the RSI Divergence indicator by @InvestitoreComune.
The "RSI Divergence Smoothed" is a custom technical indicator designed to highlight divergence between two RSI (Relative Strength Index) lines: a fast RSI and a slow RSI. The divergence is then visualized on the chart, assisting traders in recognizing potential market reversals and trend continuation.
Here's a breakdown of its smoothing options added:
1. **WMA Difference**: The indicator first computes a weighted moving average (WMA) difference, which takes the difference between the WMA of half the input length and the WMA of the full length.
2. **Hull Moving Average (HMA)**: The indicator can use the HMA as a filter. HMA combines the benefits of a simple moving average and a linear weighted moving average, aiming to be faster in response to price changes.
3. **Sine Weighted Moving Average (SWMA)**: Another filter option, SWMA, weighs the data points by the sine of their position in the data set, giving more weight to the central data points.
4. **Kaufman's Adaptive Moving Average (KAMA)**: KAMA adapts to price volatility and can also be used as a filter. It's especially useful in choppy markets, adjusting the smoothing constant based on the relative volatility of the price series.
5. **Gaussian Moving Average (GMA)**: This filter uses a Gaussian kernel to weigh the data points, emphasizing the more recent data while giving lesser importance to older data. It helps smooth out the price data, potentially eliminating some of the noise.
I've personally found the KAMA smoothing to be most helpful but keen to hear of anyone's personal experiences and recommendations.
RSI divergence computations are based on the filtered price (or raw price if no filter is chosen) - the indicator calculates two RSIs:
- Fast RSI: With a default length of 5 periods.
- Slow RSI: With a default length of 14 periods.
The core functionality of this indicator is to compute the divergence between the Fast and Slow RSI. The divergence is plotted on the chart, with the color indicating its direction: white for positive divergence and red for negative.
MACD Normalized [ChartPrime]Overview of MACD Normalized Indicator
The MACD Normalized indicator, serves as an asset for traders seeking to harness the power of the moving average convergence divergence (MACD) combined with the advantages of the stochastic oscillator. This novel indicator introduces a normalized MACD, offering a potentially enhanced flexibility and adaptability to numerous market conditions and trading techniques.
This indicator stands out by normalizing the MACD to its average high and average low, also factoring in the deviation of the high-low position from the mean. This approach incorporates the high and low in the calculations, providing the benefits of stochastic without its common drawbacks, such as clipping problems. As a result, the indicator becomes exceptionally versatile and suitable for various trading strategies, including both faster and slower settings.
The MACD Normalized Indicator boasts a variety of options and settings. The features include:
Enable Ribbon: Toggle the display of the ribbon accompanying the MACD Normalized, as desired.
Fast Length: Determine the movement speed of the fast line to receive advance notice of potential market opportunities.
Slow Length: Control the movement pace of the slow line for smoother signals and a comprehensive outlook on market trends.
Average Length: Specify the length used to calculate the high and low averages, providing greater control over the indicator's granularity.
Upper Deviation: Establish the extent to which the high and low values deviate from the mean, ensuring adaptability to diverse market situations.
Inner Band (Middle Deviation): Adjust the balance between the high and low deviations to create an inner band signal, giving traders a secondary level of market analysis and decision-making support.
Enable Candle Color: Enable the coloring of candles based on the MACD Normalized value for effortless visualization of trading potential.
Use Cases for the MACD Normalized Indicator
In addition to analyzing market trends and identifying potential trading opportunities, ChartPrime's MACD Normalized Indicator offers a range of applications for traders. These use cases encompass distinct trading scenarios and strategies:
Overbought and Oversold Regions
One of the key applications of the MACD Normalized Indicator is identifying overbought and oversold regions. Overbought refers to a situation where an asset's price has risen significantly and is expected to face a downturn, while oversold indicates a price drop that may subsequently lead to a reversal.
By adjusting the indicator's parameters, such as the upper and inner deviation levels, traders can set precise boundaries to determine overbought and oversold areas. When the MACD moves into the upper region, it may signal that the asset is overbought and due for a price correction. Conversely, if the MACD enters the lower region, it possibly indicates an oversold condition with the potential for a price rebound.
Signal Line Crossovers
The MACD Normalized Indicator displays two lines: the fast line and the slow line (inner band). A common trading strategy involves observing the intersection of these two lines, known as a crossover. When the fast line crosses above the slow line, it may signify a bullish trend or a potential buying opportunity. Conversely, a crossover with the fast line moving below the slow line typically indicates a bearish trend or a selling opportunity.
Divergence and Convergence
Divergence occurs when the price movement of an asset does not align with the corresponding MACD values. If the price establishes a new high while the MACD fails to do the same, a bearish divergence emerges, suggesting a potential downtrend. Similarly, a bullish divergence takes place when the price forms a new low but the MACD does not follow suit, hinting at an upcoming uptrend.
Convergence, on the other hand, is represented by the MACD lines moving closer together. This movement signifies a potential change in the trend, providing traders with a timely opportunity to enter or exit the market.
Volume Crop ━ Hidden Volume Divergence [whvntr] Volume Divergence
• Formula originated from: "Hidden Price Divergence" (circles) by TheLark. I did two things to harness its
effectiveness:
• Firstly, I developed a unique way to filter out the divergence signals that were appearing on both sides of the
midline. This filter will be known as the "Midline Tool" . It filters out a lot of the false signals commonly
associated with oscillators.
• Then, I modified the default format from Price to Volume.
• The midline formula "Midline Tool" was developed by me . It adjusts in the thousands since it's volume.
Let me know in the comments if you would rater have a smaller step value than 10,000. How does it work?
Crossover then Crossunder, the arrows only appear during the first sign of hidden volume divergence once
crossing the midline. Normally, these signs appear on both side of the midline both bearish and bullish no
matter if it's on an oversold or overbought side of the spectrum... Also, let
me know in the comments if you would like for me to release an oscillator version of this
indicator for co-witnessing.
Features:
• Volume divergence
• Midline Tool©
• Disclaimer: This indicator does not constitute investment advice. Trade at your own risk with the investments
you can afford to lose because all financial investments have risks and this is not a
guarantee that the volume divergence will be 100% all the time.