[blackcat] L2 Bull Bear Convergence Divergence (BBCD)Level: 2
Background
A bull market is gaining ground and is economically sound, while a bear market is declining and most stocks are depreciating. The actual origins of these terms are unclear, but one reason could be that bulls attack by pulling their horns up while bears attack by brushing their paws down.
Function
L2 Bull Bear Convergence Divergence (BBCD) disclose the convergence divergence of the bull bear as a market opinion indicator. It tells you the opinion of those who are directly involved with the markets. As a trader, understanding how the convergence divergence of the bull bear works can be of great help. I inherited the traditional MACD expression method, and added golden cross (yellow cross) and dead cross (fuchsia cross) prompts, as well as bottom divergence (lime cross) and top divergence (red cross) prompts.
Key Signal
bbd --> bull bear fast line
bbdsupport --> bull bear slow line and support level
bbdgx --> bull bear gold cross in yellow
bbddx --> bull bear dead cross in fuchsia
bbotdiverg --> bull bear bottom divergence alert in lime cross
btopdiverg --> bull bear top divergence alert in red cross
Pros and Cons
Pros:
1. it can help to see the strength change of a trend in time
2. visual bottom and top divergence alerts are provided
Cons:
1. it disclose the strength change better than price change
Remarks
Bull Bear Convergence Divergence (BBCD) is new.
Readme
In real life, I am a prolific inventor. I have successfully applied for more than 60 international and regional patents in the past 12 years. But in the past two years or so, I have tried to transfer my creativity to the development of trading strategies. Tradingview is the ideal platform for me. I am selecting and contributing some of the hundreds of scripts to publish in Tradingview community. Welcome everyone to interact with me to discuss these interesting pine scripts.
The scripts posted are categorized into 5 levels according to my efforts or manhours put into these works.
Level 1 : interesting script snippets or distinctive improvement from classic indicators or strategy. Level 1 scripts can usually appear in more complex indicators as a function module or element.
Level 2 : composite indicator/strategy. By selecting or combining several independent or dependent functions or sub indicators in proper way, the composite script exhibits a resonance phenomenon which can filter out noise or fake trading signal to enhance trading confidence level.
Level 3 : comprehensive indicator/strategy. They are simple trading systems based on my strategies. They are commonly containing several or all of entry signal, close signal, stop loss, take profit, re-entry, risk management, and position sizing techniques. Even some interesting fundamental and mass psychological aspects are incorporated.
Level 4 : script snippets or functions that do not disclose source code. Interesting element that can reveal market laws and work as raw material for indicators and strategies. If you find Level 1~2 scripts are helpful, Level 4 is a private version that took me far more efforts to develop.
Level 5 : indicator/strategy that do not disclose source code. private version of Level 3 script with my accumulated script processing skills or a large number of custom functions. I had a private function library built in past two years. Level 5 scripts use many of them to achieve private trading strategy.
Cerca negli script per "Divergence"

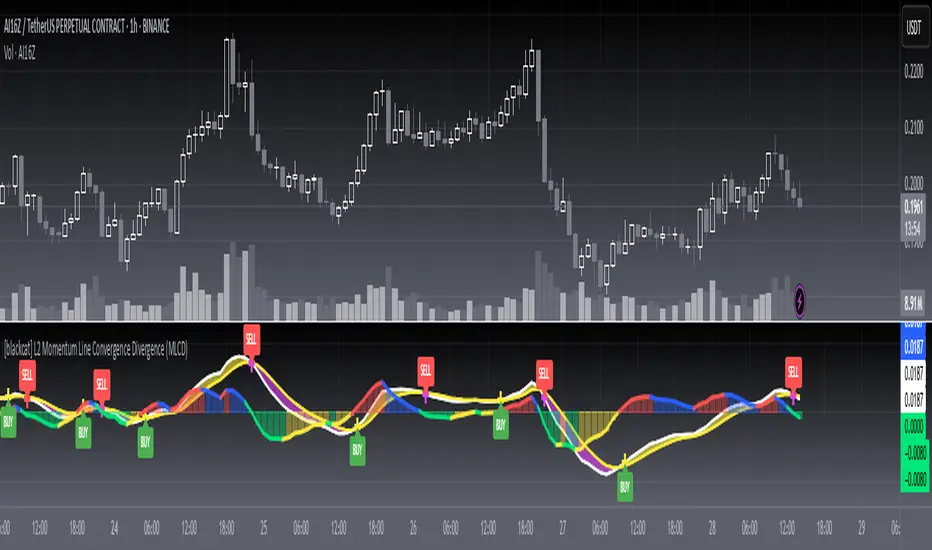
[blackcat] L2 Momentum Line Convergence Divergence (MLCD)Level: 2
Background
Momentum indicators are technical analysis tools that can be used to determine the strength or weakness of the stock price. Momentum measures the speed at which stock prices rise or fall. Common momentum indicators are the relative strength index (RSI) and the moving average of convergence divergence (MACD).
Function
L2 Momentum Line Convergence Divergence (MLCD) is one of my innovative indicator which is to differeniate with average of convergence divergence (MACD). So, I named it as Momentum Line Convergence Divergence (MLCD). In order for everyone to be more familiar with its useage, I inherited the traditional MACD expression method, and added golden cross (yellow cross) and dead cross (fuchsia cross) prompts, as well as bottom divergence (lime cross) and top divergence (red cross) prompts.
Key Signal
mtm --> momentum fast line
mtmaux --> momentum slow line
mtmgx --> momentum gold cross in yellow
mtmdx --> momentum dead cross in fuchsia
mtmbotdiverg --> momentum bottom divergence alert in lime cross
mtmtopdiverg --> momentum top divergence alert in red cross
Pros and Cons
Pros:
1. very stable for market price change and trend following
2. visual bottom and top divergence alerts are provided
Cons:
To be found yet
Remarks
Blackcat1402 brand MLCD indicator
Readme
In real life, I am a prolific inventor. I have successfully applied for more than 60 international and regional patents in the past 12 years. But in the past two years or so, I have tried to transfer my creativity to the development of trading strategies. Tradingview is the ideal platform for me. I am selecting and contributing some of the hundreds of scripts to publish in Tradingview community. Welcome everyone to interact with me to discuss these interesting pine scripts.
The scripts posted are categorized into 5 levels according to my efforts or manhours put into these works.
Level 1 : interesting script snippets or distinctive improvement from classic indicators or strategy. Level 1 scripts can usually appear in more complex indicators as a function module or element.
Level 2 : composite indicator/strategy. By selecting or combining several independent or dependent functions or sub indicators in proper way, the composite script exhibits a resonance phenomenon which can filter out noise or fake trading signal to enhance trading confidence level.
Level 3 : comprehensive indicator/strategy. They are simple trading systems based on my strategies. They are commonly containing several or all of entry signal, close signal, stop loss, take profit, re-entry, risk management, and position sizing techniques. Even some interesting fundamental and mass psychological aspects are incorporated.
Level 4 : script snippets or functions that do not disclose source code. Interesting element that can reveal market laws and work as raw material for indicators and strategies. If you find Level 1~2 scripts are helpful, Level 4 is a private version that took me far more efforts to develop.
Level 5 : indicator/strategy that do not disclose source code. private version of Level 3 script with my accumulated script processing skills or a large number of custom functions. I had a private function library built in past two years. Level 5 scripts use many of them to achieve private trading strategy.
CryptoNL R.E.D (rsi+ema and divergence)I used the build-in divergence indicator and fine-tuned the divergence provision.
Alerts have also been added and ema12 for extra trend determination.
The background color indicates the bearish and bullish zones.
Bullish divergence are indicated with a green line and dot
Bearish divergence are indicated with a red line and dot
Hidden divergence are indicated with an orange line and stripe marking.
All settings can be adjusted as desired. In the example, the bearish lines are off and bullish on to show the difference.

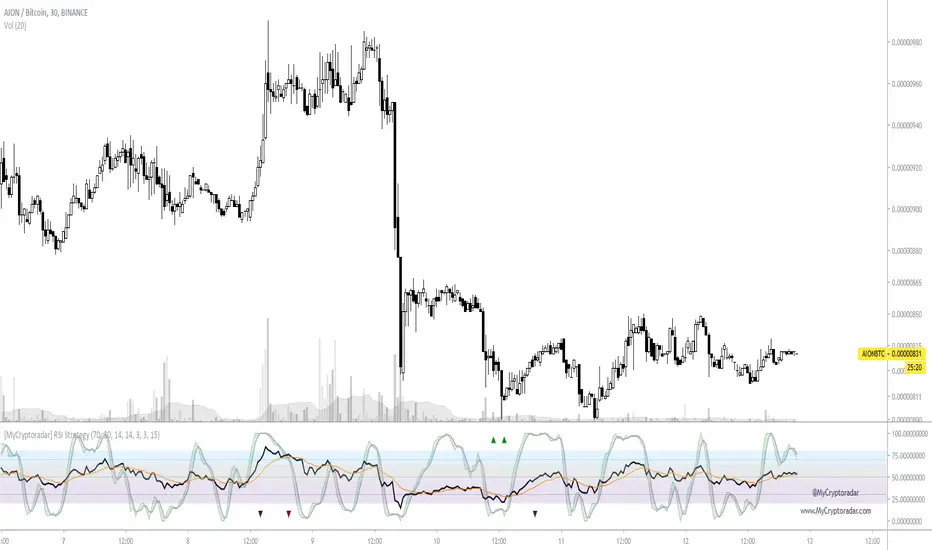
[Coingrats]RSI Divergence + StochRSIThis indicator shows the RSI and StochRSI. RSI divergence will also be marked.
- Bullish divergence - green triangle,
- Hidden bullish divergence - gray triangle
- Bearish divergence = red triangle
- Hidden bearish divergence - gray triangle
Credits to BabyWhale83 for the code to spotting divergence
WANNA TIP ME? BUY ME SOME BEERS!
BTC: 3BMEXX5JrX94ziUSoQMLEmi51WcYwphAg3
ETH: 0x541e504bb461aa141de6ddce09dc89eb16f58f9c
LTC: LPBJXzUZJksCuCK27AY2qAVYGGGiUfejok
DON'T FORGET TO LOOK AT OUR SITE MYCRYPTODARAR.COM
CDC RSI Divergence 15-10-2016An updated version of CDC RSI Divergence
The last version have fixed reversal amount to weed out false signal.
The reversal amount, however, needs to be calibrated to different chart.
The new one uses ATR instead, user can customize the ATR multiplier.
THIS IS NOT A TRADING SIGNAL SYSTEM
though it can be used in such a way it is not designed to.
The system helps identify Bullish and Bearish Divergence to help trader change their bias accordingly and should be used in conjunction with a trend following signal.
BULLISH DIVERGENCE is displayed with a green fill over 50 line.
BEARISH DIVERGENCE is displayed with a red fill under 50 line.
The indicator start on the bar where divergence is detected and persists for another 25 bars for easy regcognition.

Multi-cycle EMA50 + MACD divergence detectionThis tool uses a multi-period EMA50 + MACD divergence detection system. Divergence levels are indicated by dashed lines, while those without are indicated by solid lines. However, this tool cannot detect 1:1 divergence, so it is for reference only. Do not use this as a basis for opening trades; the specific trend must be analyzed based on the specific time frame.

MFI/RSI Divergence Lower하단 지표 구성 및 활용법
MFI (Aqua Line): 거래량이 가중된 자금 흐름입니다. 지지선 근처에서 이 선이 저점을 높이면(다이버전스) 강력한 매수 신호입니다.
RSI (Yellow Line): 가격의 상대적 강도입니다. MFI와 함께 움직임을 비교하여 보조적으로 활용합니다.
리페인팅 방지 핵심: offset=-lb_r 설정을 통해, 지표가 확정되는 시점(피벗 완성 시점)에 정확히 신호가 표시되도록 구현했습니다. 이는 과거 백테스트 결과와 실시간 매매 결과가 일치하도록 보장합니다.
실전 응용
지지/저항 필터: 이 지표 단독으로 사용하기보다, 차트 상의 주요 지지선에 가격이 위치했을 때 발생하는 BULL DIV 신호만 골라 매수하면 승률이 극대화됩니다.
손절/익절 최적화: 현재 1.5% 손절, 3% 익절로 설정되어 있습니다. 종목의 변동성(ATR)에 따라 group_risk에서 수치를 조정하며 최적의 수익 곡선을 찾아보십시오.
//@version=6
strategy("Hybrid MFI/RSI Divergence Lower",
overlay=false, // 하단 지표 설정을 위해 false
initial_capital=10000,
default_qty_type=strategy.percent_of_equity,
default_qty_value=10,
commission_type=strategy.commission.percent,
commission_value=0.05,
slippage=1)
// --- ---
group_date = "1. 백테스트 기간"
start_time = input.time(timestamp("2024-01-01 00:00:00"), "시작일", group=group_date)
end_time = input.time(timestamp("2026-12-31 23:59:59"), "종료일", group=group_date)
within_window() => time >= start_time and time <= end_time
group_osc = "2. 오실레이터 설정"
mfi_len = input.int(14, "MFI 기간", group=group_osc)
rsi_len = input.int(14, "RSI 기간", group=group_osc)
ob_level = input.int(80, "과매수 기준", group=group_osc)
os_level = input.int(20, "과매도 기준", group=group_osc)
group_div = "3. 다이버전스 감도"
lb_l = input.int(5, "피벗 왼쪽 범위", group=group_div)
lb_r = input.int(5, "피벗 오른쪽 범위", group=group_div)
group_risk = "4. 리스크 관리"
tp_pct = input.float(3.0, "익절 (%)", step=0.1, group=group_risk) / 100
sl_pct = input.float(1.5, "손절 (%)", step=0.1, group=group_risk) / 100
// --- ---
mfi_val = ta.mfi(close, mfi_len)
rsi_val = ta.rsi(close, rsi_len)
avg_val = (mfi_val + rsi_val) / 2 // MFI와 RSI의 평균값으로 부드러운 흐름 파악
// --- ---
// 저점 피벗 탐지 (MFI 기준)
pl = ta.pivotlow(mfi_val, lb_l, lb_r)
ph = ta.pivothigh(mfi_val, lb_l, lb_r)
// Bullish Divergence (상승 다이버전스)
var float last_pl_mfi = na
var float last_pl_price = na
bool is_bull_div = false
if not na(pl)
last_pl_mfi := mfi_val
last_pl_price := low
// 이전 저점 탐색
float prev_pl_mfi = ta.valuewhen(not na(pl), mfi_val , 1)
float prev_pl_price = ta.valuewhen(not na(pl), low , 1)
if low < prev_pl_price and mfi_val > prev_pl_mfi
is_bull_div := true
// Bearish Divergence (하락 다이버전스)
var float last_ph_mfi = na
var float last_ph_price = na
bool is_bear_div = false
if not na(ph)
last_ph_mfi := mfi_val
last_ph_price := high
float prev_ph_mfi = ta.valuewhen(not na(ph), mfi_val , 1)
float prev_ph_price = ta.valuewhen(not na(ph), high , 1)
if high > prev_ph_price and mfi_val < prev_ph_mfi
is_bear_div := true
// --- ---
if within_window()
if is_bull_div
strategy.entry("Bull", strategy.long, comment="Bull Div")
if is_bear_div
strategy.entry("Bear", strategy.short, comment="Bear Div")
strategy.exit("ExB", "Bull", limit=strategy.position_avg_price * (1 + tp_pct), stop=strategy.position_avg_price * (1 - sl_pct))
strategy.exit("ExS", "Bear", limit=strategy.position_avg_price * (1 - tp_pct), stop=strategy.position_avg_price * (1 + sl_pct))
// --- ---
// 배경 레이아웃
hline(ob_level, "Overbought", color=color.new(color.red, 50), linestyle=hline.style_dashed)
hline(50, "Middle", color=color.new(color.gray, 70))
hline(os_level, "Oversold", color=color.new(color.green, 50), linestyle=hline.style_dashed)
// 메인 지표 플롯
plot(mfi_val, "MFI (Money Flow)", color=color.new(color.aqua, 0), linewidth=2)
plot(rsi_val, "RSI (Momentum)", color=color.new(color.yellow, 50), linewidth=1)
// 다이버전스 발생 시 하단 지표 영역에 선 그리기
plotshape(is_bull_div ? mfi_val : na, "Bull Div Circle", shape.circle, location.absolute, color.green, size=size.tiny, offset=-lb_r)
plotshape(is_bear_div ? mfi_val : na, "Bear Div Circle", shape.circle, location.absolute, color.red, size=size.tiny, offset=-lb_r)
// 과매수/과매도 배경색
fill(hline(ob_level), hline(100), color.new(color.red, 90))
fill(hline(0), hline(os_level), color.new(color.green, 90))

SMI 30m With Built-in Divergence AlertsStochastic Momentum Index SMI 30m is a simplified, single-timeframe Stochastic Momentum Index (SMI) designed for traders who want a clean momentum oscillator with clear crossover signals and automatic higher-timeframe filtering.
This version is locked to a 30-minute timeframe, making it consistent across any chart you place it on.
The script plots:
SMI Blue Line – the main momentum line
SMI Orange Line – the signal line (EMA-smoothed)
Overbought / Oversold regions
Optional colored background zones that highlight strong momentum extremes
Both the Blue and Orange plots are fully exposed, allowing users to manually create TradingView alerts for crossovers.
Additionally, the script includes two built-in alert conditions for traders who prefer automatic signals.
How the SMI is calculated
This script uses a double-EMA smoothing method to stabilize momentum:
Highest and lowest price ranges are calculated over the selected %K period.
Relative position of price inside that range is computed.
A double EMA is applied to both the range and the midpoint offset.
The SMI result is scaled to ±200 for clarity.
The Signal Line is a single-EMA applied to the SMI.
These parameters can be adjusted:
%K Length
%D Length
EMA Length
The default values match traditional 13-3-3 SMI settings.
Visual Components
1. SMI Blue Line
Represents the primary momentum movement.
Values above 40 indicate positive momentum; values below −40 indicate negative momentum.
2. SMI Orange Line
Acts as a smoothing signal line.
Crossovers between Blue and Orange often indicate momentum shifts.
3. Overbought / Oversold Zones
+40 = overbought boundary
−40 = oversold boundary
These levels help identify exhaustion points.
4. Gradient High/Low Zones
The script includes colored fill zones above +40 and below −40 to visually highlight extreme momentum regions.
Built-In Alerts
The indicator includes two pre-configured alert conditions:
1. Bearish Cross (Overbought)
Triggers when:
The Blue SMI crosses below the Orange SMI
AND the Blue SMI value is above 80
This represents a potential bearish divergence or momentum reversal from extreme highs.
Alert title:
SMI Bearish Cross
2. Bullish Cross (Oversold)
Triggers when:
The Blue SMI crosses above the Orange SMI
AND the Blue SMI value is below −80
This represents a potential bullish divergence or reversal from extreme lows.
Alert title:
SMI Bullish Cross
How to Use Alerts
After adding the indicator to your chart:
Open the Alerts panel
Select Condition → SMI (1 TF) 30m
Choose either:
SMI Bearish Cross
SMI Bullish Cross
Set your preferred trigger method:
Once per bar close
Once per bar
Once per minute
Create the alert
Traders can also manually create alerts for:
Blue crossing above Orange
Blue crossing below Orange
Because both plots are fully exposed.
Purpose
This indicator is intended for traders who want a stable, single-timeframe SMI with:
Clear structure
Extreme-zone highlighting
Exposed plots for custom alerts
Built-in reversal alerts
Consistent 30-minute TF regardless of chart
It can be used for:
Identifying trend reversals
Detecting momentum exhaustion
Confirming entries/exits
Spotting early divergence signals

RSI Divergence Indicator with closingRSI Divergence Indicator with Closing Line is an advanced momentum-analysis tool that combines Regular Divergence, Hidden Divergence, Multi-RSI comparison, Moving Averages, and a dynamic RSI Closing Line into one powerful oscillator panel.
This script is designed for traders who want deeper insight into momentum strength, trend exhaustion, and reversal zones by analyzing both price action and RSI structure.
Victoria RSI Hybrid Pro – Momentum + Volume + DivergenceConditions and Actions:
RSI > 50 → Bullish regime → Consider Calls
RSI < 50 → Bearish regime → Consider Puts
RSI crosses up → Momentum shift up → Buy confirmation
RSI crosses down → Momentum shift down → Sell confirmation
RSI > 70 → Overbought → Take profits
RSI < 30 → Oversold → Watch for reversal
Bullish divergence → Hidden upward momentum → Reversal watch
Bearish divergence → Hidden downward momentum → Reversal watch
4. Multi-Indicator Confirmation Rules
Combine signals from EMA, SMA, RSI, and Volume to identify high-confidence trades.
Rules:
Triple Green → EMA1>SMA3, RSI>50, Volume Up → Buy Calls / Shares
Triple Red → EMA1 70 + Weak Volume → Exit Calls early
EMA1 flips direction + Strong Volume → Confirm bias immediately
RSI on 1H agrees with main chart → Trend continuation likely
6. Timeframes
Scalps: 1m–5m
Next-Day Options: 15m–1H
Swings: 4H–1D
7. Key Mindset Rules
Patience beats prediction. Wait for confirmations.
Volume confirms conviction, not direction.
If RSI and Overlay disagree → No trade.
Only act when 2 of 3 systems (EMA, RSI, Volume) align.

Mean Reversion Oscillator [Alpha Extract]An advanced composite oscillator system specifically designed to identify extreme market conditions and high-probability mean reversion opportunities, combining five proven oscillators into a single, powerful analytical framework.
By integrating multiple momentum and volume-based indicators with sophisticated extreme level detection, this oscillator provides precise entry signals for contrarian trading strategies while filtering out false reversals through momentum confirmation.
🔶 Multi-Oscillator Composite Framework
Utilizes a comprehensive approach that combines Bollinger %B, RSI, Stochastic, Money Flow Index, and Williams %R into a unified composite score. This multi-dimensional analysis ensures robust signal generation by capturing different aspects of market extremes and momentum shifts.
// Weighted composite (equal weights)
normalized_bb = bb_percent
normalized_rsi = rsi
normalized_stoch = stoch_d_val
normalized_mfi = mfi
normalized_williams = williams_r
composite_raw = (normalized_bb + normalized_rsi + normalized_stoch + normalized_mfi + normalized_williams) / 5
composite = ta.sma(composite_raw, composite_smooth)
🔶 Advanced Extreme Level Detection
Features a sophisticated dual-threshold system that distinguishes between moderate and extreme market conditions. This hierarchical approach allows traders to identify varying degrees of mean reversion potential, from moderate oversold/overbought conditions to extreme levels that demand immediate attention.
🔶 Momentum Confirmation System
Incorporates a specialized momentum histogram that confirms mean reversion signals by analyzing the rate of change in the composite oscillator. This prevents premature entries during strong trending conditions while highlighting genuine reversal opportunities.
// Oscillator momentum (rate of change)
osc_momentum = ta.mom(composite, 5)
histogram = osc_momentum
// Momentum confirmation
momentum_bullish = histogram > histogram
momentum_bearish = histogram < histogram
// Confirmed signals
confirmed_bullish = bullish_entry and momentum_bullish
confirmed_bearish = bearish_entry and momentum_bearish
🔶 Dynamic Visual Intelligence
The oscillator line adapts its color intensity based on proximity to extreme levels, providing instant visual feedback about market conditions. Background shading creates clear zones that highlight when markets enter moderate or extreme territories.
🔶 Intelligent Signal Generation
Generates precise entry signals only when the composite oscillator crosses extreme thresholds with momentum confirmation. This dual-confirmation approach significantly reduces false signals while maintaining sensitivity to genuine mean reversion opportunities.
How It Works
🔶 Composite Score Calculation
The indicator simultaneously tracks five different oscillators, each normalized to a 0-100 scale, then combines them into a smoothed composite score. This approach eliminates the noise inherent in single-oscillator analysis while capturing the consensus view of multiple momentum indicators.
// Mean reversion entry signals
bullish_entry = ta.crossover(composite, 100 - extreme_level) and composite < (100 - extreme_level)
bearish_entry = ta.crossunder(composite, extreme_level) and composite > extreme_level
// Bollinger %B calculation
bb_basis = ta.sma(src, bb_length)
bb_dev = bb_mult * ta.stdev(src, bb_length)
bb_percent = (src - bb_lower) / (bb_upper - bb_lower) * 100
🔶 Extreme Zone Identification
The system automatically identifies when markets reach statistically significant extreme levels, both moderate (65/35) and extreme (80/20). These zones represent areas where mean reversion has the highest probability of success based on historical market behavior.
🔶 Momentum Histogram Analysis
A specialized momentum histogram tracks the velocity of oscillator changes, helping traders distinguish between healthy corrections and potential trend reversals. The histogram's color-coded display makes momentum shifts immediately apparent.
🔶 Divergence Detection Framework
Built-in divergence analysis identifies situations where price and oscillator movements diverge, often signaling impending reversals. Diamond-shaped markers highlight these critical divergence patterns for enhanced pattern recognition.
🔶 Real-Time Information Dashboard
An integrated information table provides instant access to current oscillator readings, market status, and individual component values. This dashboard eliminates the need to manually check multiple indicators while trading.
🔶 Individual Component Display
Optional display of individual oscillator components allows traders to understand which specific indicators are driving the composite signal. This transparency enables more informed decision-making and deeper market analysis.
🔶 Adaptive Background Coloring
Intelligent background shading automatically adjusts based on market conditions, creating visual zones that correspond to different levels of mean reversion potential. The subtle color gradations make pattern recognition effortless.
1D
3D
🔶 Comprehensive Alert System
Multi-tier alert system covers confirmed entry signals, divergence patterns, and extreme level breaches. Each alert type provides specific context about the detected condition, enabling traders to respond appropriately to different signal strengths.
🔶 Customizable Threshold Management
Fully adjustable extreme and moderate levels allow traders to fine-tune the indicator's sensitivity to match different market volatilities and trading timeframes. This flexibility ensures optimal performance across various market conditions.
🔶 Why Choose AE - Mean Reversion Oscillator?
This indicator provides the most comprehensive approach to mean reversion trading by combining multiple proven oscillators with advanced confirmation mechanisms. By offering clear visual hierarchies for different extreme levels and requiring momentum confirmation for signals, it empowers traders to identify high-probability contrarian opportunities while avoiding false reversals. The sophisticated composite methodology ensures that signals are both statistically significant and practically actionable, making it an essential tool for traders focused on mean reversion strategies across all market conditions.

Moving Average Convergence-Divergence (MACD)This script implements the Moving Average Convergence-Divergence (MACD), a popular momentum indicator used in technical analysis to identify trend direction, momentum shifts, and potential buy/sell signals.
🔹 Key Features
1. Inputs & Customization
MACD Lines Toggle: Enable/disable the MACD and signal lines.
Source Price: Defaults to close but can be adjusted (e.g., open, high, low, hl2).
Fast Length (12): The period for the faster-moving EMA.
Slow Length (26): The period for the slower-moving EMA.
Signal Length (9): The smoothing period for the signal line.
2. Calculations
Computes the MACD Line (fast EMA - slow EMA).
Computes the Signal Line (EMA of the MACD line).
Computes the Histogram (difference between MACD and Signal lines).
3. Visual Indicators
Zero Line: A white horizontal line at 0 for reference.
MACD Line: Plotted in green when above the signal line, red when below.
Signal Line: Displayed as a yellow line.
Histogram:
Green bars when MACD > Signal (bullish momentum).
Red bars when MACD < Signal (bearish momentum).
Background Highlights:
Light green on bullish crossovers (MACD crosses above Signal).
Light red on bearish crossunders (MACD crosses below Signal).
4. Alerts
Triggers when:
Bullish Crossover (MACD crosses above Signal).
Bearish Crossunder (MACD crosses below Signal).
🔹 How Traders Use This Indicator
Trend Identification:
MACD above zero → bullish trend.
MACD below zero → bearish trend.
Momentum Signals:
Bullish Crossover (Buy Signal): MACD crosses above Signal.
Bearish Crossunder (Sell Signal): MACD crosses below Signal.
Divergence (Not in this script, but useful):
Price makes higher highs, but MACD makes lower highs → Potential reversal.
🔹 Strengths of This Script
✅ Clean and Efficient Code – Uses Pine Script v6 best practices.
✅ Customizable Inputs – Adjust lengths and source price.
✅ Clear Visuals – Color-coded for easy interpretation.
✅ Built-in Alerts – For automated trading strategies.
Jul 1
Release Notes
This script implements the Moving Average Convergence-Divergence (MACD), a popular momentum indicator used in technical analysis to identify trend direction, momentum shifts, and potential buy/sell signals.
🔹 Key Features
1. Inputs & Customization
MACD Lines Toggle: Enable/disable the MACD and signal lines.
Source Price: Defaults to close but can be adjusted (e.g., open, high, low, hl2).
Fast Length (12): The period for the faster-moving EMA.
Slow Length (26): The period for the slower-moving EMA.
Signal Length (9): The smoothing period for the signal line.
2. Calculations
Computes the MACD Line (fast EMA - slow EMA).
Computes the Signal Line (EMA of the MACD line).
Computes the Histogram (difference between MACD and Signal lines).
3. Visual Indicators
Zero Line: A white horizontal line at 0 for reference.
MACD Line: Plotted in green when above the signal line, red when below.
Signal Line: Displayed as a yellow line.
Histogram:
Green bars when MACD > Signal (bullish momentum).
Red bars when MACD < Signal (bearish momentum).
Background Highlights:
Light green on bullish crossovers (MACD crosses above Signal).
Light red on bearish crossunders (MACD crosses below Signal).
4. Alerts
Triggers when:
Bullish Crossover (MACD crosses above Signal).
Bearish Crossunder (MACD crosses below Signal).
🔹 How Traders Use This Indicator
Trend Identification:
MACD above zero → bullish trend.
MACD below zero → bearish trend.
Momentum Signals:
Bullish Crossover (Buy Signal): MACD crosses above Signal.
Bearish Crossunder (Sell Signal): MACD crosses below Signal.
Divergence (Not in this script, but useful):
Price makes higher highs, but MACD makes lower highs → Potential reversal.
🔹 Strengths of This Script
✅ Clean and Efficient Code – Uses Pine Script v6 best practices.
✅ Customizable Inputs – Adjust lengths and source price.
✅ Clear Visuals – Color-coded for easy interpretation.
✅ Built-in Alerts – For automated trading strategies.

Stochastic Divergence StrategyBackground bars:
Bearish
gradient from slightly bearish divergence to strong bearish divergence for red and a double bounce for pink
Bullish
gradient from slightly bearish divergence to strong bearish divergence for green and a double bounce for yellow
removable buy and sell signals in options
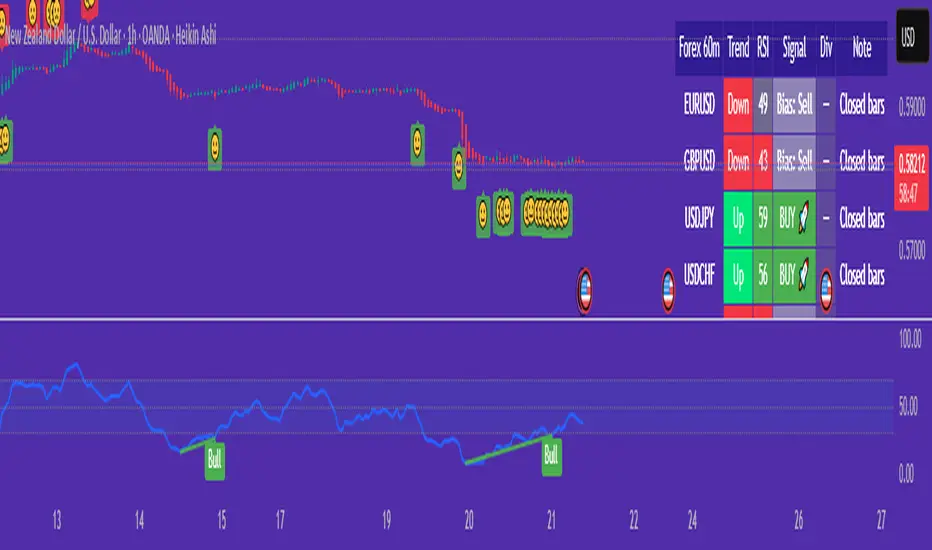
Forex 60m Simple Scanner + RSI Divergence“Forex 60m Simple Scanner + RSI Divergence”
This scanner helps beginner traders quickly identify trade opportunities across the top 10 forex pairs. It combines a simple EMA crossover system with an optional RSI filter to confirm trend direction, and adds RSI divergence detection to spot potential reversals early.
The built-in table shows each pair’s trend, RSI value, buy/sell signal, and divergence status—all in one place.
For beginners, this makes it easier to:
Avoid flipping between multiple charts.
See clear BUY/SELL 🚀 signals instead of guessing.
Spot high-probability setups with RSI divergence markers (😊/☹️).
It simplifies decision-making by turning complex signals into a straightforward dashboard that highlights where attention is needed most.
Forex 5m Simple Scanner + RSI DivergenceHello everyone. this is a easy to use indicator.
I wanted something very easy to visualize and understand. Great for the beginner's.
About this script:
“Forex 5m Simple Scanner + RSI Divergence”
This scanner helps beginner traders quickly identify trade opportunities across the top 10 forex pairs. It combines a simple EMA crossover system with an optional RSI filter to confirm trend direction, and adds RSI divergence detection to spot potential reversals early.
The built-in table shows each pair’s trend, RSI value, buy/sell signal, and divergence status—all in one place.
For beginners, this makes it easier to:
Avoid flipping between multiple charts.
See clear BUY/SELL 🚀 signals instead of guessing.
Spot high-probability setups with RSI divergence markers (😊/☹️).
It simplifies decision-making by turning complex signals into a straightforward dashboard that highlights where attention is needed most.

CVD Divergence + Volume HMA RSI MACD StrategyHow the script works:
The script calculates the HMA for trend direction. The HMA (shown in orange) is used as a filter: long trades are taken only if price is above the HMA, and short trades when below.
The CVD is computed by cumulatively adding volume on up bars and subtracting volume on down bars.
Pivot routines (with the input "Pivot Length") detect swing lows/highs for both price and CVD. A bullish divergence is flagged when the price makes a lower low while the CVD makes a higher low. Similarly, a bearish divergence is flagged when the price makes a higher high while the CVD makes a lower high.
Trading is triggered when the divergence condition also agrees with the HMA filter.
Feel free to further adjust the parameters or add risk‐management/exit rules as needed for your trading style.

CDP - Counter-Directional-Pivot🎯 CDP - Counter-Directional-Pivot
📊 Overview
The Counter-Directional-Pivot (CDP) indicator calculates five critical price levels based on the previous day's OHLC data, specifically designed for multi-timeframe analysis. Unlike standard pivot points, CDP levels are calculated using a unique formula that identifies potential reversal zones where price action often changes direction.
⚡ What Makes This Script Original
This implementation solves several technical challenges that existing pivot indicators face:
🔄 Multi-Timeframe Consistency: Values remain identical across all timeframes (1m, 5m, 1h, daily) - a common problem with many pivot implementations
🔒 Intraday Stability: Uses advanced value-locking technology to prevent the "stepping" effect that occurs when pivot lines shift during the trading session
💪 Robust Data Handling: Optimized for both liquid and illiquid stocks with enhanced data synchronization
🧮 CDP Calculation Formula
The indicator calculates five key levels using the previous day's High (H), Low (L), and Close (C):
CDP = (H + L + C) ÷ 3 (Central Decision Point)
AH = 2×CDP + H – 2×L (Anchor High - Strong Resistance)
NH = 2×CDP – L (Near High - Moderate Resistance)
AL = 2×CDP – 2×H + L (Anchor Low - Strong Support)
NL = 2×CDP – H (Near Low - Moderate Support)
✨ Key Features
🎨 Visual Elements
📈 Five Distinct Price Levels: Each with customizable colors and line styles
🏷️ Smart Label System: Shows exact price values for each level
📋 Optional Value Table: Displays all levels in an organized table format
🎯 Clean Chart Display: Minimal visual clutter while maximizing information
⚙️ Technical Advantages
🔐 Session-Locked Values: Prices are locked at market open, preventing intraday shifts
🔄 Multi-Timeframe Sync: Perfect consistency between daily and intraday charts
✅ Data Validation: Built-in checks ensure reliable calculations
🚀 Performance Optimized: Efficient code structure for fast loading
💼 Trading Applications
🔄 Reversal Zones: AH and AL often act as strong turning points
💥 Breakout Confirmation: Price movement beyond these levels signals trend continuation
🛡️ Risk Management: Use levels for stop-loss and take-profit placement
🏗️ Market Structure: Understand daily ranges and potential price targets
📚 How to Use
🚀 Basic Setup
Add the indicator to your chart (works on any timeframe)
Customize colors for easy identification of support/resistance zones
Enable the value table for quick reference of exact price levels
📈 Trading Strategy Examples
🟢 Long Bias: Look for bounces at NL or AL levels
🔴 Short Bias: Watch for rejections at NH or AH levels
💥 Breakout Trading: Enter positions when price decisively breaks through anchor levels
↔️ Range Trading: Use CDP as the central reference point for range-bound markets
🎯 Advanced Strategy Combinations
RSI Integration for Enhanced Signals: 📊
📉 Oversold Bounces: Combine RSI below 30 with price touching AL/NL levels for high-probability long entries
📈 Overbought Rejections: Look for RSI above 70 with price rejecting AH/NH levels for short opportunities
🔍 Divergence Confirmation: When RSI shows bullish divergence at support levels (AL/NL) or bearish divergence at resistance levels (AH/NH), it often signals stronger reversal potential
⚡ Momentum Confluence: RSI crossing 50 while price breaks through CDP can confirm trend direction changes
⚙️ Configuration Options
🎨 Line Customization: Adjust width, style (solid/dashed/dotted), and colors
👁️ Display Preferences: Toggle individual levels, labels, and value table
📍 Table Position: Place the value table anywhere on your chart
🔔 Alert System: Get notifications when price crosses key levels
🔧 Technical Implementation Details
🎯 Data Reliability
The script uses request.security() with lookahead settings to ensure historical accuracy while maintaining real-time functionality. The value-locking mechanism prevents the common issue where pivot levels shift during the trading day.
🔄 Multi-Timeframe Logic
⏰ Intraday Charts: Display previous day's calculated levels as stable horizontal lines
📅 Daily Charts: Show current day's levels based on yesterday's OHLC
🔍 Consistency Check: All timeframes reference the same source data
🤔 Why CDP vs Standard Pivots?
Counter-Directional Pivots often provide more accurate reversal points than traditional pivot calculations because they incorporate the relationship between high/low ranges and closing prices more effectively. The formula creates levels that better reflect market psychology and institutional trading behaviors.
💡 Best Practices
💧 Use on liquid markets for most reliable results
📊 RSI Combination: Add RSI indicator for overbought/oversold confirmation and divergence analysis
📊 Combine with volume analysis for confirmation
🔍 Consider multiple timeframe analysis (daily levels on hourly charts)
📝 Test thoroughly in paper trading before live implementation
💪 Example Market Applications
NASDAQ:AAPL AAPL - Tech stock breakouts through AH levels
$NYSE:SPY SPY - Index trading with CDP range analysis
NASDAQ:TSLA TSLA - Volatile stock reversals at AL/NL levels
⚠️ This indicator is designed for educational and analytical purposes. Always combine with proper risk management and additional technical analysis tools.

ADX Divergence and Gap Monitor [theUltimator5]ADX Divergence and Gap Monitor is a custom technical analysis tool designed to visualize momentum imbalances and sudden shifts in trend participation using the ADX system. It combines traditional ADX, DI+ and DI− calculations with dynamic filtering and visual highlighting to help identify key moments of directional acceleration or weakening.
🔍 What It Does:
This indicator builds on the Average Directional Index (ADX) system to detect conditions where market trend strength diverges significantly from directional input (DI) activity. It includes two major visual signals:
Highlight Backgrounds
These appear when the indicator detects a “gap” or sudden acceleration in DI values while ADX remains low, suggesting early-stage momentum bursts or signal noise spikes.
The trigger threshold for DI change can be adjusted using the Gap Trigger Level input.
A background highlight is shown when DI+ or DI− increases sharply, either from a low-ADX environment or from a rapid standalone spike.
GAP Markers
Optional yellow label markers display the word "GAP" just below the lowest line (ADX, DI+, or DI−) whenever a gap condition is triggered. These provide a more noticeable visual cue without crowding the chart.
You can enable or disable the markers with the Show GAP Markers toggle.
🧠 Advanced Divergence Detection:
The script also scans for dominant ADX divergence events, where ADX is significantly higher than DI+ or DI−, indicating strong trend force with weak directional participation. When these conditions are met:
Red or green background fills appear depending on whether DI+ or DI− is being overpowered.
These conditions are based on customizable moving averages and DI strength relationships.
⚙️ Key Inputs:
ADX Length: Period for ADX calculation
DI Moving Average: Smoothing length for directional index signals
Gap Trigger Level: Minimum DI change needed to trigger a GAP highlight
Show Highlight Backgrounds: Toggle to display or hide background signals
Show GAP Markers: Toggle to show or hide text-based GAP labels
🧪 Use Cases:
Spot early breakouts or reversals when DI activity spikes while ADX is still low
Identify periods of trend exhaustion or false breakouts using divergence logic
Confirm trade entry points when ADX begins to rise after a GAP event

BTC Spot vs Perpetual CVD DivergenceThis indicator:
Data Sources:
Uses Binance BTC/USDT for spot market
Uses Binance BTC/USD perpetual (USD-M) for futures market
Both symbols should be available on TradingView
CVD Approximation:
Since true CVD requires order book data (not fully available in Pine Script), we approximate it by:
Multiplying volume by price direction (+1 for up bars, -1 for down bars)
Summing over the specified lookback period
Normalization:
Normalizes both CVD values to a -1 to 1 range for fair comparison
This accounts for different volume scales between spot and perpetual markets
Divergence Calculation:
Subtracts normalized perpetual CVD from spot CVD
Positive values indicate spot market is more bullish than perpetual
Negative values indicate perpetual market is more bullish than spot
Visualization:
Red line: Main divergence indicator
Green line: Normalized spot CVD
Blue line: Normalized perpetual CVD
Green background: Strong positive divergence (>0.5)
Red background: Strong negative divergence (<-0.5)
Gray dashed line at zero
Limitations:
This is an approximation since true CVD requires buy/sell volume separation, which isn't directly available
Results may vary depending on timeframe and lookback period
Assumes volume data reliability from both markets

RSI Convergence DivergenceRSI based oscillator inspired by the MACD.
Indicator that consists of two RSI calibrated at different lengths to take advantage of their convergence, divergence, overall direction, overall strength and several other metrics to extract signals from the price action.
This indicator includes:
- Fast RSI
- Slow RSI
- Signal line to identify convergence/divergence
- Simple moving average applied to the average of the two RSI
- DEMA applied to the average of the two RSI
- An average moving average of the SMA and DEMA
Some of the applications of this indicator:
- Simple convergence/divergence signaled by the moving average going above or below zero.
- Crossover between SMA and DEMA
- Combination of convergence/divergence and one of the 3 MAs reaching overbought or oversold threshold
- Average moving average going above or below 50
The combinations of different conditions are countless and limited only by the imagination of the user.
The visualization inputs, besides allowing to choose the candle coloring, give the user the ability to keep the chart clean and only see the signals he is interested into.

Money Flow DivergenceThe Money Flow Divergence indicator is designed to help traders identify periods when there is a significant divergence between the growth of the U.S. M2 money supply and the S&P 500 index (SPX).
This divergence can provide insights into potential market turning points, making it a valuable tool for long-term investors and traders looking to capitalize on macroeconomic trends.
How It Works:
Data Sources:
S&P 500 Index (SPX) and U.S. M2 Money Supply.
Calculating Growth Rates:
SPX Growth: The script calculates the percentage growth of the S&P 500 index by comparing the current closing price with the previous period's closing price.
M2 Growth: Similarly, it calculates the percentage growth of the U.S. M2 money supply by comparing the current value with the previous period's value.
Growth Gap/Delta:
Growth Gap: The core of the indicator is the "growth gap" or "delta," which is the difference between the M2 money supply growth and the SPX growth. This gap indicates whether liquidity in the economy (represented by M2) is outpacing or lagging behind the performance of the stock market.
Interpretation:
Positive Gap (Green Bars): When the M2 growth outpaces SPX growth, the gap is positive, indicating that there is more liquidity in the system than what is being reflected in the stock market. This scenario often signals potential upward momentum in the market, making it a good time to consider buying.
Negative Gap (Red Bars): When the SPX growth outpaces M2 growth, the gap is negative, suggesting that the market may be overextended relative to the available liquidity. This can be a warning sign of potential market corrections or downturns.
Visualization:
The indicator plots the growth gap as a histogram with bars colored based on the gap value:
Green Bars: Indicate a positive gap where M2 growth is higher than SPX growth.
Red Bars: Indicate a negative gap where SPX growth is higher than M2 growth.
The bars are thickened for better visibility, and a horizontal line at zero is plotted to help users easily distinguish between positive and negative gaps.
How To Use It:
Time Frame Selection: Users can select the desired time frame (e.g., monthly, weekly) for the data. This flexibility allows traders to analyze the indicator over different periods, depending on their investment horizon.
Monthly time frames seem to work best.
Interpreting the Indicator:
Bullish Signals: Look for sustained periods of positive growth gaps (green bars), which may indicate a favorable environment for buying or holding long positions.
Bearish Signals: Be cautious during periods of negative growth gaps (red bars), which could signal overvaluation in the market or potential pullbacks.
Enjoy and let me know if you have any questions.

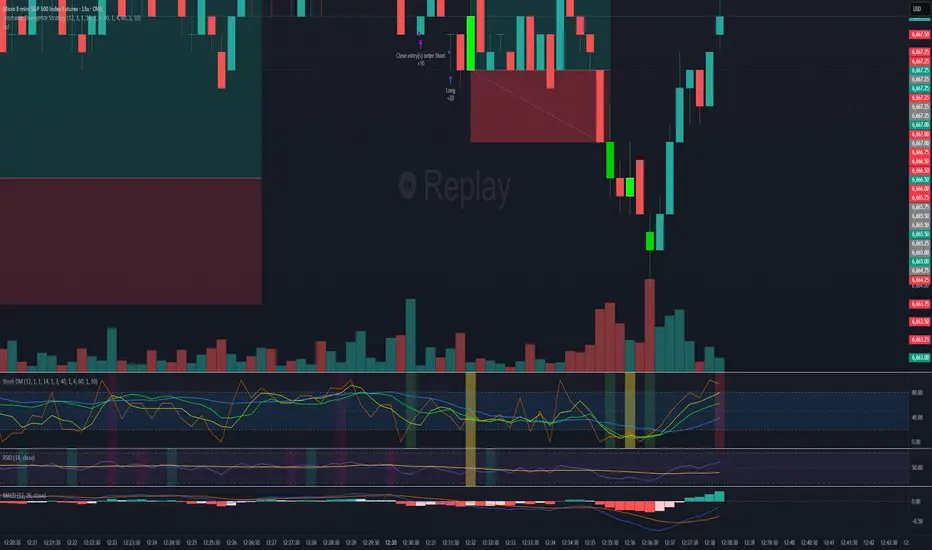
Extreme Entry with Mean Reversion and Trend FilterThis non-repainting indicator is an improved version of my previous work, a more versatile tool designed to provide traders with dynamic and adaptive entry signals while incorporating a mean reversion and trend filtering mechanism. By combining RSI overbought/oversold, regular divergence and confirmatory momentum oscillator such as CCI or MOM, this indicator generates more precise and timely signals for entering trades.
The indicator offers a comprehensive set of entry conditions for both Buy and Sell entries:
• For Buy entries, it checks for oversold conditions based on RSI levels, and detects bullish divergence patterns while oversold and it identifies upward crossovers in the selected entry signal source (CCI or Momentum).
• Similarly, for Sell entries, it identifies downward crossovers of the CCI or Mom, after the recent overbought conditions, and bearish divergence patterns inside the overbought RSI.
To refine the entry signals even further, the indicator utilizes a mean reversion filter. Traders can choose to display signals that occur inside or outside the upper and lower mean reversion bands:
• Range Entries are indicating potential buying opportunities near the lower band and selling opportunities near the upper band. This is based on the concept of mean reversion, which suggests that prices tend to return to the average when they reach the upper or lower bands. By focusing on these signals, traders can take advantage of price movements that have a higher probability of reversing towards the mean.
• Extreme Entries, on the other hand, represent signals that occur outside of the bands, signaling potential pullbacks during strong trends. By entering positions only at extreme highs or lows, traders can avoid getting caught in the middle of the trend. This approach helps traders capitalize more favorable trading opportunities which have a high reward-risk ratio.
Trend Filter acts as a directional bias for the entry signals. When enabled, long and short entry conditions are filtered based on the relationship between the closing price and the EMA.
Traders have the flexibility to customize, tweak the indicator filter and values in the settings according to their preferences strategies and traded assets, tailoring the signals to their specific needs. The script sets alert conditions to trigger alerts for buy, sell, or both entry signals. This indicator can be used in conjunction with price action or other technical analysis tools for confirmation and better trading decisions.
I created this indicator for my own use, and I share this for informational purposes only. It does not constitute financial advice so use at your own risk and consider your financial situation before making any trading decisions. The indicator's accuracy is not guaranteed, and past performance is not indicative of future results.
I appreciate your feedback on this indicator. As I am new to script development, I am open to comments and suggestions to improve it. If you encounter any issues while using this indicator, please let me know in the comments section. If you find it helpful, I kindly ask for your support in boosting it. Thank you for your cooperation.

TDMACD Divergence Multi Timeframe and Alert [5ema]I reused some functions, made by (i believe that):
@paaax: The table position function.
@everget: The RSI divergence function.
@QuantNomad: The function calculated value and array to show on table for input symbols.
@ChaosTrader: The function calculated value TDMACD.
-----
What to do?
MACD divergence signal.
The crossing of MACD and Signal line.
The reversal of MACD.
The reversal of Signal line.
The screener follow 6 different timeframes.
Set notification alert when signal appears.
-----
How is it created?
MACD line = fastMA - slowMA.
Signal line = ta.ema(macd(), signalLength)
Make function for pivot low & high point of MACD and price.
Request.security that function for earch time frame.
-----
How to use?
Can be combined with many other indicators or candlestick patterns.
Customize the input indicators to suit your strategy
1. MACD reversed:
2. Signal line reversed:
3. MACD Divergence :
4. MACD crossing Signal line:
5. Signal on Screener for multi time frame:
Green ⦿: Buy.
Red ⦿: Sell.
Green 〇: Review Buy.
Red 〇: Review Sell.
-----
This indicator is for reference only, you need your own method and strategy.
If you have any questions, please let me know in the comments.
