Enhanced Momentum Divergence Radar+ [Alpha Extract]Enhanced Momentum Divergence Radar+
The AE's Enhanced Momentum Divergence Radar+ is designed to detect momentum shifts and divergence patterns, helping traders identify potential trend reversals and continuation points. By normalizing momentum readings and applying divergence detection, it enhances market timing for entries and exits.
🔶 CALCULATION
The indicator calculates normalized momentum using a combination of Detrended Price Oscillator (DPO) and volatility-adjusted smoothing techniques. It highlights overbought and oversold conditions while identifying bullish and bearish divergences.
Core Calculation:
ATR-based volatility adjustment ensures dynamic sensitivity.
DPO is derived from the price minus a simple moving average (SMA) to isolate cyclical movements.
Momentum score is normalized using historical max values for consistent scaling.
Thresholds are dynamically adjusted based on average absolute momentum.
dpo = close - ma
sd = (dpo / volatility) * 100
normalizedSD = sd / maxAbsSD
The momentum score is plotted as a histogram, where:
Green bars indicate strong upward momentum.
Red bars indicate strong downward momentum.
Neutral values fade into gray.
🔶 DETAILS
📊 Visual Features:
Histogram bars dynamically color-coded based on momentum strength.
Threshold bands provide reference points for overbought and oversold levels.
Divergence markers (Bullish/Bearish & Hidden Bullish/Bearish) highlight key reversal signals.
🛠 How Divergences Work:
Bullish Divergence (𝓞𝓢): Price makes a lower low while momentum makes a higher low.
Bearish Divergence (𝓞𝓑): Price makes a higher high while momentum makes a lower high.
Hidden Divergences confirm trend continuations rather than reversals.
📌 Example of Divergence Logic:
bullishDiv = (low == priceLow) and (sd > momentumLow)
bearishDiv = (high == priceHigh) and (sd < momentumHigh)
🔶 EXAMPLES
📍 The chart below illustrates price reacting to momentum divergences, identifying potential tops and bottoms before major price moves.
📌 Example snapshots:
A bullish divergence leading to a reversal in price.
A bearish divergence marking the beginning of a downtrend.
🔶 SETTINGS
🔹 Customization Options:
Lookback Period: Adjusts sensitivity to market cycles.
Smoothing Period: Controls signal clarity.
Color Options: Enables bar coloring based on momentum strength.
Divergence Sensitivity: Choose to display hidden divergences.
Cerca negli script per "Divergence"

RSI Divergence Strategy - AliferCryptoStrategy Overview
The RSI Divergence Strategy is designed to identify potential reversals by detecting regular bullish and bearish divergences between price action and the Relative Strength Index (RSI). It automatically enters positions when a divergence is confirmed and manages risk with configurable stop-loss and take-profit levels.
Key Features
Automatic Divergence Detection: Scans for RSI pivot lows/highs vs. price pivots using user-defined lookback windows and bar ranges.
Dual SL/TP Methods:
- Swing-based: Stops placed a configurable percentage beyond the most recent swing high/low.
- ATR-based: Stops placed at a multiple of Average True Range, with a separate risk/reward multiplier.
Long and Short Entries: Buys on bullish divergences; sells short on bearish divergences.
Fully Customizable: Input groups for RSI, divergence, swing, ATR, and general SL/TP settings.
Visual Plotting: Marks divergences on chart and plots stop-loss (red) and take-profit (green) lines for active trades.
Alerts: Built-in alert conditions for both bullish and bearish RSI divergences.
Detailed Logic
RSI Calculation: Computes RSI of chosen source over a specified period.
Pivot Detection:
- Identifies RSI pivot lows/highs by scanning a lookback window to the left and right.
- Uses ta.barssince to ensure pivots are separated by a minimum/maximum number of bars.
Divergence Confirmation:
- Bullish: Price makes a lower low while RSI makes a higher low.
- Bearish: Price makes a higher high while RSI makes a lower high.
Entry:
- Opens a Long position when bullish divergence is true.
- Opens a Short position when bearish divergence is true.
Stop-Loss & Take-Profit:
- Swing Method: Computes the recent swing high/low then adjusts by a percentage margin.
- ATR Method: Uses the current ATR × multiplier applied to the entry price.
- Take-Profit: Calculated as entry price ± (risk × R/R ratio).
Exit Orders: Uses strategy.exit to place bracket orders (stop + limit) for both long and short positions.
Inputs and Configuration
RSI Settings: Length & price source for the RSI.
Divergence Settings: Pivot lookback parameters and valid bar ranges.
SL/TP Settings: Choice between Swing or ATR method.
Swing Settings: Swing lookback length, margin (%), and risk/reward ratio.
ATR Settings: ATR length, stop multiplier, and risk/reward ratio.
Usage Notes
Adjust the Pivot Lookback and Range values to suit the volatility and timeframe of your market.
Use higher ATR multipliers for wider stops in choppy conditions, or tighten swing margins in trending markets.
Backtest different R/R ratios to find the balance between win rate and reward.
Disclaimer
This script is for educational purposes only and does not constitute financial advice. Trading carries significant risk and you may lose more than your initial investment. Always conduct your own research and consider consulting a professional before making any trading decisions.

Price Divergence IndicatorThis Price Divergence Indicator indicator modifies the standard Divergence Indicator to look for price divergences between the current chart and any other selected TradingView chart.
The thesis that this indicator is built upon:
Prices on assets or indices that are normally correlated move in lock step. Where there are deviations between the confirmed highs or lows of two assets or indices it is likely that they will "catch up" in the near future.
By default it will load the price data for the SPX and look for price divergences on the current chart timeframe. Any TradingView Symbol can be selected as the 'Comparison Source' and any timeframe. Some of the options I've been trying out include:
SPX vs NDQ
XAO vs SPX
UK100 vs NDQM
MSFT vs NDQM
GOOG vs NDQM
AMZN vs MSFT
BTC vs ETH
BTC vs NDQ
BTC vs DXY
I've found looking for divergences on a longer timeframe can be useful and don't expect any meaningful results if you set it to shorter than chart timeframes.
Alerts can be created based on any of the divergences and the 'Backtest Buy Signal' can be used to send notification to a backtester (bull = 2, hidden bull = 1, neutral = 0, hidden bear = -1, bear = -2), this is plotted to display.none, so enable it in Settings - Style and disable all other plots to see it.
Divergences are measured between the CONFIRMED peaks of the two charts. The confirmation timeframe is set using 'Pivot Lookback Right'. The lower the lookback the quicker the signal and the more likely it is to not have hit an actual peak, a higher lookback will give a much more dependable signal but the move may be finished by the time the alert actually fires. The "Plot When Alerts Fire" option should give you an idea (top and bottom triangles) of what to expect, but you should watch bar replays to understand how your setting will impact when alerts are created and potential false positives.

RSI Divergence[UgurTash] – Real-Time📈 RSI Divergence – Real-Time, Adaptive, and Intelligent RSI Divergence Detection
🚀 What Does This Indicator Do?
RSI Divergence is a real-time divergence detection tool that helps traders identify bullish and bearish divergences between price and the Relative Strength Index (RSI). Unlike traditional RSI-based indicators, this script offers:
✅ Real-time detection – No need to wait for bar closes or repainting.
✅ Dynamic time-frame adaptation – The script automatically adjusts RSI settings based on the selected chart time frame.
✅ Multi-layered divergence analysis – Supports short-term, medium-term, and long-term divergence detection with an optional all-term mode that dynamically selects the best configuration.
🛠 How Does It Work?
Pivot-Based Divergence Detection:
The script analyzes pivot points on both price and RSI to determine valid divergences.
Bullish divergence occurs when price forms a lower low but RSI trends higher, indicating potential upward momentum.
Bearish divergence occurs when price forms a higher high but RSI trends lower, signaling possible weakness.
Adaptive RSI Calculation:
The RSI length is dynamically adjusted based on the chosen time frame:
Short-Term: RSI (7) for 1-5 min charts.
Medium-Term: RSI (14) for 15-60 min charts.
Long-Term: RSI (28) for 4H+ charts.
In All-Term Mode, the script automatically determines the best RSI length based on the active chart timeframe.
Smart Visualization & Alerts:
Bullish divergences are marked with green lines & labels.
Bearish divergences are highlighted in red.
Users can customize symbol size, divergence labels, and colors.
Instant alerts notify traders as soon as a divergence is detected.
🎯 How to Use This Indicator?
📌 For Trend Reversals: Look for bullish divergences at key support levels and bearish divergences at resistance zones.
📌 For Trend Continuation: Combine divergence signals with moving averages, volume analysis, or price action strategies to confirm trades.
📌 For Scalping & Swing Trading: Adjust the time-frame settings to match your trading style.
🏆 What Makes This Indicator Original?
🔹 Unlike standard RSI divergence indicators, this script features real-time analysis with no repainting, allowing for instant trading decisions.
🔹 The time-frame adaptive RSI makes it dynamic and suitable for any market condition.
🔹 The multi-term divergence detection offers flexibility, giving traders a precise view of both short-term & long-term market structure.
⚠ Note: No indicator guarantees 100% accuracy. Always use additional confirmations and sound risk management strategies.
If you find this tool useful, don’t forget to support & share! 🚀

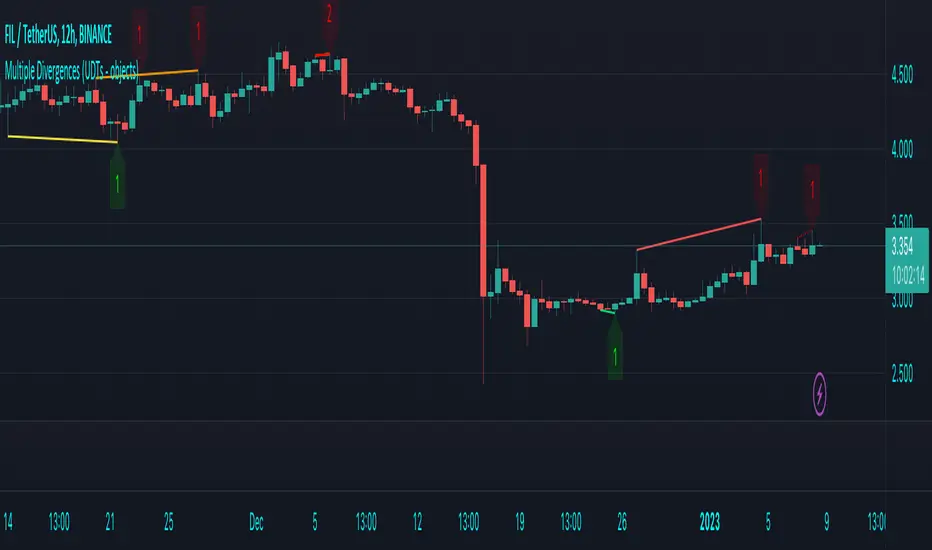
Multiple Divergences (UDTs - objects) - Educational█ OVERVIEW
This script highlights the usage of User-defined Types (UDTs) and objects , and bullish /bearish divergences.
Pivotpoints are used to find divergences, the result of this script will be different against other public multiple divergences scripts.
FOR Pine Script™ CODERS
Besides the information found in CONCEPTS , the comments in the script will, hopefully ), guide you through my thought process.
█ CONCEPTS
The main principle of this script are bullish /bearish divergences, this with 3 different oscillators ( RSI , CCI , MFI )
If you want to know more about divergences, have a look at some Education and Research idea's .
On every bar, an object HLs is made, containing bar_index , high , low , and 2 bool variables ( isPh , isPl ).
On every bar, an object Osc is made, containing bar_index , o (oscillator value), and 2 bool variables ( isPh , isPl ).
If a pivothigh (ph ) is found, isPh will be true on that bar, false otherwise.
If a pivotlow (pl) is found, isPl will be true on that bar, false otherwise.
These objects are added to an array, with limited size.
If a ph is found, the script draws a testline from that ph to every previous ph , found in the array.
Then every high in between these 2 points are checked if they don't pierce the testline .
If the testline isn't broken, the Reg_Div_Piv() function will give 4 values, 1 check (not pierced) variable and the 4 points of the line.
The testline is deleted.
Once a positive check is found, the script will perform the same, but now with the Osc objects.
The script will ONLY compare Osc pivots which are maximum 1 bar away from the high/low pivot .
If everything is confirmed, a line is drawn, visible on the chart.
█ REMARKS
A label will be visible with a number, this is the amount of divergences found with the according oscillator .
EXAMPLE
Div with RSI and CCI -> 2
Div with MFI alone -> 1
Div with RSI and CCI and MFI -> 3
...
Divergences should only be used when confirmed, this is after bar close .
As an aid, lines that are not confirmed will be dotted , if confirmed, they will be solid .
The divergence check start when a ph/pl is found, after which oscillator pivot are checked.
Optionally the same can be done, when a oscillator pivot is found and then check the ph/pl ,
this should give more results, although it can make the script slower.
█ SETTINGS
Left - amount of bars at the left which needs to be lower/higher
Right - amount of bars at the right which needs to be lower/higher
Max values - maximum values in array of objects
3 oscillator settings with
• ON/OFF
• Length
• color bullish divergence
• color bearish divergence
Have FUN !
Multi-Indicator Divergence ScreenerHere is a new screener for everyone.
I have applied my Better Divergence On Any Indicator logic to scan 3 different indicators and up to 6 different assets at one time. Shoutout to LonesomeTheBlue and QuantNomad for their respective work on divergence and scanner scripts. I've implemented similar logic to put together this scanner.
So far, I have added support for RSI, OBV, MACD, MFI, Stochastic, and FSR, though I'm happy to add more by request. Please note, for simplicity, I have removed the logic to filter for only overbought/oversold divergences. Because this can scan both centered oscillators and non-centered indicators, overbought/oversold does not apply to all of them. I may try to find a way to work in back in later, as time allows.
Personally, I like to find confluences different types of indicators. For instance, agreeable divergence with a centered strength oscillator like RSI and a volume based indicator like OBV gives me more confidence that there will be follow-through.
Like in the Better Divergence script, you can opt to scan for confirmed divergences, potential divergences, or both.
You have the option to show or hide a table that will tell you exactly which assets have divergence, on which indicator they were found, and how many points of divergence were identified. By default, bull divergences will be green, bear will be red, but you can change these base colors to your liking. Confirmed divergences are shown with a solid background, while potentials (if selected) are shown with transparent background. If all 3 of your chosen indicators have divergence in the same direction, the asset name will show in the bull or bear color to highlight the confluence.
Alerts have also been set up to fire on bar close. The message will essentially tell you the same thing the table does, but in condensed format.
You can choose to have alerts fire any time there is any divergence detected across all assets, only when there are divergences on at least 2 of the chosen indicators for a given asset, or limit them to only when all 3 indicators show divergence in agreement.

Relative Strength Index (RSI) w/ Multi Time Frame w/ DivergencesThis indicator is an advanced evolution of the classic Relative Strength Index (RSI), designed to provide deeper market context by combining Momentum, Multi-Timeframe (MTF) analysis, and Divergences into a single, clean visual tool.
Unlike standard indicators, RSI MTF Pro v2 allows you to configure the Main RSI and the Background Trend Zone independently, giving you full control over your strategy (e.g., watching a 15m RSI while monitoring the 4H trend).
Key Features:
🚀 Dual MTF Engine: Completely independent settings for the Main RSI Line and the Background Zone. You can choose different Timeframes, Lengths, and Levels for each.
heatmap Style Background: The indicator background changes color (Red/Green) based on the MTF RSI trend, helping you filter out bad trades and stick to the dominant trend.
🎨 Smart Gradient Fills: To keep your chart clean, the gradient colors (Red/Green fills) only appear when the RSI breaches the Overbought or Oversold levels.
🎯 Divergence Detector: Automatically spots and marks Regular Bullish and Bearish divergences with pivot-based logic.
How to Use:
Trend Confirmation: Use the Background Color to determine the higher timeframe direction (e.g., Red Background = Uptrend).
Entry Signals: Look for RSI signals that align with the background color (e.g., RSI Oversold/Green Gradient + Green Background).
Reversals: Use the built-in Divergence circles to spot potential trend reversals.
Settings:
Main RSI: Customizable Timeframe, Length, OB/OS Levels.
MTF Background: Independent Timeframe, Length, and Zone thresholds (e.g., >60 Red, <40 Green).
Divergences: Toggle On/Off and adjust Pivot lookback periods.
Disclaimer: This tool is for informational purposes only and does not constitute financial advice.

VWAP Divergence | Flux ChartsThe VWAP Divergence indicator aims to find divergences between price action and the VWAP indicator. It uses filters to filter out many of the false divergences and alert high quality, accurate signals.
Red dots above the candle represent bearish divergences, while green dots below the candle represent bullish divergences.
The main filter for divergences focuses on ATR and the price movement in the past candles up to the lookback period. Divergences are determined when a price movement over the lookback period is sharp enough to be greater/less than the ATR multiplier multiplied by the ATR.
Settings
Under "Divergence Settings", both the lookback period and ATR multiplier can be adjusted.
Due to the nature of the calculations, the ATR multiplier and the lookback period should be set lower on higher time frames. As price movements become more averaged, for example on the 15 minute chart, sharp price movements happen less frequently and are often contained in fewer candles as they happen on lower time frames. Less volatile stocks such as KO, CL, or BAC should also use lower ATR multipliers and lower lookback periods.
Under "Visual Settings", you can change the color of the VWAP line, show alternating VWAP colors, adjust divergence signal size, and show the VWAP line.

RSI + Divergences + Alerts [MisterMoTA]The indicator RSI + Divergences + Alerts by MisterMoTA is an RSI indicator that fills the RSI and RSI moving average with 4 different colors (growing up, falling up, falling down and rising down colors), users can customize colors from dashboard , also can be disabled the fill if the user want a standard RSI.
The dafault value of RSI is 14 and value of the moving average is 50 ( a dynamic 50 rsi line is better for trend identification than a standard 50 line) and users can change the values from indicator settings.
For detecting the divergences displayed in the indicator, I integrated in our script the default Divergences indicator from Tradingview, users can display, hide and change colors for regular and hidden divergences.
RSI indicator display also trend conditions for RSI and RSI MA, the RSI MA angle is calculated using ATR value, the slope of the RSI Noving Average can help to identify trend conditions too.
The script comes with 12 different alerts, if need different alerts please let me know in the comments and will update the script with your request:
Alert for Regular Bullish Divergence
Alert for Regular Bearish Divergence
Alert for Hidden Bullish Divergence
Alert for Hidden Bearish Divergence
Alert for RSI Overbought
Alert for RSI Extreme Overbought
"Alert for RSI Oversold
Alert for RSI Extreme Oversold
Alert for RSI Crossing Above RSI MA
Alert for RSI Crossing Bellow RSI MA
Alert for RSI Crossing Above 50
Alert for RSI Crossing Bellow 50
Please follow me for other script like this one.
Kind regards,
MisterMoTA

WaveTrend Divergences, Candle Colouring and TP Signal [LuciTech]WaveTrend is a momentum-based oscillator designed to track trend strength, detect divergences, and highlight potential take-profit zones using Bollinger Bands. It provides a clear visualization of market conditions to help traders identify trend shifts and exhaustion points.
The WaveTrend Oscillator consists of a smoothed momentum line (WT Line) and a signal line, which work together to indicate trend direction and possible reversals. When the WT Line crosses above the signal line, it suggests bullish momentum, while crossing below signals bearish momentum.
Candle colouring changes dynamically based on WaveTrend crossovers. If the WT Line crosses above the signal line, candles turn bullish. If the WT Line crosses below the signal line, candles turn bearish. This provides an immediate visual cue for trend direction.
Divergence Detection identifies when price action contradicts the WaveTrend movement.
Bullish Divergence appears when price makes a lower low, but the WT Line forms a higher low, suggesting weakening bearish pressure.
Bearish Divergence appears when price makes a higher high, but the WT Line forms a lower high, indicating weakening bullish pressure.
Plus (+) Divergences are stronger signals that occur when the first pivot of the divergence happens at an extreme level—above +60 for bearish divergence or below -60 for bullish divergence. These levels suggest the market is overbought or oversold, making the divergence more significant.
Bollinger Band Signals highlight potential take-profit zones by detecting when the WT Line moves beyond its upper or lower Bollinger Band.
If the WT Line crosses above the upper band, it signals stretched bullish momentum, suggesting a possible pullback or reversal.
If the WT Line crosses below the lower band, it indicates stretched bearish momentum, warning of a potential bounce.
How It Works
The WaveTrend momentum calculation is based on an EMA-smoothed moving average to filter out noise and provide a more reliable trend indication.
The WT Line (momentum line) fluctuates based on market momentum.
The signal line smooths out the WT Line to help identify trend shifts.
When the WT Line crosses above the signal line, it suggests buying pressure, and when it crosses below, it indicates selling pressure.
Divergences are detected by comparing pivot highs and lows in price with pivot highs and lows in the WT Line.
A pivot forms when a local high or low is confirmed after a certain number of bars.
The indicator tracks whether price action and the WT Line are making opposite movements.
If a divergence occurs and the first pivot was beyond ±60, it is marked as a Plus Divergence, making it a stronger reversal signal.
Bollinger Bands are applied directly to the WT Line instead of price, identifying when the WT Line moves outside its volatility range. This helps traders recognize when momentum is overstretched and a potential reversal or retracement is likely.
Settings
Channel Length (default: 8) controls the period used to calculate the WT Line.
Average Length (default: 16) smooths the WT Line for better trend detection.
Divergences (on/off) enables or disables divergence plotting.
Candle colouring (on/off) applies or removes trend-based candle colour changes.
Bollinger Band Signals (on/off) toggles take-profit signals when the WT Line crosses the bands.
Bullish/Bearish colours allow customization of divergence and signal colours.
Interpretation
The WaveTrend Oscillator helps traders assess market momentum and trend strength.
Crossovers between the WT Line and signal line indicate potential trend reversals.
Divergences warn of weakening momentum and possible reversals, with Plus Divergences acting as stronger signals.
Bollinger Band Crosses highlight areas where momentum is overstretched, signaling potential profit-taking opportunities.

RSI Divergence (chiefwils0n)Greetings All,
This simple indicator is a stylistic modification of the original TradingView Divergence indicator. I've enhanced the following:
Styles
RSI will turn RED when overbought and CYAN when oversold. CYAN presents an LONG opportunity, while RED is where I look for SHORT entries.
Added background color to the the Oversold/Mid-Level and Overbought/Mid-Level. The idea is to go LONG when RSI is in the GREEN channel, and consider closing your position when RSI is the RED channel. Or, SHORT in the RED, and close your position in the GREEN.
Hidden Divergences are styled with muted colors. Maroon is Hidden Bearish and Dark Green is Hidden Bullish.
Regular Divergences have brighter labels with Red (Bearish) and Lime (Bullish). My logic is to bring attention to these divergences, since they are stronger than hidden divergences.
Alerts:
I also added the following alerts:
Bullish Divergence
Hidden Bullish Divergence
Bearish Divergence
Hidden Bearish Divergence
RSI Overbought
RSI Oversold'
The alerts really distinguish this script for me. I hope you enjoy.
Happy Trading!
SMT Divergence ICT 02 [TradingFinder] Smart Money Technique SMC🔵 Introduction
SMT Divergence (Smart Money Technique Divergence) is a price action-based trading concept that detects discrepancies in market behavior between two assets that are generally expected to move in the same direction. Rooted in ICT (Inner Circle Trader) methodology, this approach helps traders recognize subtle signs of market manipulation or imbalance, often ahead of traditional indicators.
The core idea behind SMT divergence is simple: when two correlated instruments—such as currency pairs, indices, or assets from the same sector—start forming different swing points (highs or lows), this can reveal a lack of confirmation in the trend. Such divergence is often a precursor to a price reversal or pause in momentum.
This technique works effectively across various markets including Forex, stocks, and cryptocurrencies. It’s particularly valuable when used alongside concepts like liquidity sweeps, market structure breaks (MSBs), or order block identification.
In advanced use cases, Sequential SMT helps uncover patterns of alternating divergences across sessions, often signaling engineered liquidity traps before price reacts.
When combined with the Quarterly Theory—which segments market behavior into Accumulation, Manipulation, Distribution, and Continuation/Reversal phases—traders gain insight not only into where divergence happens, but when it's most likely to be significant within the market cycle.
Bullish SMT :
Bullish SMT Divergence occurs when one asset prints a higher low while the correlated asset forms a lower low. This asymmetry often suggests that the downside move is losing strength, hinting at a potential bullish shift.
Bearish SMT :
Bearish SMT Divergence is formed when one asset creates a higher high, while the second asset fails to confirm by printing a lower high. This typically signals weakening bullish pressure and the possibility of a reversal to the downside.
🔵 How to Use
The SMT Divergence indicator is designed to detect imbalances between two positively correlated assets—such as major currency pairs, indices, or commodities. These divergences often indicate early signs of market inefficiency or smart money manipulation and can help traders anticipate trend shifts with higher precision.
Unlike traditional divergence indicators or earlier versions of this script, this upgraded version does not rely solely on consecutive pivot comparisons. Instead, it dynamically scans all available pivots within the chart to identify divergences at any structural level—major or minor—across the price action. This broader detection method increases the reliability and frequency of meaningful SMT signals.
Moreover, when integrated with Sequential SMT logic, the indicator is capable of identifying multiple divergence sequences across sessions. These sequences often signal engineered liquidity traps and can be mapped within the Quarterly Theory framework, allowing traders to pinpoint not just the presence of divergence but also the phase of the market cycle it appears in (Accumulation, Manipulation, Distribution, or Continuation).
🟣 Bullish SMT Divergence
This signal occurs when the primary asset forms a higher low, while the correlated asset forms a lower low. This pattern implies weakening bearish momentum and a potential shift to the upside.
If the correlated asset breaks its previous low but the primary asset does not, this divergence suggests absorption of selling pressure and possible accumulation by smart money—making it a strong bullish signal, especially when aligned with a favorable market phase (e.g., the end of a manipulation phase in Q2).
🟣 Bearish SMT Divergence
This signal occurs when the primary asset creates a higher high, while the correlated asset forms a lower high. This mismatch indicates fading bullish momentum and a potential reversal to the downside.
If the correlated asset fails to confirm a breakout made by the main asset, the divergence may point to distribution or exhaustion. When seen within Q3 or Q4 phases of the Quarterly Theory, this pattern often precedes sharp declines or fake-outs engineered by smart money
🔵 Settings
⚙️ Logical Settings
Symbol : Choose the secondary asset to compare with the main chart asset (e.g., XAUUSD, US100, GBPUSD).
Pivot Period : Sets the sensitivity of the pivot detection algorithm. A smaller value increases responsiveness to price swings.
Activate Max Pivot Back : When enabled, limits the maximum number of past pivots to be considered for divergence detection.
Max Pivot Back Length : Defines how many past pivots can be used (if the above toggle is active).
Pivot Sync Threshold : The maximum allowed difference (in bars) between pivots of the two assets for them to be compared.
Validity Pivot Length : Defines the time window (in bars) during which a divergence remains valid before it's considered outdated.
🎨 Display Settings
Show Bullish SMT Line : Draws a line connecting the bullish divergence points.
Show Bullish SMT Label : Displays a label on the chart when a bullish divergence is detected.
Bullish Color : Sets the color for bullish SMT markers (label, shape, and line).
Show Bearish SMT Line : Draws a line for bearish divergence.
Show Bearish SMT Label : Displays a label when a bearish SMT divergence is found.
Bearish Color : Sets the color for bearish SMT visual elements.
🔔 Alert Settings
Alert Name : Custom name for the alert messages (used in TradingView’s alert system).
Message Frequency :
All : Every signal triggers an alert.
Once Per Bar : Alerts once per bar regardless of how many signals occur.
Per Bar Close : Only triggers when the bar closes and the signal still exists.
Time Zone Display : Choose the time zone in which alert timestamps are displayed (e.g., UTC).
Bullish SMT Divergence Alert : Enable/disable alerts specifically for bullish signals.
Bearish SMT Divergence Alert : Enable/disable alerts specifically for bearish signals
🔵Conclusion
The SMT Plus indicator offers a refined and powerful approach to detecting smart money behavior through divergence analysis between correlated assets. By removing the limitations of consecutive pivot comparisons and allowing for broader structural detection, it captures more accurate and timely signals that often precede major market moves.
When paired with frameworks like Sequential SMT and the Quarterly Theory, the indicator not only highlights where divergence occurs, but also when in the market cycle it's most likely to matter. Its flexible settings, customizable visuals, and integrated alert system make it suitable for intraday scalpers, swing traders, and even long-term macro analysts.
Whether you're using it as a standalone decision-making tool or combining it with other ICT concepts, SMT Plus gives you an edge in recognizing manipulation, timing reversals, and staying in sync with the real market narrative—not just the chart.

RSI Divergences + Bollinger Bands█ OVERVIEW
Here's the RSI divergences with Bollingers bands.
█ CONCEPTS
5 features
1 — RSI
2 — Bollinger bands
3 — RSI signal is in another color when above 70 or below 30
4 — Looking for previous Divergences, Bullish, Bearish and Hidden Bullish and Bearish but I don't like Hidden divergences
5 — Color fill when overbuy or oversold
█ OTHER SECTIONS
I like to see it like a moutain, with snow on top and lake on bottom. I think you don't want to start walking at the top, nor sink to the bottom of the lake for ever and ever.
It is an idea of sjoerd , tip him if you like it.
An oscillator is good to know where we are in the trends, but it's not enough to run a small business of trading, you need to learn how to use it.
What is a divergence ?
Thanks to The rational investor for teaching me how to use this indicator.
Median Convergence DivergenceIntroduction
The Median Convergence Divergence (MCD) is a derivative of the Moving Average Convergence Divergence (MACD). The difference is the change in the use of the measure of central tendency. In MACD, moving average (mean) is used, whereas, in MCD, the median is used instead. The purpose of using the median is to eliminate the outlying values, which would be calculated for a moving average. The outliers would affect the value of the moving average.
For example: 3, 5, 7, 8, 5, 4, 2, 1, 6, 21, 8. The data set average is 6.3, whereas the median value is 5. There is a difference of about 23% in the example. The reason is the outlying value '21' in the data set.
As the markets are volatile, outlying values can always emerge. A moving average will consider those values; on the other hand, the median will ignore. If the strategy calls for a tool to ignore the outliers, the Median Convergence Divergence would be a great centered oscillator.
The default values have changed to suit the current trading days in a week. When the MACD was introduced, there would be six trading days in a week. Therefore, it used 12 (2 weeks), 26(4 weeks), and 9 ( 1.5 weeks). But now that there are five trading days per week. The default values are adapted to them. Feel free to change them as per your wish.
Recommended Settings
The current settings are set to be used for the Daily Time Frame: 5 day period for the fast line, a 20 day period for the slow line, and a 10 day period for the signal line. (5 days represent a trading week, 10 days is two weeks, and 20 days is 4 weeks or a month)
For the weekly charts, use 4 week period for the fast line, 13 week period for the slow line, and 8 week period for the signal line. (4 weeks represent a month, 8 weeks is two months, and 13 weeks is 3 months or quarterly)
And for monthly charts, use 3 month period for the fast line, 12 month period for the slow line, and 6 month period for the signal line. (3 months is quarterly, 6 months is bi-yearly, and 12 month is yearly)
It'll be challenging to measure for intraday since there are many different timeframes within intraday. The settings mentioned above should also be customized as per the requirements of the trading strategy.
Strategy
The strategy application is the same as the MACD, i.e., Signal Line Crossovers, Zero Line Crossovers, and Divergence.
Signal Line Crossovers: When the MCD line crosses above the Signal line, it's a bullish crossover. When the MCD line crosses below the Signal line, it's a bearish crossover.
Zero Line Crossovers: It's a bullish crossover when the MCD line crosses above the Zero line. When the MCD line crosses below the Zero Line, it's a bearish crossover.
Divergence: When price shows a lower low, but MCD shows a higher low, it's a bullish divergence. When the price shows a higher high but MCD shows a lower high, it's a bearish divergence.
Using other indicators in conjunction with the Median Convergence Divergence is recommended to take entry and exit signals.

SMT Divergences [LuxAlgo]The SMT Divergences indicator highlights SMT divergences between the chart symbol and two user-selected tickers (ES and YM by default).
A dashboard returning the SMT divergences statistics is also provided within the settings.
🔶 SETTINGS
Swing Lookback: Calculation window used to detect swing points.
Comparison Ticker: If enabled, will detect SMT divergences between the chart prices and the prices of the selected ticker.
🔹 Dashboard
Show Dashboard: Displays statistics dashboard on the chart.
Location: Location of the dashboard on the chart.
Size: Size of the displayed dashboard.
🔶 USAGE
SMT Divergences are characterized by diverging swing points between two securities.
The detection of SMT Divergences is performed by detecting swing points using the user chart prices as well as the prices of the selected external tickers. If a swing point on the chart ticker is detected at the same time on external tickers, comparison is performed.
Due to the detection requiring swing point confirmation (3 candles by default), this indicator can better be used to study price behaviors on the occurrence of an SMT divergence.
The dashboard highlights the number of SMT divergences that occurred on a swing high and swing low between the chart ticker and the selected external tickers.
The returned percentage indicates the proportion of swing highs or swing lows that led to an SMT divergence.

MACD + Divergence + Line █ OVERVIEW
Here's the classic MACD with some simples features in plus.
█ CONCEPTS
4 features
1 — Classic MACD histogram, with 4 different colors such as above or below 0, and above or below the previous bar
2 — Display option to disable EMA
3 — A signal line that show the exact point, because the histogram view might be hard to be precise
4 — Looking for previous Divergences, Bullish, Bearish and Hidden Bullish and Bearish but I don't like Hidden divergences
█ OTHER SECTIONS
An oscillator is good to know where we are in the trends, but it's not enough to run a small business of trading, you need to learn how to use it.
What is a divergence ?
Thanks to The rational investor for teaching me how to use this indicator.
CCI with Signals & Divergence [AIBitcoinTrend]👽 CCI with Signals & Divergence (AIBitcoinTrend)
The Hilbert Adaptive CCI with Signals & Divergence takes the traditional Commodity Channel Index (CCI) to the next level by dynamically adjusting its calculation period based on real-time market cycles using Hilbert Transform Cycle Detection. This makes it far superior to standard CCI, as it adapts to fast-moving trends and slow consolidations, filtering noise and improving signal accuracy.
Additionally, the indicator includes real-time divergence detection and an ATR-based trailing stop system, helping traders identify potential reversals and manage risk effectively.
👽 What Makes the Hilbert Adaptive CCI Unique?
Unlike the traditional CCI, which uses a fixed-length lookback period, this version automatically adjusts its lookback period using Hilbert Transform to detect the dominant cycle in the market.
✅ Hilbert Transform Adaptive Lookback – Dynamically detects cycle length to adjust CCI sensitivity.
✅ Real-Time Divergence Detection – Instantly identifies bullish and bearish divergences for early reversal signals.
✅ Implement Crossover/Crossunder signals tied to ATR-based trailing stops for risk management
👽 The Math Behind the Indicator
👾 Hilbert Transform Cycle Detection
The Hilbert Transform estimates the dominant market cycle length based on the frequency of price oscillations. It is computed using the in-phase and quadrature components of the price series:
tp = (high + low + close) / 3
smooth = (tp + 2 * tp + 2 * tp + tp ) / 6
detrender = smooth - smooth
quadrature = detrender - detrender
inPhase = detrender + quadrature
outPhase = quadrature - inPhase
instPeriod = 0.0
deltaPhase = math.abs(inPhase - inPhase ) + math.abs(outPhase - outPhase )
instPeriod := nz(3.25 / deltaPhase, instPeriod )
dominantCycle = int(math.min(math.max(instPeriod, cciMinPeriod), 500))
Where:
In-Phase & Out-Phase Components are derived from a detrended version of the price series.
Instantaneous Frequency measures the rate of cycle change, allowing the CCI period to adjust dynamically.
The result is bounded within a user-defined min/max range, ensuring stability.
👽 How Traders Can Use This Indicator
👾 Divergence Trading Strategy
Bullish Divergence Setup:
Price makes a lower low, while CCI forms a higher low.
Buy signal is confirmed when CCI shows upward momentum.
Bearish Divergence Setup:
Price makes a higher high, while CCI forms a lower high.
Sell signal is confirmed when CCI shows downward momentum.
👾 Trailing Stop & Signal-Based Trading
Bullish Setup:
✅ CCI crosses above -100 → Buy signal.
✅ A bullish trailing stop is placed at Low - (ATR × Multiplier).
✅ Exit if the price crosses below the stop.
Bearish Setup:
✅ CCI crosses below 100 → Sell signal.
✅ A bearish trailing stop is placed at High + (ATR × Multiplier).
✅ Exit if the price crosses above the stop.
👽 Why It’s Useful for Traders
Hilbert Adaptive Period Calculation – No more fixed-length periods; the indicator dynamically adapts to market conditions.
Real-Time Divergence Alerts – Helps traders anticipate market reversals before they occur.
ATR-Based Risk Management – Stops automatically adjust based on volatility.
Works Across Multiple Markets & Timeframes – Ideal for stocks, forex, crypto, and futures.
👽 Indicator Settings
Min & Max CCI Period – Defines the adaptive range for Hilbert-based lookback.
Smoothing Factor – Controls the degree of smoothing applied to CCI.
Enable Divergence Analysis – Toggles real-time divergence detection.
Lookback Period – Defines the number of bars for detecting pivot points.
Enable Crosses Signals – Turns on CCI crossover-based trade signals.
ATR Multiplier – Adjusts trailing stop sensitivity.
Disclaimer: This indicator is designed for educational purposes and does not constitute financial advice. Please consult a qualified financial advisor before making investment decisions.

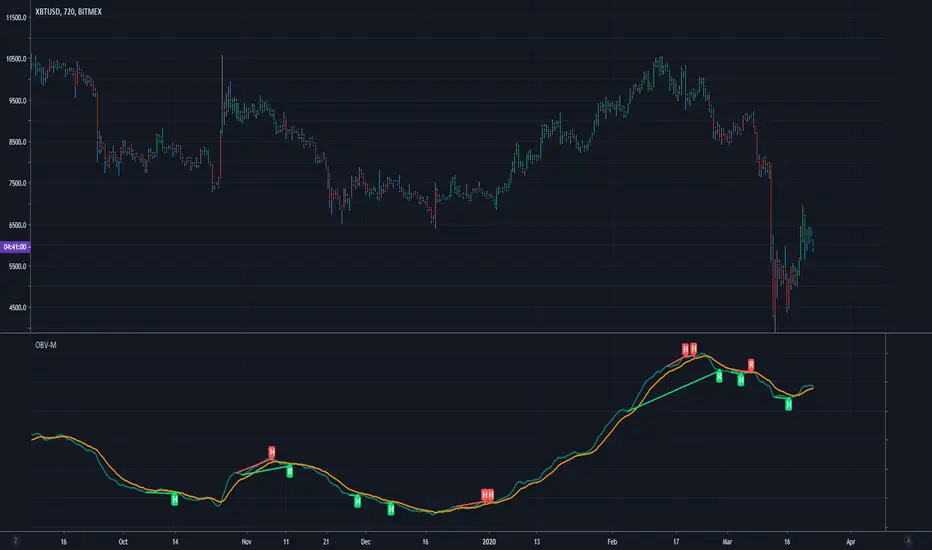
Modified OBV w/ Divergence Detection by CryptorhythmsApirine OBV-M Modified OBV w/ MA Selection by Cryptorhythms
Intro
Released in the April 2020 issue of TASC, and created by Vitali Apirine.
Description
OBV-M is of course based on the classic indicator on balance volume originally developed by Joe Granville. Apirine then smooths the calculation and adds a signal line to help denote entry and exit points.
As the author points out uts also great at showing divergences!
Extras
As usual when porting indicators to the library here on tradingview, I like to add some extra flare!
💠MA selection to allow you to experiment with alternate settings
💠Bar coloration based on trade state for easy visual at a glance chart checking
💠Divergence Detection and plotting thanks for Ricardo Santos' script
Enjoy!
👍 We hope you enjoyed this indicator and find it useful! We post free crypto analysis, strategies and indicators regularly. This is our 78th script on Tradingview!
RSI Momentum Divergence Zones [ChartPrime]⯁ OVERVIEW
RSI Momentum Divergence Zones is a hybrid oscillator and chart overlay tool that detects RSI-based momentum divergences and projects them as key zones on the chart. By combining RSI divergence logic with horizontal level plotting, this indicator reveals high-probability support and resistance areas where price has historically reacted to hidden or classic divergences.
⯁ KEY FEATURES
Momentum-Based RSI Source:
Instead of the classic RSI input, this tool uses the momentum of price as the RSI source:
rsiSrc = ta.mom(close, 10)
This emphasizes acceleration and deceleration of price moves, sharpening divergence signals and making them more responsive to early shifts in momentum.
Automatic Divergence Detection (Optional):
When enabled, the indicator continuously scans for:
— Bullish Divergence : Price makes a Lower Low while RSI forms a Higher Low
— Bearish Divergence : Price makes a Higher High while RSI forms a Lower High
It ensures divergence is valid by checking the spacing between pivots (min 5, max 50 bars).
Divergence Labels & Markers (RSI Pane + Chart):
When a valid divergence is detected:
— On RSI pane:
Labels appear at HL/LH points (“Bull” / “Bear”)
Colored lines show pivot structures
— On price chart:
Labels (“▲ Bull” / “Bear ▼”) mark price pivot that triggered the divergence
Lines highlight the exact price level at the divergence origin
Divergence Zones / Levels (Toggleable):
The indicator projects horizontal zones across the chart based on confirmed divergence points.
These levels dynamically extend as long as price respects them, and auto-expire once broken.
They act as S/R levels created by market imbalance caused by divergence reactions.
Dynamic Zone Extension Logic:
Once plotted, divergence levels will extend to the right:
— If price respects the level, the zone keeps growing
— If broken in the opposite direction, the level stops extending and turns dashed (visually showing break)
Zone Layering and Limit Control:
You can limit the number of simultaneous zones shown on the chart (e.g., 10 most recent).
Old zones automatically expire and are removed to keep the chart clean and focused.
Color Customization and Intensity:
Different colors for bullish and bearish zones let you easily distinguish trend direction.
Background fill, line width, and transparency are all adjustable.
Clean Zone Management with Arrays:
Behind the scenes, the script uses custom divLevel type arrays to manage plotted levels, ensuring they stay up-to-date, extend correctly, and delete once invalidated.
⯁ USAGE
Use bullish divergence zones as potential demand areas and bearish ones as supply zones.
Combine RSI pane labels with price-level zones to confirm strength of reversal.
Watch for price approaching a divergence level to anticipate reactions or breakouts.
Use divergence levels as trade triggers, stop-loss guides, or take-profit markers.
Limit signal count using the “Qty Divergence Zones” setting to reduce chart clutter.
Enable divergence detection only when you want to focus on key structural zones — ideal for swing or positional setups.
⯁ CONCLUSION
RSI Momentum Divergence Zones blends oscillator divergence logic with price action structure to uncover hidden strength or weakness in the market. With flexible zone plotting and clean visual signals, this tool empowers traders to identify where momentum turns into structure — turning hidden signals into tradable edges.

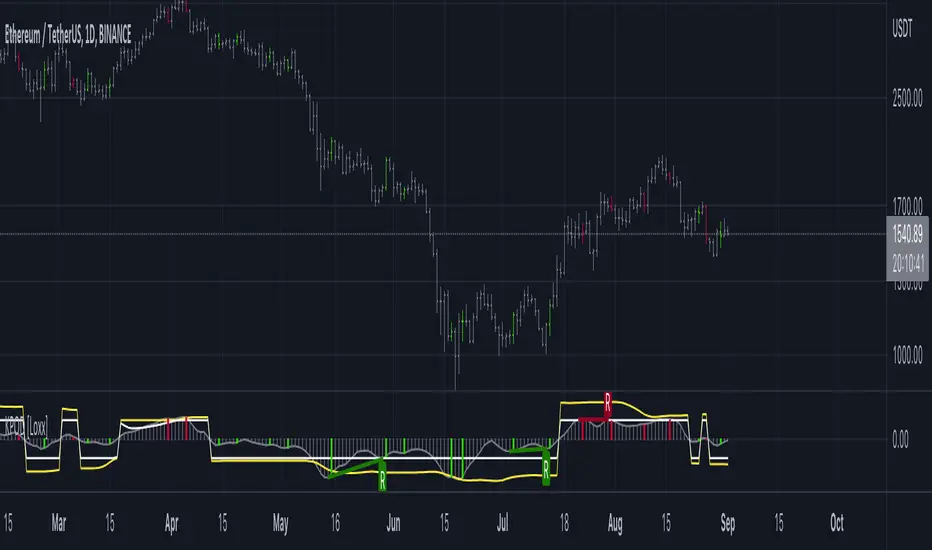
Kase Peak Oscillator w/ Divergences [Loxx]Kase Peak Oscillator is unique among first derivative or "rate-of-change" indicators in that it statistically evaluates over fifty trend lengths and automatically adapts to both cycle length and volatility. In addition, it replaces the crude linear mathematics of old with logarithmic and exponential models that better reflect the true nature of the market. Kase Peak Oscillator is unique in that it can be applied across multiple time frames and different commodities.
As a hybrid indicator, the Peak Oscillator also generates a trend signal via the crossing of the histogram through the zero line. In addition, the red/green histogram line indicates when the oscillator has reached an extreme condition. When the oscillator reaches this peak and then turns, it means that most of the time the market will turn either at the present extreme, or (more likely) at the following extreme.
This is both a reversal and breakout/breakdown indicator. Crosses above/below zero line can be used for breakouts/breakdowns, while the thick green/red bars can be used to detect reversals
The indicator consists of three indicators:
The PeakOscillator itself is rendered as a gray histogram.
Max is a red/green solid line within the histogram signifying a market extreme.
Yellow line is max peak value of two (by default, you can change this with the deviations input settings) standard deviations of the Peak Oscillator value
White line is the min peak value of two (by default, you can change this with the deviations input settings) standard deviations of the PeakOscillator value
The PeakOscillator is used two ways:
Divergence: Kase Peak Oscillator may be used to generate traditional divergence signals. The difference between it and traditional divergence indicators lies in its accuracy.
PeakOut: The second use is to look for a Peak Out. A Peak Out occurs when the histogram breaks beyond the PeakOut line and then pulls back. A Peak Out through the maximum line will be displayed magenta. A Peak Out, which only extends through the Peak Min line is called a local Peak Out, and is less significant than a normal Peak Out signal. These local Peak Outs are to be relied upon more heavily during sideways or corrective markets. Peak Outs may be based on either the maximum line or the minimum line. Maximum Peak Outs, however, are rarer and thus more significant than minimum Peak Outs. The magnitude of the price move may be greater following the maximum Peak Out, but the likelihood of the break in trend is essentially the same. Thus, our research indicates that we should react equally to a Peak Out in a trendy market and a Peak Min in a choppy or corrective market.
Included:
Bar coloring
Alerts
TSI Strength Meter vs USD with divergenceThis indicator consists of two lines. One is a gray line (USD) and the asset indicator is green or red.
The basis of this indicator is the true strength indicator (TSI) with parameters 5,15. Both line sets are based on a TSI (5,15).
The lookback period is for new highs / new lows. Default value is 200 periods.
GREEN/RED LINE
The first that is green and red is whatever you choose to display ( BTC in this case).
The green and red lines indicate going up or going down.
GRAY LINE
The gray line is the US Dollar . So everything is relative to that by default.
ZERO LINE CROSSES
These are momentum shifts. If you see a crossover of both around the zero line, its a good indication there is a change in momentum and a reversal of trend.
NEW HIGHS NEW LOWS
There are 4 new colors added to this indicator. For the asset you are viewing, a lime color means new highs within the lookback period. A new low is indicated by a yellow line color.
The new lows for the USD are white for new lows within the lookback period and blue line for the new highs.
DIVERGENCE
You can also spot divergences easily. For example, if a lime color is seen on the indicator line, that means "new high" but if it occurs below the last "new high" it means the asset is going up to new highs but the indicator is showing us that the readings are below the previous new highs, indicating a negative divergence.
The same goes for the yellow colored lines. higher yellows mean positive divergence.
And with the US Dollar , blue lines dropping means a negative divergence in the US Dollar , while white lines moving up means a positive dollar divergence.
INTERPRETATION
Examples:
If you see a green and sometimes red line of the asset indicator and a gray line that drops below the zero line; it may mean the asset is rising and the trend is up.
If you see a green and red line below the zero line and with a gray line above the zero line , it indicates there is a negative trend. If you suddenly see blue lines on the USD, this means its hitting new lows. If these blue lines then start to slowly move downwards; then we have a positive divergence. If that were to be followed by the green line crossing the zero line, its a pretty good be that the trend is changing and its a very good buying oportunity.

MA Divergences for any indicatorThis is a mod of Tistas mod of the default RSI divergences.
www.tradingview.com
This is a SMA that can be applied to any indicator for divergence seeking. This can be useful if you use a custom indicator script and want divergences added, or for any oscillator really. Set the length to 1 and it will mirror the oscillator in question.

CCI Low/High DivergencesThis CCI Divergences indicator uses the candle low values to find bullish divergences and candle high values to find bearish divergences.
